53 Plantation Way · Winchendon, MA
Flood risk 1/10 · Minimal
- FEMA flood zone
- X (unshaded)
- Chance of flooding over 30 yrs
- 0.0%
- Est. flood insurance / yr
- $507 – $1,088
Fire risk 2/10 · Minimal
- Est. fire insurance / yr
- $507 – $941
Heat risk 2/10 · Minimal
- Hot days now (above 91°F)
- 7 days/yr
- Hot days in 30 yrs
- 16 days/yr
Wind risk 4/10 · Minor
- Chance of severe wind over 30 yrs
- 17.0%
Air-quality risk 2/10 · Minimal
- Unhealthy air days now
- 1 days/yr
- Unhealthy air days in 30 yrs
- 1 days/yr
Risk factors via First Street. Map © Google.
Why this score? — see what drove the D+ grade
The composite is a weighted blend of 9 inputs, each scored 0–100. Each bar is that input's sub-score; the figure is the points it added to the 100-point composite (weight × sub-score).
- Cash flow +16.9/30.0
- Appreciation +10.0/10.0
- 1% rule +5.4/10.0
- DSCR +5.3/10.0
- Livability +3.6/5.0
- Schools +2.7/10.0
- Rent growth +2.5/5.0
- Condition / age +2.5/5.0
- ARV discount +0.0/15.0
$180,000
🖨 Deal sheet 📄 Offer letter ✓ Due diligence
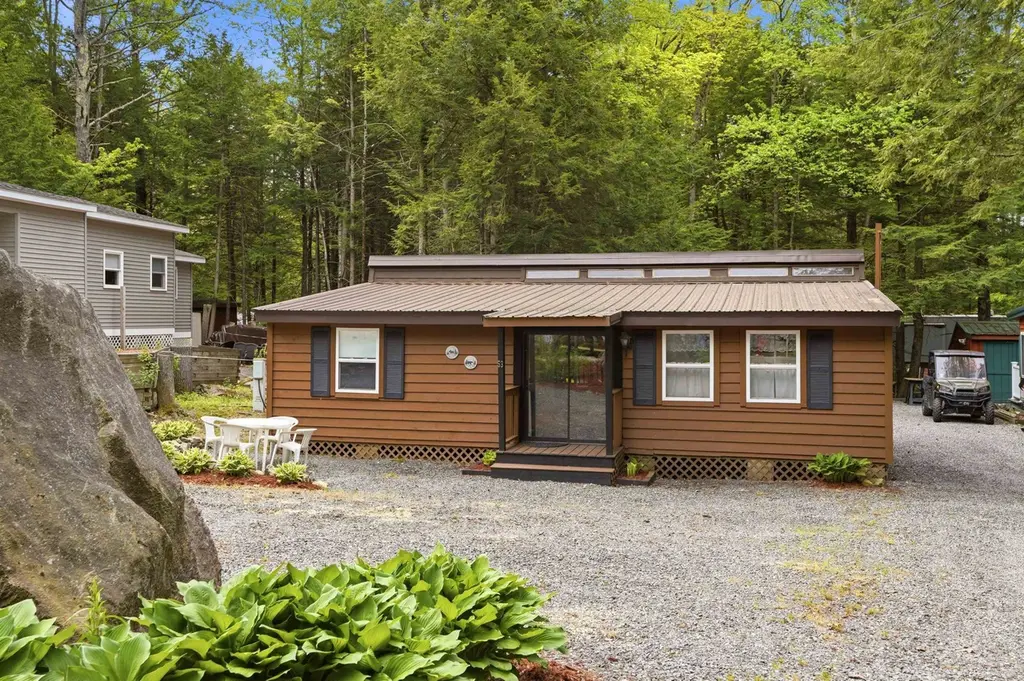
Listing remarks
Welcome to 53 Plantation Way, a well-maintained rare 3-bedroom 1.5 bath home located in the desirable Woodbrook Camp and Tennis Club gated community in Fitzwilliam NH. Situated on a beautiful flat well landscaped lot, this property offers access to exceptional association amenities including an in-ground pool, clubhouse, beautiful sandy beach, and great bass fishing. Expansive screened in porch for those warm Summer nights entertaining. Over flow storage in the newly constructed shed. Sellers have left nothing for you to do but move in and enjoy! This location within the community is amongst well maintained homes and the least traveled area. Conveniently located near shopping, dining, golf
Key facts
- Sandy beach
- Screened in porch
- Clubhouse
Tags
Property features AI
Finance
- HOA & community: Condo fees apply (annual); Annual condo fee of $1,850 covering water and sewer (Condo Association Fee)
Exterior
- Parking: Driveway parking (crushed stone)
- Utilities: Community water; Community sewer; Circuit breaker electrical with underground service; Fiber optic internet available; Telephone available; Eastern Propane fuel service
- Home design: Cabin / Ranch style; Manufactured home; Brown exterior; Metal roof; Built in 1988; Single-story (main living on one level)
- Construction: Wood frame construction; Wood exterior; Metal roof
- Exterior features: Condo development with landscaped, level grounds; Country setting with lake/pond access to Sip Pond (shared/private beach access); Near shopping and skiing; Crushed stone driveway; Road frontage is association/gravel/shared
Interior
- Kitchen: Eat-in kitchen; Exhaust hood; Refrigerator; Gas stove
- Bedrooms: Master bedroom suite on main level; Two additional bedrooms on main level
- Bathrooms: One full bathroom; One half bathroom
- Heating & cooling: Wall furnace heating
- Interior features: Five total rooms; Seasonal property
Neighborhood map
What this means for you Summary
Snapshot
- This is a 1-bed/1.0-bath manufactured listed at $180k.
Deal economics
- At list price, monthly cash flow is $120 ($1k/yr) — positive.
- The deal already cash-flows at list — no discount required.
- Meets the 1% rule at list price ($2k rent vs $180k).
- Recommended offer: $177k (1.5% below list) — sets the bar for market timing.
- Cap rate 7.1% vs local median 4.2% in Winchendon — top-decile yield for the area; either an underpriced asset or a hidden risk that comps aren't pricing in. Stress-test before assuming the spread holds.
Location & tenants
- Location reads 71/100 on livability (#125 in MA) — a middle-class / working-renter tenant base. Strengths: housing A+, health & safety A+, crime A-; Watch: schools F, amenities F.
- Monadnock Regional School District (rural): math 25% / reading 36% proficiency, ranked #82 of 98 in NH (top 84%) — families likely to look elsewhere, expect single-tenant / working-renter base with shorter leases.
- Market conditions: 166 units permitted in Cheshire County in 2024 (0 in 5+ unit buildings).
Forward outlook
- In year one you build about $19k of equity ($1k loan paydown + $18k appreciation (10.0% local appreciation)).
- Cheshire County population projected at -18% by 2050 — secular population decline; favor cash flow + early exit over multi-decade hold.
- At projected returns (10.0% appreciation + 3.0% rent growth), your $50k cash investment doubles in ~3 years — after that, you're playing with house money.
- By year 2, paydown + projected appreciation supports a ~$31k cash-out refi (75% LTV) — recoverable capital for the next deal without selling this one.
Negotiation context
- It's been on market 29 days — a 2% lower offer ($177k) is reasonable based on typical stale-listing flexibility.
- Current owner paid $40k; list at $180k implies a 350% gain — meaningful room to come down on a strong offer.
Questions for the listing agent
- What does the HOA fee cover, when was the last increase, and are there any pending special assessments or reserve-fund shortfalls?
- Is there a deadline driving the sale (1031 exchange, divorce, estate, relocation)? That informs how much negotiation room exists.
- Schools are F-rated, which usually means shorter tenancies and higher turnover. Who's the typical renter profile here, and what's been the actual vacancy rate?
- The area grade is low — what's the realistic commute time and amenity access for the typical tenant pool here? Any planned neighborhood developments (good or bad) we should know about?
- What's the average days-on-market for RENTAL listings here right now (not sales)? A rising rental-DOM trend means longer vacancies and softer asking-rent achievability than the comps imply.
- What's the recent tenant-quality profile in this submarket — average credit score on applications, eviction rate, late-payment / NSF rate, and stable-employment percentage? A property-management company in the area should have these aggregated.
- How much new for-sale + rental construction is in the pipeline within 1–3 miles? Heavy new supply typically softens prices + rents 12–24 months out; constrained supply supports both.
Investment metrics
- 1% rule
- 1.04% ✓
- Cap rate
- 7.09%
- Cash-on-cash
- 2.86%
- DSCR
- 1.13
- GRM
- 8.1
CMA / ARV
- ARV (on-the-fly)
- $139,552
- Comps found
- 2
Show comp detail 2 sales within ~0.75 mi
| Address | Dist | Beds/Ba | Sqft | Sold | Price | $/sf | Match |
|---|---|---|---|---|---|---|---|
| 76 Lakeside Dr | 0.09mi | 2/1.0 (+1) | 748 (-5%) | 11mo | $65,000 | $87 | 74 |
| 63 Brook Side Rd | 0.26mi | 2/1.0 (+1) | 760 (-3%) | 13mo | $135,000 | $178 | 67 |
Match score weights: distance 35% · size 25% · config 20% · recency 20%. Top-matched comps best support the ARV.
Projected returns pro-forma
10.0% appreciation · 3.0% rent growth · sell at horizon
- IRR
- 26.4%
- Equity multiple
- 3.10×
- Total profit
- $105,772
- Equity at exit
- $162,158
- IRR
- 23.1%
- Equity multiple
- 7.06×
- Total profit
- $305,657
- Equity at exit
- $349,700
Cash invested: $50,400 (down + closing). Projections, not guarantees.
Landlord ↔ Tenant lean methodology
- Overall (STATE)
- 20 Strongly Tenant-Friendly
- State Massachusetts
- 20 Strongly Tenant-Friendly · D+15
- County
- — inherits STATE
- City
- — inherits STATE
ZIP-level market 03447
- Home prices YoY
- 24.0%
- Price-to-rent
- 8.1×
Monthly cashflow live
- Estimated rent
- $1,863 medium interval (Pro) →
- Mortgage (P&I)
- −$944
- Tax from tax record
- −$179 /mo · $2,147/yr
- Insurance
- −$75
- HOA
- −$154
- Vacancy / Maint / Mgmt
- −$391
- Net cashflow
- $120
Break-even live
UW: 25.0% down · 7.5% · 30yr · 1.5% tax · 5.0% vac · 8.0% maint · 8.0% mgmt
Financing live
Cash to close
- Down payment
- $45,000
- Closing costs
- $5,400
- Reserves months
- —
- Total cash needed
- —
Loan-product check · same deal, 3 products live
Conventional
25% down · 7.5% · 30yr
- Down + closing
- —
- Monthly P&I
- —
- Monthly cashflow
- —
- DSCR
- —
- Eligible?
- —
Personal DTI + credit; lowest rate.
DSCR
20% down · 8.5% · 30yr
- Down + closing
- —
- Monthly P&I
- —
- Monthly cashflow
- —
- DSCR
- —
- Eligible?
- —
No personal income docs; deal must DSCR.
Hard money
10% down · 12.0% · 12mo
- Down + closing
- —
- Monthly P&I
- —
- Monthly cashflow
- —
- DSCR
- —
- Eligible?
- —
Short-term bridge; refi at stabilization.
HOA detail
- Monthly dues
- $154 · $1,848/yr
- Likely covers
- poolsecurity
Listing history 18 events
-
2026-06-19days on market $180,000 Active 29 DOM
-
2026-06-18days on market $180,000 Active 28 DOM
-
2026-06-17days on market $180,000 Active 27 DOM
-
2026-06-16days on market $180,000 Active 26 DOM
-
2026-06-15days on market $180,000 Active 25 DOM
-
2026-06-14days on market $180,000 Active 23 DOM
-
2026-06-12days on market $180,000 Active 22 DOM
-
2026-06-09days on market $180,000 Active 19 DOM
-
2026-06-08days on market $180,000 Active 18 DOM
-
2026-06-07days on market $180,000 Active 17 DOM
-
2026-06-07days on market $180,000 Active 16 DOM
-
2026-06-03days on market $180,000 Active 13 DOM
-
2026-06-02days on market $180,000 Active 12 DOM
-
2026-06-01days on market $180,000 Active 11 DOM
-
2026-05-31days on market $180,000 Active 10 DOM
-
2026-05-30days on market $180,000 Active 9 DOM
-
2026-05-21$180,000 Active
-
1988-12-01soldstatus $40,000
ⓘ Source: listings_history table (triggers on properties + properties_extension) + one-shot
backfill from property_details.listing_events for pre-trigger history.
Tax reassessment forecast MA · Partial reset (capped growth)
- Current annual tax
- $2,147 · $179/mo
- Projected year-2 tax
- $2,180 · $182/mo
- Expected delta
- +$34/yr (+$3/mo · 1.6%)
ⓘ Screening estimate from a state-policy table — verify with the county assessor before closing.
Climate risk First Street
- Flood 1/10 Low FEMA zone X (unshaded) · 0% chance over 30 yrs
- Wildfire 2/10 Low
- Heat 2/10 Low 7 d/yr ≥91°F today · 16 d/yr by 30 yrs out
- Wind 4/10 Moderate 17% chance of damaging wind over 30 yrs
- Air quality 2/10 Low 1 unhealthy d/yr today · 1 by 30 yrs out
Nearby sold comps map
Loading sold comps map…
Walkable amenities ~0.75 mi
Loading nearby amenities…
Taxation est. · year 1
- Rental income
- $22,358
- − Mortgage interest
- −$10,083
- − Property taxes
- −$2,147
- − Insurance
- −$900
- − Repairs & maintenance
- −$1,789
- − Management
- −$1,789
- − HOA
- −$1,848
- − Depreciation
- −$5,236
- Taxable loss
- −$1,434
- Est. tax savings @ 24.0%
- +$344
- After-tax cash flow
- $1,784/yr
For passive investors: Depreciation is non-cash, so a rental often shows a tax loss while cash-flowing — sheltering income. Rental losses are passive: they offset passive income freely, and up to $25,000/yr can offset ordinary (W-2) income if you actively participate and your MAGI is under $100k (phasing out to $0 by $150k); unused losses carry forward. On sale, claimed depreciation is recaptured at up to 25%, and gains may owe capital-gains tax (a 1031 exchange can defer both). Figures are a year-1 estimate at your 24.0% rate — not tax advice; consult a CPA.
Schools (NCES district)
- District
- Monadnock Regional School District
- NCES district ID
- 3304890
- Math proficiency
- 25% ▼ -16.00%
- Reading proficiency
- 36% ▼ -6.00%
- Median HH income
- $56,314
- Composite
- 27.18/100
- National rank
- #7024
- State rank
- #82 of 98 in NH
Livability — Winchendon
- Score
- 71/100
- State rank
- #125
- US rank
- #6726
Category grades
Schools grade is shown separately in the Schools card above.
Census & demographics
- Population (ZIP)
- 2,317
Population outlook (Cheshire County) Hauer SSP2
- Today (2025)
- 74,613 people
- By 2030
- 72,495 · -2.8%
- By 2040
- 66,778 · -10.5%
- By 2050
- 60,963 · -18.3%
- By 2075
- 49,511 · -33.6%
- By 2100
- 39,687 · -46.8%
Race, ethnicity, and origin ACS 2023
- Neighborhood character
- Predominantly White (91%)
- Race & ethnicity
- White 91% Two or more races 8% Hispanic / Latino 7%
- Hispanic origin (detail)
- Puerto Rican 6%
- Common ancestry
- Lithuanian 11% Romanian 7% Slovene 4%
- Foreign-born
- 2% · Canada
- Languages at home
- 94% English-only · Spanish 5% French/Haitian/Cajun 1%
Political lean MEDSL · Cheshire
- 2024 margin
- Lean D (+9.8) · D 54.4% · R 44.6% · Other 1.1%
- 2008→2024 swing
- -17.8pp toward R · 2008: 27.6pp · 2024: 9.8pp
- All cycles
- 2024: D+9.8 2020: D+17.2 2016: D+12.6 2012: D+24.8 2008: D+27.6
Not yet ingested
- Civics
- —
Market trends
- HPI YoY
- ▲ 76.42%
- Current HPI
- 394.7824
- Rent YoY
- —
- Metro
- —
- State GDP YoY
- ▲ 2.28%
- F500 in state
- 38
Industry mix (Fortune 500 HQ in MA)
| Industry | F500 HQs | Revenue |
|---|---|---|
| Technology | 3 | $17B |
|
||
| Insurance | 2 | $84B |
|
||
| Retail | 2 | $76B |
|
||
| Life Sciences | 1 | $43B |
|
||
| Energy Technology | 1 | $31B |
|
||
| Aerospace / Defense | 1 | $18B |
|
||
Price history
+350.0% since first listed2 events — show timeline
- 2026-05-21 Listed $180,000 PrimeMLS
- 1988-12-01 Sold (Public Records) $40,000 Public Records
Property tax history
+5.9%/yrLatest (2024): $2,147 · +8.0% YoY. Source: county tax records.
Cash-flow waterfall
monthlySold comps — $/sqft
last 12 mo · ≤1 miLoading sold comps…