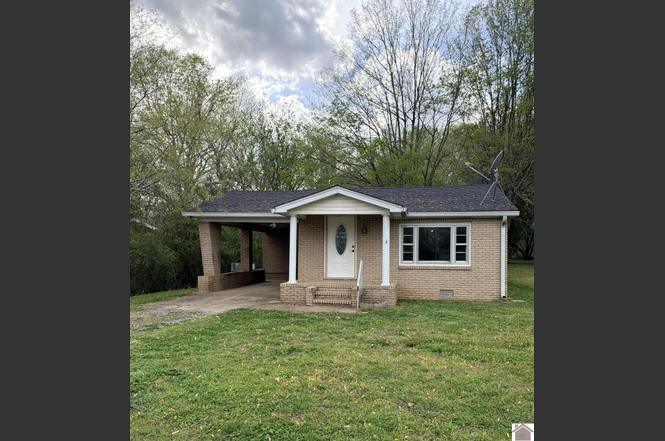
211 Lane St · Dexter, KY
Flood risk 1/10 · Minimal
- FEMA flood zone
- X (unshaded)
- Chance of flooding over 30 yrs
- 0.0%
- Est. flood insurance / yr
- $507 – $1,088
Fire risk 4/10 · Minor
- Est. fire insurance / yr
- $839 – $1,559
Heat risk 6/10 · Moderate
- Hot days now (above 109°F)
- 7 days/yr
- Hot days in 30 yrs
- 20 days/yr
Wind risk 4/10 · Minor
- Chance of severe wind over 30 yrs
- 9.0%
Air-quality risk 1/10 · Minimal
- Unhealthy air days now
- 0 days/yr
- Unhealthy air days in 30 yrs
- 0 days/yr
Risk factors via First Street. Map © Google.
Why this score? — see what drove the D grade
The composite is a weighted blend of 9 inputs, each scored 0–100. Each bar is that input's sub-score; the figure is the points it added to the 100-point composite (weight × sub-score).
- Cash flow +12.1/30.0
- ARV discount +7.5/15.0
- Schools +3.8/10.0
- DSCR +3.6/10.0
- 1% rule +3.5/10.0
- Livability +3.0/5.0
- Appreciation +2.6/10.0
- Rent growth +2.5/5.0
- Condition / age +2.5/5.0
$99,900
🖨 Deal sheet 📄 Offer letter ✓ Due diligence
Listing remarks
This brick home offering solid bones and immediate livability while allowing room for updates and repairs. This property is ideal for buyers looking to renovate at their own pace, invest, or customize a home to fit their vision. durable brick exterior, manageable size and great potential.
Key facts
- Brick home
- 0.5 acre lot
- Parking
Tags
Property features AI
Finance
- Other: Listed by RE/MAX Real Estate Associates
Exterior
- Parking: Carport with 1 space
- Home design: Single-family residential property
- Exterior features: Half-acre lot; Directions: From Murray Hwy travel onto Roosevelt Rd, turn left onto Lane Street; house is at the end on the right
Interior
- Bathrooms: One full bathroom
- Interior features: One full bathroom
Neighborhood map
What this means for you Summary
Snapshot
- This is a 2-bed/1.0-bath single-family listed at $100k.
Deal economics
- At list price, monthly cash flow is $-21 ($-252/yr) — negative.
- To cash-flow at today's rent, offer at most $97k (3.0% below list).
- To meet the 1% rule (rent ≥ 1% of price), the offer needs to be $85k (15.2% below list).
- Recommended offer: $85k (15.2% below list) — sets the bar for 1% rule.
Location & tenants
- Location reads 59/100 on livability (#425 in KY) — a working-class tenant base; expect higher turnover. Strengths: cost of living A+, housing A-; Watch: employment D, schools F, amenities F.
- Calloway County (town): math 44% / reading 48% proficiency, ranked #19 of 165 in KY (top 12%) — families likely to look elsewhere, expect single-tenant / working-renter base with shorter leases.
- Market conditions: 10 active listings in the ZIP; 81 units permitted in Calloway County in 2024 (66 in 5+ unit buildings).
Forward outlook
- Local home prices are declining (-3.0%/yr); year-one equity from $691 of loan paydown is wiped out by about $3k of value loss. Plan a longer hold.
- Calloway County population projected at +18% by 2050 — long-run rental-demand tailwind backs the buy-and-hold thesis.
Negotiation context
- It's been on market 189 days — a 12% lower offer ($88k) is reasonable based on typical stale-listing flexibility.
Risks & watch-outs
- Watch-outs: built in 1955 — expect roof / HVAC / electrical / plumbing capex.
- Climate carrying-cost: extreme-heat days projected 7→20/yr by 2055 (HVAC capex compounding) — expect insurance premiums to compound above CPI over the hold.
Questions for the listing agent
- What do current leases actually rent for vs. the listed asking? Can we see a recent rent roll and the last 12 months of T-12 income?
- It's been on market 189 days. Have you received any prior offers? Is the seller open to a 15% concession, seller financing, or rate buy-down credit?
- Built in 1955 — when were the roof, HVAC, electrical panel, plumbing, and water heater last replaced?
- Why hasn't it sold? Are there any deal-killer items the seller is aware of (foundation, flood, title, zoning, code violations)?
- Is there a deadline driving the sale (1031 exchange, divorce, estate, relocation)? That informs how much negotiation room exists.
- Schools are F-rated, which usually means shorter tenancies and higher turnover. Who's the typical renter profile here, and what's been the actual vacancy rate?
- The area grade is low — what's the realistic commute time and amenity access for the typical tenant pool here? Any planned neighborhood developments (good or bad) we should know about?
- What's the average days-on-market for RENTAL listings here right now (not sales)? A rising rental-DOM trend means longer vacancies and softer asking-rent achievability than the comps imply.
- What's the recent tenant-quality profile in this submarket — average credit score on applications, eviction rate, late-payment / NSF rate, and stable-employment percentage? A property-management company in the area should have these aggregated.
- How much new for-sale + rental construction is in the pipeline within 1–3 miles? Heavy new supply typically softens prices + rents 12–24 months out; constrained supply supports both.
Investment metrics
- 1% rule
- 0.85% ✗
- Cap rate
- 6.04%
- Cash-on-cash
- -0.90%
- DSCR
- 0.96
- GRM
- 9.8
CMA / ARV
No comps found within radius.
Projected returns pro-forma
-3.0% appreciation · 3.0% rent growth · sell at horizon
- IRR
- -17.8%
- Equity multiple
- 0.37×
- Total profit
- $-17,514
- Equity at exit
- $14,895
- IRR
- -9.9%
- Equity multiple
- 0.40×
- Total profit
- $-16,922
- Equity at exit
- $8,638
Cash invested: $27,972 (down + closing). Projections, not guarantees.
Landlord ↔ Tenant lean methodology
- Overall (STATE)
- 83 Strongly Landlord-Friendly
- State Kentucky
- 83 Strongly Landlord-Friendly · R+16
- County
- — inherits STATE
- City
- — inherits STATE
ZIP-level market 42036
- Home prices YoY
- -2.4%
- Active inventory
- 10
- Price-to-rent
- 9.8×
Monthly cashflow live
- Estimated rent
- $847 medium interval (Pro) →
- Mortgage (P&I)
- −$524
- Tax est. 1.5%
- −$125 /mo · $1,498/yr
- Insurance
- −$42
- HOA
- −$0
- Vacancy / Maint / Mgmt
- −$178
- Net cashflow
- $-21
Break-even live
UW: 25.0% down · 7.5% · 30yr · 1.5% tax · 5.0% vac · 8.0% maint · 8.0% mgmt
Financing live
Cash to close
- Down payment
- $24,975
- Closing costs
- $2,997
- Reserves months
- —
- Total cash needed
- —
Loan-product check · same deal, 3 products live
Conventional
25% down · 7.5% · 30yr
- Down + closing
- —
- Monthly P&I
- —
- Monthly cashflow
- —
- DSCR
- —
- Eligible?
- —
Personal DTI + credit; lowest rate.
DSCR
20% down · 8.5% · 30yr
- Down + closing
- —
- Monthly P&I
- —
- Monthly cashflow
- —
- DSCR
- —
- Eligible?
- —
No personal income docs; deal must DSCR.
Hard money
10% down · 12.0% · 12mo
- Down + closing
- —
- Monthly P&I
- —
- Monthly cashflow
- —
- DSCR
- —
- Eligible?
- —
Short-term bridge; refi at stabilization.
Listing history 16 events
-
2026-06-19days on market $99,900 Active 189 DOM
-
2026-06-18days on market $99,900 Active 188 DOM
-
2026-06-17days on market $99,900 Active 187 DOM
-
2026-06-16days on market $99,900 Active 186 DOM
-
2026-06-15days on market $99,900 Active 185 DOM
-
2026-06-14days on market $99,900 Active 183 DOM
-
2026-06-12days on market $99,900 Active 182 DOM
-
2026-06-09days on market $99,900 Active 179 DOM
-
2026-06-08days on market $99,900 Active 178 DOM
-
2026-06-07days on market $99,900 Active 177 DOM
-
2026-06-02days on market $99,900 Active 172 DOM
-
2026-06-01days on market $99,900 Active 171 DOM
-
2026-05-31days on market $99,900 Active 170 DOM
-
2026-05-30days on market $99,900 Active 169 DOM
-
2026-04-20price $99,900
-
2025-12-12$109,000 Active
ⓘ Source: listings_history table (triggers on properties + properties_extension) + one-shot
backfill from property_details.listing_events for pre-trigger history.
Climate risk First Street
- Flood 1/10 Low FEMA zone X (unshaded) · 0% chance over 30 yrs
- Wildfire 4/10 Moderate
- Heat 6/10 Major 7 d/yr ≥109°F today · 20 d/yr by 30 yrs out
- Wind 4/10 Moderate 9% chance of damaging wind over 30 yrs
- Air quality 1/10 Low 0 unhealthy d/yr today · 0 by 30 yrs out
Nearby sold comps map
Loading sold comps map…
Walkable amenities ~0.75 mi
Loading nearby amenities…
Taxation est. · year 1
- Rental income
- $10,168
- − Mortgage interest
- −$5,596
- − Property taxes
- −$1,498
- − Insurance
- −$500
- − Repairs & maintenance
- −$813
- − Management
- −$813
- − Depreciation
- −$2,906
- Taxable loss
- −$1,959
- Est. tax savings @ 24.0%
- +$470
- After-tax cash flow
- $218/yr
For passive investors: Depreciation is non-cash, so a rental often shows a tax loss while cash-flowing — sheltering income. Rental losses are passive: they offset passive income freely, and up to $25,000/yr can offset ordinary (W-2) income if you actively participate and your MAGI is under $100k (phasing out to $0 by $150k); unused losses carry forward. On sale, claimed depreciation is recaptured at up to 25%, and gains may owe capital-gains tax (a 1031 exchange can defer both). Figures are a year-1 estimate at your 24.0% rate — not tax advice; consult a CPA.
Schools (NCES district)
- District
- Calloway County
- NCES district ID
- 2100870
- Math proficiency
- 44% ▼ -12.00%
- Reading proficiency
- 48% ▼ -13.00%
- Median HH income
- $38,849
- Composite
- 38.39/100
- National rank
- #4208
- State rank
- #19 of 165 in KY
Livability — Dexter
- Score
- 59/100
- State rank
- #425
- US rank
- #20528
Category grades
Schools grade is shown separately in the Schools card above.
Census & demographics
- Census place
- Dexter, KY
- Population (ZIP)
- 1,289
Population outlook (Calloway County) Hauer SSP2
- Today (2025)
- 41,071 people
- By 2030
- 42,608 · +3.7%
- By 2040
- 45,435 · +10.6%
- By 2050
- 48,501 · +18.1%
- By 2075
- 56,481 · +37.5%
- By 2100
- 63,271 · +54.1%
Race, ethnicity, and origin ACS 2023
- Neighborhood character
- Predominantly White (95%)
- Race & ethnicity
- White 95% Hispanic / Latino 5%
- Common ancestry
- Italian 8% Portuguese 1% Romanian 1%
- Foreign-born
- 5% · Canada
Political lean MEDSL · Calloway
- 2024 margin
- Solid R (+38.0) · D 30.2% · R 68.1% · Other 1.7%
- 2008→2024 swing
- -19.6pp toward R · 2008: -18.4pp · 2024: -38.0pp
- All cycles
- 2024: R+38.0 2020: R+31.8 2016: R+35.0 2012: R+27.4 2008: R+18.4
Not yet ingested
- Civics
- —
Market trends
- HPI YoY
- ▼ -4.77%
- Current HPI
- 191.5
- Rent YoY
- —
- Metro
- —
- State GDP YoY
- ▲ 1.81%
- F500 in state
- 4
Industry mix (Fortune 500 HQ in KY)
| Industry | F500 HQs | Revenue |
|---|---|---|
| Healthcare | 1 | $118B |
|
||
| Food / Beverage | 1 | $7B |
|
||
Price history
-8.3% since first listed2 events — show timeline
- 2026-04-20 Price Changed $99,900 WKRMLS
- 2025-12-12 Listed $109,000 WKRMLS
Property tax history
+5.7%/yrLatest (2025): $162 · -36.7% YoY. Source: county tax records.
Cash-flow waterfall
monthlySold comps — $/sqft
last 12 mo · ≤1 miLoading sold comps…