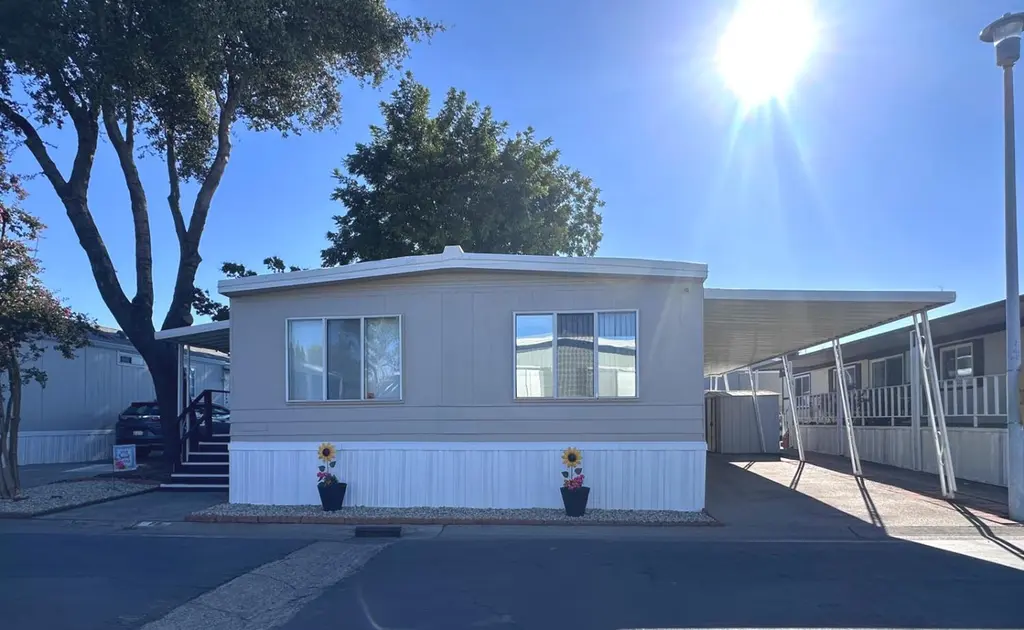
5040 Jackson St #76 · North Highlands, CA
Flood risk 1/10 · Minimal
- FEMA flood zone
- X (unshaded)
- Chance of flooding over 30 yrs
- 0.0%
- Est. flood insurance / yr
- $507 – $1,088
Fire risk 1/10 · Minimal
- Est. fire insurance / yr
- $659 – $1,223
Heat risk 7/10 · Major
- Hot days now (above 102°F)
- 7 days/yr
- Hot days in 30 yrs
- 14 days/yr
Wind risk 1/10 · Minimal
- Chance of severe wind over 30 yrs
- —
Air-quality risk 10/10 · Severe
- Unhealthy air days now
- 34 days/yr
- Unhealthy air days in 30 yrs
- 38 days/yr
Risk factors via First Street. Map © Google.
Why this score? — see what drove the B+ grade
The composite is a weighted blend of 9 inputs, each scored 0–100. Each bar is that input's sub-score; the figure is the points it added to the 100-point composite (weight × sub-score).
- Cash flow +30.0/30.0
- ARV discount +12.5/15.0
- 1% rule +10.0/10.0
- DSCR +10.0/10.0
- Rent growth +3.9/5.0
- Schools +3.1/10.0
- Livability +3.1/5.0
- Condition / age +2.5/5.0
- Appreciation +0.0/10.0
$90,000
🖨 Deal sheet 📄 Offer letter ✓ Due diligence
Listing remarks
Welcome to this spacious 1,584 sq. ft. home located in the desirable 55+ Lamplighter community. Offering 3 bedrooms and 2 bathrooms, this well-maintained residence features updated LVP flooring, new carpet, and bright white cabinetry with plenty of storage throughout. The open-concept kitchen includes recessed lighting, a convenient breakfast bar, and seamlessly connects to both the living and family rooms, creating an ideal space for everyday living and entertaining. Additional highlights include a versatile sunroom, decorative display shelving, and a generous primary suite with direct access to the backyard. Outdoors, you'll find room for gardening, pets, or relaxing, along with a storage
Key facts
- New carpet
- Open-concept kitchen
- Updated lvp flooring
Tags
Property features AI
Finance
- Financial info: Land lease amount listed but property marked as not land-lease (information available)
- HOA & community: No homeowners association; Located in a senior community; Not land-leased
Exterior
- Parking: Covered parking for 2
- Utilities: Public water; Public sewer; Cable available; Electric: 220V in laundry
- Home design: Manufactured home in park; Double-wide; 1973 construction
- Construction: Aluminum skirting; Other roof type; Copperwood manufacturer/make
- Exterior features: Close to clubhouse; Covered parking/deck
Interior
- Kitchen: Free-standing refrigerator; Built-in gas oven; Built-in gas range; Range hood; Garbage disposal
- Bedrooms: 3 bedrooms
- Flooring: Carpet
- Bathrooms: 2 full bathrooms; Double sinks; Tub with shower over
- Heating & cooling: Central heating; Central cooling; Gas water heater
- Interior features: Sun room; Great room; Open living/dining/family areas; Dining bar; Formal dining area; Wood counters
- Laundry & utility: Washer and dryer included; 220V outlet in laundry
Neighborhood map
What this means for you Summary
Snapshot
- This is a 3-bed/2.0-bath manufactured listed at $90k.
Deal economics
- At list price, monthly cash flow is $1k ($16k/yr) — positive.
- The deal already cash-flows at list — no discount required.
- Meets the 1% rule at list price ($2k rent vs $90k).
- Cap rate 23.7% vs local median 4.1% in North Highlands — top-decile yield for the area; either an underpriced asset or a hidden risk that comps aren't pricing in. Stress-test before assuming the spread holds.
Location & tenants
- Location reads 61/100 on livability (#523 in CA) — a middle-class / working-renter tenant base. Strengths: housing A+; Watch: employment C-, schools D, crime F.
- Twin Rivers Unified (suburban): math 29% / reading 37% proficiency, ranked #970 of 1,400 in CA (top 69%) — families likely to look elsewhere, expect single-tenant / working-renter base with shorter leases; 76% free/reduced lunch — lower-income household profile, screen leases tightly.
- Market conditions: Rents rising fast (+5.7%/yr); 108 active listings in the ZIP; 12 comparable units currently listed for rent nearby; rentals at typical pace (median 15d on market — plan ~3-4 weeks tenant-placement turnaround); 6,825 units permitted in Sacramento County in 2024 (1,752 in 5+ unit buildings).
- This rent runs 41% of the median local income ($68k/yr) — at the standard rent-burdened threshold; future hikes will face affordability resistance.
Forward outlook
- Local home prices are declining (-3.0%/yr); year-one equity from $622 of loan paydown is wiped out by about $3k of value loss. Plan a longer hold.
- Sacramento County population projected at +17% by 2050 — long-run rental-demand tailwind backs the buy-and-hold thesis.
- At projected returns (-3.0% appreciation + 5.7% rent growth), your $25k cash investment doubles in ~2 years — after that, you're playing with house money.
Negotiation context
- Only 14 days on market — expect competitive offers; lowballing is unlikely to land.
Risks & watch-outs
- Climate carrying-cost: extreme-heat days projected 7→14/yr by 2055 (HVAC capex compounding) — expect insurance premiums to compound above CPI over the hold.
Questions for the listing agent
- Built in 1973 — when were the roof, HVAC, electrical panel, plumbing, and water heater last replaced?
- Is there a deadline driving the sale (1031 exchange, divorce, estate, relocation)? That informs how much negotiation room exists.
- Schools are D-rated, which usually means shorter tenancies and higher turnover. Who's the typical renter profile here, and what's been the actual vacancy rate?
- Crime grade is F in this area — have there been break-ins, vandalism, or insurance claims at this property in the last 3 years? What carrier currently insures it and at what premium?
- What's the average days-on-market for RENTAL listings here right now (not sales)? A rising rental-DOM trend means longer vacancies and softer asking-rent achievability than the comps imply.
- What's the recent tenant-quality profile in this submarket — average credit score on applications, eviction rate, late-payment / NSF rate, and stable-employment percentage? A property-management company in the area should have these aggregated.
- How much new for-sale + rental construction is in the pipeline within 1–3 miles? Heavy new supply typically softens prices + rents 12–24 months out; constrained supply supports both.
Investment metrics
- 1% rule
- 2.57% ✓
- Cap rate
- 23.68%
- Cash-on-cash
- 62.08%
- DSCR
- 3.76
- GRM
- 3.2
CMA / ARV
- ARV (on-the-fly)
- $101,376
- Comps found
- 11
Show comp detail 11 sales within ~0.75 mi
| Address | Dist | Beds/Ba | Sqft | Sold | Price | $/sf | Match |
|---|---|---|---|---|---|---|---|
| 5040 Jackson St #76 | 0.00mi | 3/2.0 | 1,584 (0%) | 9mo | $85,000 | $54 | 93 |
| 5040 Jackson St #54 | 0.14mi | 3/2.0 | 1,512 (-4%) | 10mo | $75,000 | $50 | 77 |
| 5040 Jackson St #60 | 0.04mi | 2/2.0 (-1) | 1,440 (-9%) | 4mo | $75,000 | $52 | 74 |
| 5040 Jackson St #44 | 0.20mi | 2/2.0 (-1) | 1,536 (-3%) | 9mo | $74,000 | $48 | 73 |
| 5040 Jackson St #110 | 0.13mi | 3/2.0 | 1,440 (-9%) | 12mo | $81,500 | $57 | 69 |
| 4963 Eleven Oaks Ln | 0.48mi | 3/2.0 | 1,536 (-3%) | 6mo | $140,000 | $91 | 68 |
| 5040 Jackson St #40 | 0.17mi | 3/2.0 | 1,475 (-7%) | 20mo | $107,000 | $73 | 64 |
| 5040 Jackson St #173 | 0.04mi | 2/2.0 (-1) | 1,440 (-9%) | 18mo | $97,000 | $67 | 63 |
| 5040 Jackson St #154 | 0.04mi | 2/2.0 (-1) | 1,440 (-9%) | 20mo | $96,000 | $67 | 61 |
| 3655 N Ohio Ln #87 | 0.38mi | 2/2.0 (-1) | 1,522 (-4%) | 13mo | $120,000 | $79 | 60 |
| 5064 - 5477 S Valley Forge Ln #25 | 0.46mi | 3/2.0 | 1,400 (-12%) | 7mo | $88,900 | $64 | 54 |
Match score weights: distance 35% · size 25% · config 20% · recency 20%. Top-matched comps best support the ARV.
Projected returns pro-forma
-3.0% appreciation · 5.69% rent growth · sell at horizon
- IRR
- 63.9%
- Equity multiple
- 3.97×
- Total profit
- $74,856
- Equity at exit
- $13,419
- IRR
- 69.1%
- Equity multiple
- 8.93×
- Total profit
- $199,897
- Equity at exit
- $7,782
Cash invested: $25,200 (down + closing). Projections, not guarantees.
Landlord ↔ Tenant lean methodology
- Overall (STATE)
- 18 Strongly Tenant-Friendly
- State California
- 18 Strongly Tenant-Friendly · D+13
- County
- — inherits STATE
- City
- — inherits STATE
ZIP-level market 95660
- Rents YoY
- 5.7%
- Active inventory
- 108
- Price-to-rent
- 3.2×
Monthly cashflow live
- Estimated rent
- $2,315 high interval (Pro) →
- Mortgage (P&I)
- −$472
- Tax from tax record
- −$16 /mo · $187/yr
- Insurance
- −$38
- HOA
- −$0
- Vacancy / Maint / Mgmt
- −$486
- Net cashflow
- $1,304
Break-even live
UW: 25.0% down · 7.5% · 30yr · 1.5% tax · 5.0% vac · 8.0% maint · 8.0% mgmt
Financing live
Cash to close
- Down payment
- $22,500
- Closing costs
- $2,700
- Reserves months
- —
- Total cash needed
- —
Loan-product check · same deal, 3 products live
Conventional
25% down · 7.5% · 30yr
- Down + closing
- —
- Monthly P&I
- —
- Monthly cashflow
- —
- DSCR
- —
- Eligible?
- —
Personal DTI + credit; lowest rate.
DSCR
20% down · 8.5% · 30yr
- Down + closing
- —
- Monthly P&I
- —
- Monthly cashflow
- —
- DSCR
- —
- Eligible?
- —
No personal income docs; deal must DSCR.
Hard money
10% down · 12.0% · 12mo
- Down + closing
- —
- Monthly P&I
- —
- Monthly cashflow
- —
- DSCR
- —
- Eligible?
- —
Short-term bridge; refi at stabilization.
Rent comps 12 comps
| Address | Beds | Baths | Sqft | Rent | $/sqft | DOM | Units | Dist |
|---|---|---|---|---|---|---|---|---|
| 4930 Polk St North Highlands, CA | 2.0–3.0 | 1.0–2.0 | 938 | $1,795 | $1.91 | 1d | 3 | 0.43mi |
| 5516 Palmdale Way Sacramento, CA | 3.0 | 2.0 | 1115 | $2,250 | $2.02 | 20d | 1 | 0.63mi |
| 5001 Date Ave Sacramento, CA | 3.0 | 2.0 | 1106 | $2,400 | $2.17 | 1d | 1 | 0.96mi |
| 5728 Luce Ave McClellan Park, CA | 2.0–3.0 | 1.0 | 1058 | $2,190 | $2.07 | 1d | 3 | 1.10mi |
| 4716 Tulane Ct Sacramento, CA | 3.0 | 2.0 | 1303 | $2,450 | $1.88 | 23d | 1 | 1.19mi |
| 4815 Mary Kate Dr Sacramento, CA | 2.0 | 2.0 | 1100 | $1,850 | $1.68 | 43d | 1 | 1.21mi |
| 4821 Mary Kate Dr Unit 4823 Sacramento, CA | 2.0 | 2.0 | 1050 | $1,675 | $1.60 | 1d | 1 | 1.23mi |
| 4255 Winding Way Sacramento, CA | 2.0 | 1.5 | 1300 | $1,995 | $1.53 | 7d | 1 | 1.33mi |
| 6209 Claussen Way North Highlands, CA | 4.0 | 2.0 | 1600 | $2,550 | $1.59 | 14d | 1 | 1.34mi |
| 4901 Little Oak Ln Sacramento, CA | 1.0–3.0 | 1.0–2.0 | 915 | $1,832 | $2.00 | 1d | 7 | 1.38mi |
| 5720 Brett Dr Sacramento, CA | 4.0 | 2.0 | 1567 | $2,650 | $1.69 | 20d | 1 | 1.42mi |
| 4437 Rutgers Way Sacramento, CA | 3.0 | 2.5 | 2113 | $2,995 | $1.42 | 43d | 1 | 1.48mi |
Listing history 10 events
-
2026-06-18days on market $90,000 Active 14 DOM
-
2026-06-17days on market $90,000 Active 13 DOM
-
2026-06-16days on market $90,000 Active 12 DOM
-
2026-06-15days on market $90,000 Active 11 DOM
-
2026-06-13days on market $90,000 Active 9 DOM
-
2026-06-13days on market $90,000 Active 8 DOM
-
2026-06-09days on market $90,000 Active 5 DOM
-
2026-06-08days on market $90,000 Active 4 DOM
-
2026-06-07remarks 699-char remark
-
2026-06-07$90,000 Active 3 DOM
ⓘ Source: listings_history table (triggers on properties + properties_extension) + one-shot
backfill from property_details.listing_events for pre-trigger history.
Tax reassessment forecast CA · Resets to sale price
- Current annual tax
- $187 · $16/mo
- Projected year-2 tax
- $684 · $57/mo
- Expected delta
- +$497/yr (+$41/mo · 265.8%)
ⓘ Screening estimate from a state-policy table — verify with the county assessor before closing.
Climate risk First Street
- Flood 1/10 Low FEMA zone X (unshaded) · 0% chance over 30 yrs
- Wildfire 1/10 Low
- Heat 7/10 Severe 7 d/yr ≥102°F today · 14 d/yr by 30 yrs out
- Wind 1/10 Low
- Air quality 10/10 Extreme 34 unhealthy d/yr today · 38 by 30 yrs out
Nearby sold comps map
Loading sold comps map…
Walkable amenities ~0.75 mi
Loading nearby amenities…
Taxation est. · year 1
- Rental income
- $27,778
- − Mortgage interest
- −$5,041
- − Property taxes
- −$187
- − Insurance
- −$450
- − Repairs & maintenance
- −$2,222
- − Management
- −$2,222
- − Depreciation
- −$2,618
- Taxable income
- $15,037
- Est. tax owed @ 24.0%
- −$3,609
- After-tax cash flow
- $12,035/yr
For passive investors: Depreciation is non-cash, so a rental often shows a tax loss while cash-flowing — sheltering income. Rental losses are passive: they offset passive income freely, and up to $25,000/yr can offset ordinary (W-2) income if you actively participate and your MAGI is under $100k (phasing out to $0 by $150k); unused losses carry forward. On sale, claimed depreciation is recaptured at up to 25%, and gains may owe capital-gains tax (a 1031 exchange can defer both). Figures are a year-1 estimate at your 24.0% rate — not tax advice; consult a CPA.
Schools (NCES district)
- District
- Twin Rivers Unified
- NCES district ID
- 0601332
- Math proficiency
- 29% ▲ 2.00%
- Reading proficiency
- 37% ▲ 2.00%
- Median HH income
- $42,481
- Composite
- 30.67/100
- National rank
- #11437
- State rank
- #970 of 1400 in CA
Livability — North Highlands
- Score
- 61/100
- State rank
- #523
- US rank
- #17613
Category grades
Schools grade is shown separately in the Schools card above.
Census & demographics
- Census place
- North Highlands, CA
- County
- Sacramento County · 1,539,646 people
- City population
- 56,900
- Metro
- Sacramento-Roseville-Folsom, CA
- Population (ZIP)
- 35,451
- Household income
- $68,235
- Rent vs Own
- Severe rent burden
- 1300.0
Population outlook (Sacramento County) Hauer SSP2
- Today (2025)
- 1,660,763 people
- By 2030
- 1,732,990 · +4.3%
- By 2040
- 1,855,755 · +11.7%
- By 2050
- 1,941,335 · +16.9%
- By 2075
- 2,046,162 · +23.2%
- By 2100
- 1,961,444 · +18.1%
Race, ethnicity, and origin ACS 2023
- Neighborhood character
- Diverse neighborhood (Simpson 0.69)
- Race & ethnicity
- White 41% Hispanic / Latino 37% Two or more races 16% Black 9% Asian 7%
- Hispanic origin (detail)
- Mexican 29%
- Common ancestry
- Subsaharan African 5% Scotch-Irish 2% Scandinavian 2%
- Foreign-born
- 28% · Canada, Vietnam
- Languages at home
- 56% English-only · Spanish 25% Russian/Polish/Slavic 9% Other Indo-European 5%
Political lean MEDSL · Sacramento
- 2024 margin
- D (+19.7) · D 58.1% · R 38.4% · Other 3.5%
- 2008→2024 swing
- +0.7pp no change · 2008: 19.0pp · 2024: 19.7pp
- All cycles
- 2024: D+19.7 2020: D+25.3 2016: D+23.7 2012: D+16.3 2008: D+19.0
Not yet ingested
- Civics
- —
Market trends
- HPI YoY
- ▼ -273.83%
- Current HPI
- 438.1022
- Rent YoY
- ▲ 5.69%
- Metro
- Sacramento-Roseville-Folsom, CA
- State GDP YoY
- ▲ 3.21%
- F500 in state
- 116
Industry mix (Fortune 500 HQ in CA)
| Industry | F500 HQs | Revenue |
|---|---|---|
| Technology | 27 | $1,492B |
|
||
| Financial Services | 3 | $174B |
|
||
| Retail | 3 | $44B |
|
||
| Insurance | 3 | $26B |
|
||
| Media / Entertainment | 2 | $115B |
|
||
| Pharmaceuticals / Biotech | 2 | $62B |
|
||
Property tax history
+0.3%/yrLatest (2025): $187 · +1.1% YoY. Source: county tax records.
Cash-flow waterfall
monthlySold comps — $/sqft
last 12 mo · ≤1 miLoading sold comps…