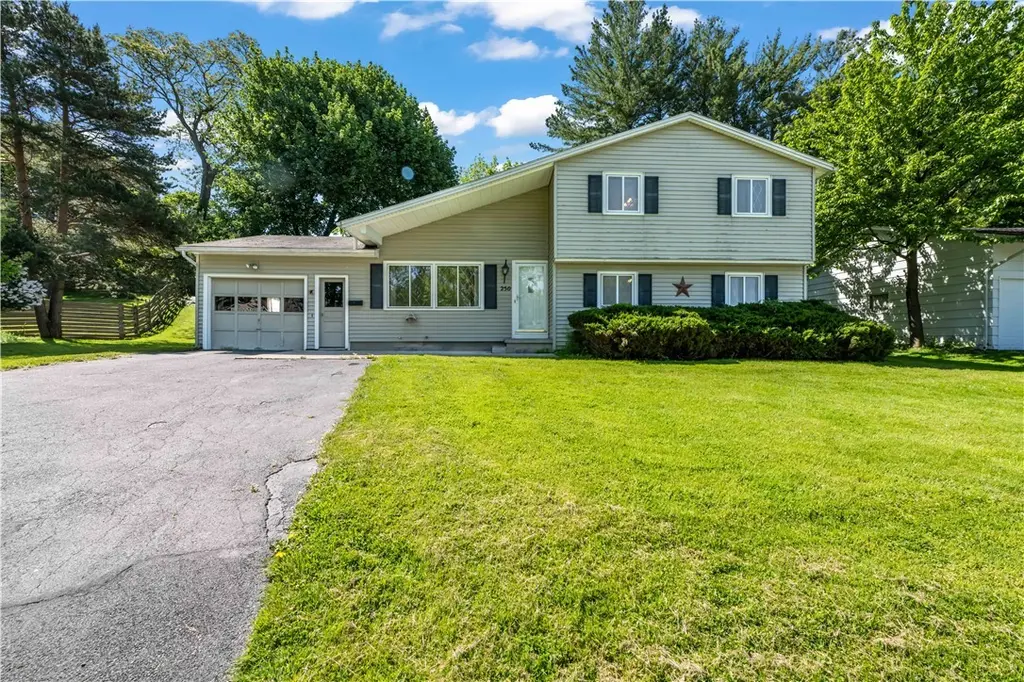
250 Lake Shore Boulevard Ext · Irondequoit, NY
Flood risk 1/10 · Minimal
- FEMA flood zone
- X (unshaded)
- Chance of flooding over 30 yrs
- 0.0%
- Est. flood insurance / yr
- $473 – $860
Fire risk 1/10 · Minimal
- Est. fire insurance / yr
- $691 – $1,283
Heat risk 2/10 · Minimal
- Hot days now (above 95°F)
- 7 days/yr
- Hot days in 30 yrs
- 16 days/yr
Wind risk 1/10 · Minimal
- Chance of severe wind over 30 yrs
- —
Air-quality risk 2/10 · Minimal
- Unhealthy air days now
- 1 days/yr
- Unhealthy air days in 30 yrs
- 2 days/yr
Risk factors via First Street. Map © Google.
Why this score? — see what drove the B+ grade
The composite is a weighted blend of 9 inputs, each scored 0–100. Each bar is that input's sub-score; the figure is the points it added to the 100-point composite (weight × sub-score).
- Cash flow +27.5/30.0
- ARV discount +15.0/15.0
- 1% rule +10.0/10.0
- DSCR +9.6/10.0
- Schools +6.2/10.0
- Livability +4.0/5.0
- Rent growth +2.5/5.0
- Condition / age +2.5/5.0
- Appreciation +0.0/10.0
$169,900
🖨 Deal sheet (PDF) 📄 Offer letter ✓ Due diligence
Listing remarks
Opportunity awaits in this spacious 3-bedroom, 1.5-bath split-level home located in the desirable West Irondequoit School District! Hardwood floors flow throughout the home, beginning in the large living room where a huge picture window fills the space with natural light. The oversized eat-in kitchen offers plenty of room for cooking, dining, and gathering along with extra storage. Just a few steps down, you'll find a cozy family room featuring a gas fireplace, convenient half bath, and access to the backyard. Up a few steps from the living room, hardwood floors continue through all 3 bedrooms, along with a full bathroom serving the second level. Additional highlights include a 1-car attach
Key facts
- Large backyard
- Gas fireplace
- Double-wide driveway
Tags
Property features AI
Exterior
- Parking: Attached garage with garage door opener (1 car)
- Utilities: Public water connected; Sewer connected; Electricity connected (circuit breakers); High-speed internet available; Cable available
- Home design: Single-story property; Resale condition; Asphalt roof; Vinyl siding exterior
- Construction: Built as existing structure; Block foundation
- Exterior features: Blacktop driveway; Rectangular residential lot (approximately 0.26 acres, 62 x 130); City street frontage
Interior
- Kitchen: Dishwasher; Electric oven; Electric range; Range hood; Refrigerator; Exhaust fan
- Bedrooms: Total of 6 rooms including living and family spaces
- Flooring: Carpet; Hardwood; Tile; Vinyl; Varied flooring
- Bathrooms: 1 full bathroom; 1 half bathroom; 1 main-level bathroom
- Heating & cooling: Gas forced-air heating
- Interior features: Ceiling fan(s); Eat-in kitchen; Separate/formal living room; Full finished basement
- Laundry & utility: Laundry in basement; Gas water heater
Neighborhood map
What this means for you Summary
Snapshot
- This is a 3-bed/1.5-bath single-family listed at $170k.
Deal economics
- At list price, monthly cash flow is $503 ($6k/yr) — positive.
- The deal already cash-flows at list — no discount required.
- Meets the 1% rule at list price ($3k rent vs $170k).
- Cap rate 9.8% vs local median 4.5% in Irondequoit — top-decile yield for the area; either an underpriced asset or a hidden risk that comps aren't pricing in. Stress-test before assuming the spread holds.
Location & tenants
- Location reads 81/100 on livability (#92 in NY, #1,414 nationally) — a professional / high-income tenant draw. Strengths: housing A+, health & safety A+, crime B+; Watch: amenities F.
- West Irondequoit Central School District (suburban): math 73% / reading 70% proficiency, ranked #126 of 590 in NY (top 21%) — strong family-tenant draw, lease renewals of 3-5y typical; only 18% free/reduced lunch — higher-income household profile.
- Market conditions: 102 active listings in the ZIP; 3 comparable units currently listed for rent nearby; rentals at typical pace (median 15d on market — plan ~3-4 weeks tenant-placement turnaround); solid renter incomes; 1,169 units permitted in Monroe County in 2024 (591 in 5+ unit buildings).
- This rent runs 34% of the median local income ($90k/yr) — at the standard rent-burdened threshold; future hikes will face affordability resistance.
Forward outlook
- Local home prices are declining (-3.0%/yr); year-one equity from $1k of loan paydown is wiped out by about $5k of value loss. Plan a longer hold.
- Monroe County population projected to shrink 6% by 2050 — rents likely to lag national; underwrite the cash flow, not the appreciation.
- At projected returns (-3.0% appreciation + 3.0% rent growth), your $48k cash investment doubles in ~9 years — after that, you're playing with house money.
Negotiation context
- Only 9 days on market — expect competitive offers; lowballing is unlikely to land.
Risks & watch-outs
- Watch-outs: property tax is 4.0% of price.
Questions for the listing agent
- Built in 1967 — when were the roof, HVAC, electrical panel, plumbing, and water heater last replaced?
- Property tax is high relative to price — has the assessment been appealed recently, and will the sale trigger a re-assessment?
- Is there a deadline driving the sale (1031 exchange, divorce, estate, relocation)? That informs how much negotiation room exists.
- Schools are B-rated — typically a magnet for longer-tenancy family renters. What's the average tenant stay here, and is there a school-zone premium baked into asking?
- What's the average days-on-market for RENTAL listings here right now (not sales)? A rising rental-DOM trend means longer vacancies and softer asking-rent achievability than the comps imply.
- What's the recent tenant-quality profile in this submarket — average credit score on applications, eviction rate, late-payment / NSF rate, and stable-employment percentage? A property-management company in the area should have these aggregated.
- How much new for-sale + rental construction is in the pipeline within 1–3 miles? Heavy new supply typically softens prices + rents 12–24 months out; constrained supply supports both.
Investment metrics
- 1% rule
- 1.52% ✓
- Cap rate
- 9.84%
- Cash-on-cash
- 12.68%
- DSCR
- 1.56
- GRM
- 5.5
CMA / ARV
- ARV (on-the-fly)
- $295,089
- Comps found
- 12
Show comp detail 12 sales within ~0.75 mi
| Address | Dist | Beds/Ba | Sqft | Sold | Price | $/sf | Match |
|---|---|---|---|---|---|---|---|
| 230 Lake Shore Boulevard Ext | 0.03mi | 4/1.5 (+1) | 1,732 (-2%) | 9mo | $350,000 | $202 | 83 |
| 36 Oakmount Dr | 0.11mi | 4/1.5 (+1) | 1,721 (-3%) | 10mo | $261,410 | $152 | 77 |
| 579 Lake Shore Blvd | 0.25mi | 3/1.5 | 1,877 (+6%) | 6mo | $230,000 | $123 | 73 |
| 280 Lake Shore Boulevard Ext | 0.05mi | 3/2.5 | 1,561 (-12%) | 9mo | $225,000 | $144 | 67 |
| 47 Glenmont Dr | 0.59mi | 3/1.5 | 1,680 (-5%) | 10mo | $279,900 | $167 | 56 |
| 63 Shorewood Dr | 0.53mi | 3/1.0 | 1,556 (-12%) | 0mo | $210,000 | $135 | 53 |
| 4646 Saint Paul Blvd | 0.31mi | 3/1.0 | 1,501 (-15%) | 9mo | $202,000 | $135 | 51 |
| 549 Turtle Rock Ln | 0.60mi | 3/1.5 | 1,506 (-15%) | 0mo | $653,000 | $434 | 47 |
| 89 Pinecrest Dr | 0.69mi | 3/1.5 | 1,625 (-8%) | 9mo | $325,000 | $200 | 46 |
| 251 Beaconview Ct | 0.65mi | 3/2.5 | 1,984 (+12%) | 0mo | $337,250 | $170 | 45 |
| 267 Mount Airy Dr | 0.52mi | 4/2.5 (+1) | 1,926 (+9%) | 10mo | $425,000 | $221 | 44 |
| 130 Quay Dr | 0.36mi | 4/2.5 (+1) | 1,512 (-14%) | 10mo | $245,000 | $162 | 42 |
Match score weights: distance 35% · size 25% · config 20% · recency 20%. Top-matched comps best support the ARV.
Projected returns pro-forma
-3.0% appreciation · 3.0% rent growth · sell at horizon
- IRR
- 2.6%
- Equity multiple
- 1.10×
- Total profit
- $4,744
- Equity at exit
- $25,333
- IRR
- 12.3%
- Equity multiple
- 1.98×
- Total profit
- $46,408
- Equity at exit
- $14,690
Cash invested: $47,572 (down + closing). Projections, not guarantees.
Landlord ↔ Tenant lean methodology
- Overall (STATE)
- 15 Strongly Tenant-Friendly
- State New York
- 15 Strongly Tenant-Friendly · D+10
- County
- — inherits STATE
- City
- — inherits STATE
ZIP-level market 14617
- Active inventory
- 102
- Price-to-rent
- 5.5×
Monthly cashflow live
- Estimated rent
- $2,575 medium interval (Pro) →
- Mortgage (P&I)
- −$891
- Tax from tax record
- −$570 /mo · $6,836/yr
- Insurance
- −$71
- HOA
- −$0
- Vacancy / Maint / Mgmt
- −$541
- Net cashflow
- $503
Break-even live
Sensitivity live
| Price | -10% $599 | -5% $551 | +0% $503 | +5% $455 | +10% $407 |
|---|---|---|---|---|---|
| Rent | -10% $299 | -5% $401 | +0% $503 | +5% $604 | +10% $706 |
| Rate | -1.0pp $588 | -0.5pp $546 | base $503 | +0.5pp $459 | +1.0pp $414 |
UW: 25.0% down · 7.5% · 30yr · 1.5% tax · 5.0% vac · 8.0% maint · 8.0% mgmt
Financing live
Cash to close
- Down payment
- $42,475
- Closing costs
- $5,097
- Reserves months
- —
- Total cash needed
- —
Loan-product check · same deal, 3 products live
Conventional
25% down · 7.5% · 30yr
- Down + closing
- —
- Monthly P&I
- —
- Monthly cashflow
- —
- DSCR
- —
- Eligible?
- —
Personal DTI + credit; lowest rate.
DSCR
20% down · 8.5% · 30yr
- Down + closing
- —
- Monthly P&I
- —
- Monthly cashflow
- —
- DSCR
- —
- Eligible?
- —
No personal income docs; deal must DSCR.
Hard money
10% down · 12.0% · 12mo
- Down + closing
- —
- Monthly P&I
- —
- Monthly cashflow
- —
- DSCR
- —
- Eligible?
- —
Short-term bridge; refi at stabilization.
Rent comps 3 comps
| Address | Beds | Baths | Sqft | Rent | $/sqft | DOM | Units | Dist |
|---|---|---|---|---|---|---|---|---|
| 37 Oakmount Dr Rochester, NY | 4.0 | 2.0 | 1368 | $2,500 | $1.83 | 15d | 1 | 0.12mi |
| 4302 Lake Ave Unit 1 Rochester, NY | 3.0 | 1.5 | 1600 | $3,000 | $1.88 | 44d | 1 | 0.73mi |
| 485 Oakridge Dr Rochester, NY | 3.0 | 1.5 | 1826 | $4,000 | $2.19 | 3d | 1 | 0.95mi |
Listing history 10 events
-
2026-06-19status $169,900 Pending 9 DOM
-
2026-06-18days on market $169,900 Active Under Contract 9 DOM
-
2026-06-18status $169,900 Active Under Contract 8 DOM
-
2026-06-17days on market $169,900 Active 8 DOM
-
2026-06-16days on market $169,900 Active 7 DOM
-
2026-06-15days on market $169,900 Active 6 DOM
-
2026-06-13days on market $169,900 Active 4 DOM
-
2026-06-13days on market $169,900 Active 3 DOM
-
2026-06-10remarks 699-char remark
-
2026-06-10$169,900 Active 1 DOM
ⓘ Source: listings_history table (triggers on properties + properties_extension) + one-shot
backfill from property_details.listing_events for pre-trigger history.
Tax reassessment forecast NY · Partial reset (capped growth)
- Current annual tax
- $6,836 · $570/mo
- Projected year-2 tax
- $6,836 · $570/mo
- Expected delta
- $0/yr ($0/mo · 0.0%)
ⓘ Screening estimate from a state-policy table — verify with the county assessor before closing.
Climate risk First Street
- Flood 1/10 Low FEMA zone X (unshaded) · 0% chance over 30 yrs
- Wildfire 1/10 Low
- Heat 2/10 Low 7 d/yr ≥95°F today · 16 d/yr by 30 yrs out
- Wind 1/10 Low
- Air quality 2/10 Low 1 unhealthy d/yr today · 2 by 30 yrs out
Nearby sold comps map
Loading sold comps map…
Walkable amenities ~0.75 mi
Loading nearby amenities…
Taxation est. · year 1
- Rental income
- $30,898
- − Mortgage interest
- −$9,517
- − Property taxes
- −$6,836
- − Insurance
- −$850
- − Repairs & maintenance
- −$2,472
- − Management
- −$2,472
- − Depreciation
- −$4,943
- Taxable income
- $3,809
- Est. tax owed @ 24.0%
- −$914
- After-tax cash flow
- $5,118/yr
For passive investors: Depreciation is non-cash, so a rental often shows a tax loss while cash-flowing — sheltering income. Rental losses are passive: they offset passive income freely, and up to $25,000/yr can offset ordinary (W-2) income if you actively participate and your MAGI is under $100k (phasing out to $0 by $150k); unused losses carry forward. On sale, claimed depreciation is recaptured at up to 25%, and gains may owe capital-gains tax (a 1031 exchange can defer both). Figures are a year-1 estimate at your 24.0% rate — not tax advice; consult a CPA.
Schools (NCES district)
- District
- West Irondequoit Central School District
- NCES district ID
- 3615390
- Math proficiency
- 73% ▲ 3.00%
- Reading proficiency
- 70% ▲ 5.00%
- Median HH income
- $60,218
- Composite
- 61.61/100
- National rank
- #748
- State rank
- #126 of 590 in NY
Livability — Irondequoit
- Score
- 81/100
- State rank
- #92
- US rank
- #1414
Category grades
Schools grade is shown separately in the Schools card above.
Census & demographics
- Census place
- Irondequoit, NY
- County
- Monroe County · 674,131 people
- City population
- 74,252
- Metro
- Rochester, NY
- Population (ZIP)
- 21,788
- Household income
- $90,192
- Rent vs Own
- Severe rent burden
- 426.0
Population outlook (Monroe County) Hauer SSP2
- Today (2025)
- 759,460 people
- By 2030
- 757,154 · -0.3%
- By 2040
- 740,644 · -2.5%
- By 2050
- 714,443 · -5.9%
- By 2075
- 645,883 · -15.0%
- By 2100
- 547,084 · -28.0%
Race, ethnicity, and origin ACS 2023
- Neighborhood character
- Predominantly White (85%)
- Race & ethnicity
- White 85% Hispanic / Latino 8% Two or more races 6% Black 4%
- Hispanic origin (detail)
- Puerto Rican 4%
- Common ancestry
- Romanian 6% Iranian 3% Lithuanian 3%
- Foreign-born
- 4% · Canada
- Languages at home
- 93% English-only · Spanish 4% Other Indo-European 1% Russian/Polish/Slavic 1%
Political lean MEDSL · Monroe
- 2024 margin
- D (+19.1) · D 59.5% · R 40.5%
- 2008→2024 swing
- +1.4pp toward D · 2008: 17.7pp · 2024: 19.1pp
- All cycles
- 2024: D+19.1 2020: D+21.0 2016: D+14.1 2012: D+17.4 2008: D+17.7
Not yet ingested
- Civics
- —
Market trends
- HPI YoY
- ▼ -148.22%
- Current HPI
- 263.9973
- Rent YoY
- —
- Metro
- Rochester, NY
- State GDP YoY
- ▲ 2.60%
- F500 in state
- 92
Industry mix (Fortune 500 HQ in NY)
| Industry | F500 HQs | Revenue |
|---|---|---|
| Financial Services | 10 | $950B |
|
||
| Consumer Goods | 9 | $162B |
|
||
| Insurance | 4 | $225B |
|
||
| Telecommunications | 2 | $144B |
|
||
| Pharmaceuticals | 2 | $112B |
|
||
| Media / Entertainment | 2 | $69B |
|
||
Price history
1 event — show timeline
- 2026-06-09 Listed $169,900 UNYREIS
Property tax history
+8.6%/yrLatest (2025): $6,836 · +43.8% YoY. Source: county tax records.
Cash-flow waterfall
monthlySold comps — $/sqft
last 12 mo · ≤1 miLoading sold comps…