 Triplex
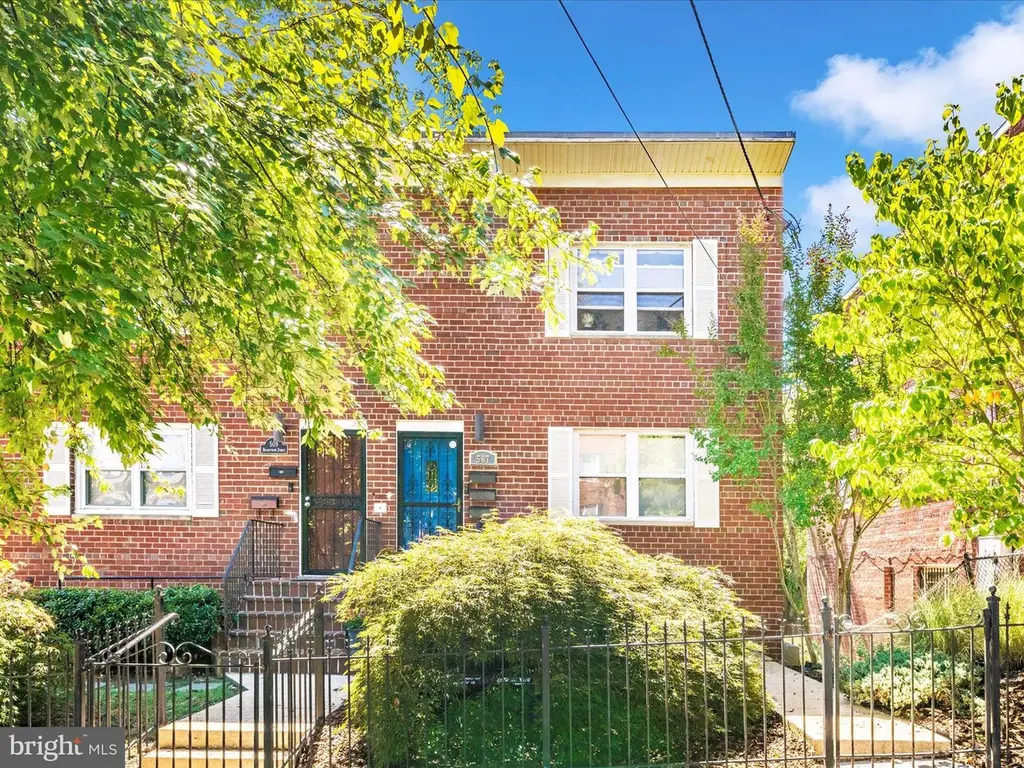
507 Brandywine St SE · Washington, DC
Flood risk 1/10 · Minimal
- FEMA flood zone
- X (unshaded)
- Chance of flooding over 30 yrs
- 0.0%
- Est. flood insurance / yr
- $507 – $1,088
Fire risk 3/10 · Minor
- Est. fire insurance / yr
- $631 – $1,173
Heat risk 8/10 · Major
- Hot days now (above 104°F)
- 7 days/yr
- Hot days in 30 yrs
- 16 days/yr
Wind risk 4/10 · Minor
- Chance of severe wind over 30 yrs
- 17.0%
Air-quality risk 3/10 · Minor
- Unhealthy air days now
- 2 days/yr
- Unhealthy air days in 30 yrs
- 3 days/yr
Risk factors via First Street. Map © Google.
Why this score? — see what drove the C- grade
The composite is a weighted blend of 9 inputs, each scored 0–100. Each bar is that input's sub-score; the figure is the points it added to the 100-point composite (weight × sub-score).
- Cash flow +21.8/30.0
- ARV discount +7.5/15.0
- DSCR +7.0/10.0
- 1% rule +4.8/10.0
- Livability +3.7/5.0
- Schools +3.6/10.0
- Rent growth +3.5/5.0
- Condition / age +2.5/5.0
- Appreciation +0.0/10.0
$425,000
🖨 Deal sheet 📄 Offer letter ✓ Due diligence
Multi-family units
County records classify this as Multi-Family (2-4 Unit). Listing-text estimate: 3 units. confirmed
Listing remarks
3‑unit multifamily offering consistent 1BR/1BA layouts. The property features a fenced rear yard, a private rear carport, and an installed surveillance system for added security. Two units are currently Vacant; one unit is owner-occupied. Ready for an owner‑occupant or investor. Interior finishes are functional, with some cosmetic updates that may further enhance rental appeal. Located in a rapidly developing Ward 8 corridor with convenient access to Metro, major commuter routes, and neighborhood amenities. This triplex provides a solid foundation for long‑term & or STR rental strategies, including traditional leasing or program‑friendly operations. All information reflects current co
Key facts
- 2,613 sq ft lot
- Built 1951
- Listed 19 days
Property features AI
Finance
- Financial info: Multi-unit property with 3 total units (three one-bedroom units)
Exterior
- Parking: Concrete driveway; On-street parking; Parking lot
- Utilities: Public water; Public sewer; Electric available; Natural gas available (hot water & heating); Cable TV available; Phone available
- Home design: Brick construction; 3 total levels/stories; Fee simple ownership; Estimated year built with effective remodel in 2004; Slate roof; Concrete perimeter foundation; Above- and below-grade structures
- Construction: Brick exterior; Slate roof; Concrete perimeter foundation; Major renovation around 2004
- Exterior features: Sidewalks; Deck(s)
Interior
- Kitchen: Refrigerator; Microwave; Electric oven/range; Stove; Stainless steel appliances; Exhaust fan
- Bedrooms: Entry-level bedroom; Three one-bedroom units (multi-unit property)
- Flooring: Carpet; Ceramic tile; Luxury vinyl plank; Wood floors
- Bathrooms: Master bath(s)
- Heating & cooling: Forced air heating; Natural gas heating fuel; Central air conditioning (electric)
- Interior features: Open floor plan; Combination dining and living area; Dining area; Family room off kitchen; Galley kitchen layout; Master bathroom; Recessed lighting; Ceiling fans; Upgraded countertops; Drywall walls and ceilings; Wood and carpet flooring
- Laundry & utility: Water heater
Neighborhood map
What this means for you Summary
Snapshot
- This is a 3 × 1.0-bed/1.0-bath units multifamily listed at $425k.
Deal economics
- At list price, monthly cash flow is $661 ($8k/yr) — positive. Per door: $220/mo.
- The deal already cash-flows at list — no discount required.
- To meet the 1% rule (rent ≥ 1% of price), the offer needs to be $415k (2.4% below list).
- Recommended offer: $415k (2.4% below list) — sets the bar for 1% rule.
- Cap rate 8.2% vs local median 2.5% in Washington — top-decile yield for the area; either an underpriced asset or a hidden risk that comps aren't pricing in. Stress-test before assuming the spread holds.
Location & tenants
- Location reads 73/100 on livability (#1 in DC) — a middle-class / working-renter tenant base. Strengths: amenities A+, commute A+, employment A+; Watch: crime F, cost of living F.
- District Of Columbia Public Schools (urban): math 33% / reading 40% proficiency, ranked #8 of 32 in DC (top 25%) — families likely to look elsewhere, expect single-tenant / working-renter base with shorter leases; 65% free/reduced lunch — lower-income household profile, screen leases tightly.
- Zoned schools: Ballou Hs (657 students, 0% FRL) — zoned schools average 0% FRL vs 65% district-wide (65 pts lower); this property's tenant base skews higher-income than the district average.
- Market conditions: Rents rising (+4.0%/yr); 145 active listings in the ZIP; 29 comparable units currently listed for rent nearby; rentals at typical pace (median 24d on market — plan ~3-4 weeks tenant-placement turnaround); 1,737 units permitted in District of Columbia in 2024 (1,506 in 5+ unit buildings).
- At $4,149/mo this rent would consume 101% of the median local household income ($49k/yr) (locally 4530% of renters already pay >50% of income on rent) — very limited rent-growth headroom before tenants either downsize or default.
Forward outlook
- Local home prices are declining (-3.0%/yr); year-one equity from $3k of loan paydown is wiped out by about $13k of value loss. Plan a longer hold.
- District of Columbia County population projected at +50% by 2050 — long-run rental-demand tailwind backs the buy-and-hold thesis.
Negotiation context
- It's been on market 20 days — a 2% lower offer ($419k) is reasonable based on typical stale-listing flexibility.
- 6 sale attempts since 22y ago; this cycle's ask has dropped $44k (9%) from the opening price — seller is motivated, your offer sets the floor, not the list.
- Current owner paid $255k; list at $425k implies a 67% gain — meaningful room to come down on a strong offer.
Risks & watch-outs
- Watch-outs: built in 1951 — expect roof / HVAC / electrical / plumbing capex.
- Climate carrying-cost: extreme-heat days projected 7→16/yr by 2055 (HVAC capex compounding) — expect insurance premiums to compound above CPI over the hold.
Questions for the listing agent
- Can we see the unit-by-unit rent roll, current vacancy, and any below-market leases? What's the average tenancy length?
- What capital expenditures (roof, boiler, parking lot, exteriors) have been made in the last 5 years, and what's planned in the next 2?
- Built in 1951 — when were the roof, HVAC, electrical panel, plumbing, and water heater last replaced?
- Is there a deadline driving the sale (1031 exchange, divorce, estate, relocation)? That informs how much negotiation room exists.
- Crime grade is F in this area — have there been break-ins, vandalism, or insurance claims at this property in the last 3 years? What carrier currently insures it and at what premium?
- What's the average days-on-market for RENTAL listings here right now (not sales)? A rising rental-DOM trend means longer vacancies and softer asking-rent achievability than the comps imply.
- What's the recent tenant-quality profile in this submarket — average credit score on applications, eviction rate, late-payment / NSF rate, and stable-employment percentage? A property-management company in the area should have these aggregated.
- How much new apartment / multifamily construction is in the pipeline within 1–3 miles? Heavy new supply (>2% of stock underway) typically softens rents 12–24 months out; light construction supports rent growth.
Investment metrics
- 1% rule
- 0.98% ✗
- Cap rate
- 8.16%
- Cash-on-cash
- 6.67%
- DSCR
- 1.30
- GRM
- 8.5
CMA / ARV
No comps found within radius.
Projected returns pro-forma
-3.0% appreciation · 3.96% rent growth · sell at horizon
- IRR
- -5.1%
- Equity multiple
- 0.81×
- Total profit
- $-22,860
- Equity at exit
- $63,369
- IRR
- 5.5%
- Equity multiple
- 1.43×
- Total profit
- $50,684
- Equity at exit
- $36,746
Cash invested: $119,000 (down + closing). Projections, not guarantees.
Landlord ↔ Tenant lean methodology
- Overall (CITY)
- 0 Strongly Tenant-Friendly
- State District of Columbia
- 12 Strongly Tenant-Friendly · D+43
- County
- — inherits STATE
- City Washington
- 0 Strongly Tenant-Friendly · D+43
ZIP-level market 20032
- Home prices YoY
- -15.6%
- Rents YoY
- 4.0%
- Active inventory
- 145
- Price-to-rent
- 25.6×
Monthly cashflow live
- Estimated rent
- $4,149 high interval (Pro) →
- Mortgage (P&I)
- −$2,229
- Tax from tax record
- −$211 /mo · $2,531/yr
- Insurance
- −$177
- HOA
- −$0
- Vacancy / Maint / Mgmt
- −$871
- Net cashflow
- $661
Break-even live
3-unit breakdown (identical units grouped — click to expand)
| Units | Beds | Baths | Est. rent |
|---|---|---|---|
| 3× units | 1.0 | 1 | $4,149 |
| #1 | 1.0 | 1 | $1,383 |
| #2 | 1.0 | 1 | $1,383 |
| #3 | 1.0 | 1 | $1,383 |
| Total (3 units) | $4,149 | ||
UW: 25.0% down · 7.5% · 30yr · 1.5% tax · 5.0% vac · 8.0% maint · 8.0% mgmt
Financing live
Cash to close
- Down payment
- $106,250
- Closing costs
- $12,750
- Reserves months
- —
- Total cash needed
- —
Loan-product check · same deal, 3 products live
Conventional
25% down · 7.5% · 30yr
- Down + closing
- —
- Monthly P&I
- —
- Monthly cashflow
- —
- DSCR
- —
- Eligible?
- —
Personal DTI + credit; lowest rate.
DSCR
20% down · 8.5% · 30yr
- Down + closing
- —
- Monthly P&I
- —
- Monthly cashflow
- —
- DSCR
- —
- Eligible?
- —
No personal income docs; deal must DSCR.
Hard money
10% down · 12.0% · 12mo
- Down + closing
- —
- Monthly P&I
- —
- Monthly cashflow
- —
- DSCR
- —
- Eligible?
- —
Short-term bridge; refi at stabilization.
Rent comps 29 comps
| Address | Beds | Baths | Sqft | Rent | $/sqft | DOM | Units | Dist |
|---|---|---|---|---|---|---|---|---|
| 4805 Springmaid Ln Oxon Hill, MD | 3.0 | 2.5 | 1296 | $2,600 | $2.01 | 18d | 1 | 0.37mi |
| 147 Mississippi Ave SE Washington, DC | 4.0 | 2.0 | 1459 | $2,795 | $1.92 | 21d | 1 | 0.39mi |
| 864 Bellevue St SE Unit 1 Washington, DC | 2.0 | 1.0 | 1628 | $1,700 | $1.04 | 24d | 1 | 0.43mi |
| 866 Bellevue St SE Unit 1 Washington, DC | 2.0 | 1.0 | 2533 | $1,600 | $0.63 | 24d | 1 | 0.43mi |
| 4306 Halley Ter SE Unit 1 Washington, DC | 4.0 | 2.0 | 1270 | $3,000 | $2.36 | 10d | 1 | 0.44mi |
| 4329 Halley Ter SE Unit 4 Washington, DC | 2.0 | 1.0 | 2556 | $1,350 | $0.53 | 21d | 1 | 0.48mi |
| 4281 S Capitol St SW Washington, DC | 3.0 | 3.5 | 1412 | $2,900 | $2.05 | 24d | 1 | 0.51mi |
| 4287 S Capitol St SW Washington, DC | 2.0 | 3.5 | 1412 | $2,575 | $1.82 | 24d | 1 | 0.51mi |
| 911 Bellevue St SE Washington, DC | 4.0 | 2.0 | 1820 | $3,400 | $1.87 | 24d | 1 | 0.56mi |
| 716 Audrey Ln Oxon Hill, MD | 3.0 | 2.0 | 1344 | $2,500 | $1.86 | 18d | 1 | 0.61mi |
| 150 Upsal St SE Washington, DC | 2.0 | 3.0 | 1695 | $3,200 | $1.89 | 24d | 1 | 0.61mi |
| 4005 Blakney Ln SE Washington, DC | 3.0 | 2.5 | 2024 | $3,000 | $1.48 | 17d | 1 | 0.62mi |
| 118 Galveston St SW Washington, DC | 1.0–3.0 | 1.0–2.0 | 951 | $2,130 | $2.24 | 2d | 10 | 0.72mi |
| 1121 Varney St SE Washington, DC | 3.0 | 3.5 | 1400 | $3,000 | $2.14 | 24d | 1 | 0.72mi |
| 1306 Sutler Ter Oxon Hill, MD | 4.0 | 2.5 | 1320 | $3,079 | $2.33 | 2d | 1 | 0.73mi |
| 742 Congress St SE Washington, DC | 3.0 | 2.5 | 1744 | $3,000 | $1.72 | 16d | 1 | 0.73mi |
| 5102 Glassmanor Dr Oxon Hill, MD | 3.0 | 2.5 | 2304 | $2,500 | $1.09 | 43d | 1 | 0.75mi |
| 4334 Martin Luther King Jr Ave SW Washington, DC | 3.0 | 2.0 | 1323 | $3,200 | $2.42 | 24d | 1 | 0.76mi |
| 4935 Wall Flower Way Oxon Hill, MD | 3.0 | 3.0 | 1320 | $2,750 | $2.08 | 20d | 1 | 0.81mi |
| 1636 Deep Gorge Ct Oxon Hill, MD | 3.0 | 3.5 | 1332 | $2,750 | $2.06 | 43d | 1 | 0.93mi |
| 5400 Livingston Ter Oxon Hill, MD | 1.0–3.0 | 1.0–1.5 | 1053 | $1,890 | $1.79 | 1d | 5 | 0.99mi |
| 349 Parkland Pl SE Unit B Washington, DC | 4.0 | 2.0 | 1400 | $2,500 | $1.79 | 20d | 1 | 1.00mi |
| 349 Parkland Pl SE Unit A Washington, DC | 4.0 | 2.0 | 1400 | $2,500 | $1.79 | 24d | 1 | 1.00mi |
| 357 Parkland Pl SE Washington, DC | 4.0 | 2.0 | 2400 | $2,300 | $0.96 | 24d | 1 | 1.00mi |
| 357 Parkland Pl SE Unit 1 Washington, DC | 4.0 | 2.0 | 2400 | $2,200 | $0.92 | 24d | 1 | 1.00mi |
| 224 Malcolm X Ave SE Washington, DC | 4.0 | 3.5 | 2052 | $3,500 | $1.71 | 24d | 1 | 1.07mi |
| 5507 Sachem Dr Oxon Hill, MD | 4.0 | 3.0 | 1299 | $2,900 | $2.23 | 43d | 1 | 1.11mi |
| 1201 Oak Dr SE Washington, DC | 3.0 | 1.0–2.0 | 853 | $2,220 | $2.60 | 1d | 19 | 1.20mi |
| 3401 15th St SE Unit 2 Washington, DC | 2.0 | 1.0 | 2520 | $1,600 | $0.63 | 24d | 1 | 1.29mi |
Listing history 34 events
-
2026-06-18days on market $425,000 Active 20 DOM
-
2026-06-17days on market $425,000 Active 19 DOM
-
2026-06-16days on market $425,000 Active 18 DOM
-
2026-06-15days on market $425,000 Active 17 DOM
-
2026-06-13days on market $425,000 Active 15 DOM
-
2026-06-09days on market $425,000 Active 11 DOM
-
2026-06-08days on market $425,000 Active 10 DOM
-
2026-06-07days on market $425,000 Active 9 DOM
-
2026-06-04days on market $425,000 Active 6 DOM
-
2026-06-03days on market $425,000 Active 5 DOM
-
2026-06-02days on market $425,000 Active 4 DOM
-
2026-06-01days on market $425,000 Active 3 DOM
-
2026-05-31days on market $425,000 Active 2 DOM
-
2026-05-28historical $425,000
-
2026-04-04historical
-
2026-03-23historical
-
2026-03-23$469,000 Active
-
2026-01-07$499,999 Active
-
2025-12-23historical
-
2025-10-10$549,900 Active
-
2025-10-10historical
-
2025-09-18$575,000 Active
-
2025-09-11historical
-
2023-02-20historical
-
2023-02-11historical Active Under Contract
-
2023-02-01status Active
-
2023-01-06historical
-
2022-12-22historical
-
2005-03-18soldstatus $255,000
-
2005-03-17soldstatus $255,000
-
2005-02-15historical
-
2004-11-03soldstatus $126,000
-
2004-10-31$260,000
-
1976-10-14soldstatus $26,000
ⓘ Source: listings_history table (triggers on properties + properties_extension) + one-shot
backfill from property_details.listing_events for pre-trigger history.
Tax reassessment forecast DC · Partial reset (capped growth)
- Current annual tax
- $2,531 · $211/mo
- Projected year-2 tax
- $2,562 · $213/mo
- Expected delta
- +$31/yr (+$3/mo · 1.2%)
ⓘ Screening estimate from a state-policy table — verify with the county assessor before closing.
Climate risk First Street
- Flood 1/10 Low FEMA zone X (unshaded) · 0% chance over 30 yrs
- Wildfire 3/10 Moderate
- Heat 8/10 Severe 7 d/yr ≥104°F today · 16 d/yr by 30 yrs out
- Wind 4/10 Moderate 17% chance of damaging wind over 30 yrs
- Air quality 3/10 Moderate 2 unhealthy d/yr today · 3 by 30 yrs out
Nearby sold comps map
Loading sold comps map…
Walkable amenities ~0.75 mi
Loading nearby amenities…
Taxation est. · year 1
- Rental income
- $49,788
- − Mortgage interest
- −$23,807
- − Property taxes
- −$2,531
- − Insurance
- −$2,125
- − Repairs & maintenance
- −$3,983
- − Management
- −$3,983
- − Depreciation
- −$12,364
- Taxable income
- $996
- Est. tax owed @ 24.0%
- −$239
- After-tax cash flow
- $7,693/yr
For passive investors: Depreciation is non-cash, so a rental often shows a tax loss while cash-flowing — sheltering income. Rental losses are passive: they offset passive income freely, and up to $25,000/yr can offset ordinary (W-2) income if you actively participate and your MAGI is under $100k (phasing out to $0 by $150k); unused losses carry forward. On sale, claimed depreciation is recaptured at up to 25%, and gains may owe capital-gains tax (a 1031 exchange can defer both). Figures are a year-1 estimate at your 24.0% rate — not tax advice; consult a CPA.
Schools (NCES district)
- District
- District Of Columbia Public Schools
- NCES district ID
- 1100030
- Math proficiency
- 33% ▲ 3.00%
- Reading proficiency
- 40% ▲ 5.00%
- Median HH income
- $67,671
- Composite
- 35.84/100
- National rank
- #9606
- State rank
- #8 of 32 in DC
Livability — Washington
- Score
- 73/100
- State rank
- #1
- US rank
- #5327
Category grades
Schools grade is shown separately in the Schools card above.
Census & demographics
- Census place
- Washington, DC
- County
- District of Columbia · 671,873 people
- City population
- 671,873
- Metro
- Washington-Arlington-Alexandria, DC-VA-MD-WV
- Population (ZIP)
- 40,920
- Household income
- $49,139
- Rent vs Own
- Severe rent burden
- 4530.0
Population outlook (District of Columbia County) Hauer SSP2
- Today (2025)
- 821,926 people
- By 2030
- 899,517 · +9.4%
- By 2040
- 1,061,162 · +29.1%
- By 2050
- 1,231,493 · +49.8%
- By 2075
- 1,603,312 · +95.1%
- By 2100
- 1,847,141 · +124.7%
Race, ethnicity, and origin ACS 2023
- Neighborhood character
- Predominantly Black (80%)
- Race & ethnicity
- Black 80% White 8% Two or more races 7% Hispanic / Latino 5%
- Foreign-born
- 4% · Canada
- Languages at home
- 95% English-only · Spanish 3%
Political lean MEDSL · District of Columbia
- 2024 margin
- Solid D (+86.1) · D 91.2% · R 5.1% · Other 3.8%
- 2008→2024 swing
- +0.1pp no change · 2008: 85.9pp · 2024: 86.1pp
- All cycles
- 2024: D+86.1 2020: D+86.8 2016: D+88.7 2012: D+84.2 2008: D+85.9
Not yet ingested
- Civics
- —
Market trends
- HPI YoY
- ▼ -60.34%
- Current HPI
- 326.4077
- Rent YoY
- ▲ 3.96%
- Metro
- Washington-Arlington-Alexandria, DC-VA-MD-WV
- State GDP YoY
- ▲ 1.33%
- F500 in state
- 6
Industry mix (Fortune 500 HQ in DC)
| Industry | F500 HQs | Revenue |
|---|---|---|
| Financial Services | 1 | $153B |
|
||
| Life Sciences / Industrials | 1 | $25B |
|
||
| Industrial Machinery | 1 | $8B |
|
||
Price history
+1534.6% since first listed21 events — show timeline
- 2026-05-28 Coming Soon $425,000 BRIGHT MLS
- 2026-04-04 Listing Removed — BRIGHT MLS
- 2026-03-23 Listed $469,000 BRIGHT MLS
- 2026-03-23 Listing Removed — BRIGHT MLS
- 2026-01-07 Listed $499,999 BRIGHT MLS
- 2025-12-23 Listing Removed — BRIGHT MLS
- 2025-10-10 Listing Removed — BRIGHT MLS
- 2025-10-10 Listed $549,900 BRIGHT MLS
- 2025-09-18 Listed $575,000 BRIGHT MLS
- 2025-09-11 Coming Soon — BRIGHT MLS
- 2023-02-20 Listing Removed — BRIGHT MLS
- 2023-02-11 Contingent — BRIGHT MLS
- 2023-02-01 Relisted — BRIGHT MLS
- 2023-01-06 Listing Removed — BRIGHT MLS
- 2022-12-22 Coming Soon — BRIGHT MLS
- 2005-03-18 Sold (MLS) $255,000 MRIS
- 2005-03-17 Sold (Public Records) $255,000 Public Records
- 2005-02-15 Delisted — MRIS
- 2004-11-03 Sold (Public Records) $126,000 Public Records
- 2004-10-31 Listed $260,000 MRIS
- 1976-10-14 Sold (Public Records) $26,000 Public Records
Property tax history
+9.4%/yrLatest (2025): $2,531 · +9.0% YoY. Source: county tax records.
Cash-flow waterfall
monthlySold comps — $/sqft
last 12 mo · ≤1 miLoading sold comps…