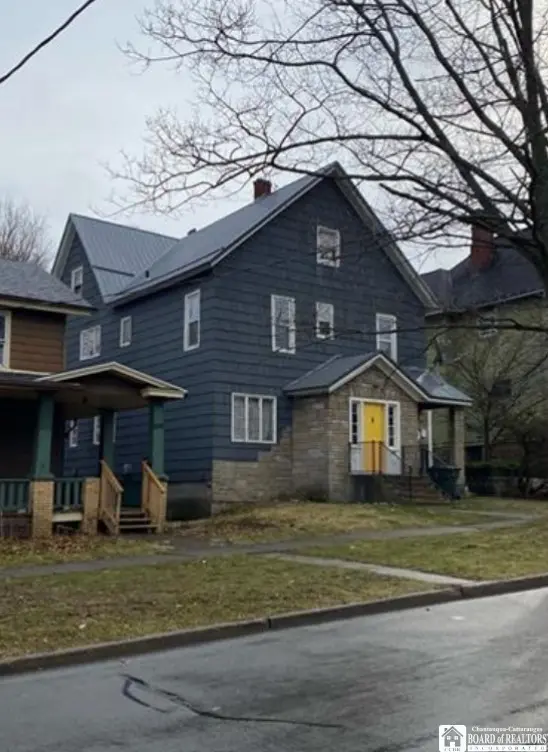
 Fourplex
608 Prendergast Ave · Jamestown, NY
Flood risk 1/10 · Minimal
- FEMA flood zone
- X
- Chance of flooding over 30 yrs
- 0.0%
- Est. flood insurance / yr
- $507 – $1,088
Fire risk 2/10 · Minimal
- Est. fire insurance / yr
- $691 – $1,283
Heat risk 2/10 · Minimal
- Hot days now (above 91°F)
- 7 days/yr
- Hot days in 30 yrs
- 17 days/yr
Wind risk 1/10 · Minimal
- Chance of severe wind over 30 yrs
- —
Air-quality risk 2/10 · Minimal
- Unhealthy air days now
- 0 days/yr
- Unhealthy air days in 30 yrs
- 1 days/yr
Risk factors via First Street. Map © Google.
Why this score? — see what drove the C+ grade
The composite is a weighted blend of 9 inputs, each scored 0–100. Each bar is that input's sub-score; the figure is the points it added to the 100-point composite (weight × sub-score).
- Cash flow +30.0/30.0
- 1% rule +10.0/10.0
- DSCR +10.0/10.0
- Livability +3.5/5.0
- Schools +3.1/10.0
- Rent growth +2.5/5.0
- Condition / age +2.5/5.0
- ARV discount +0.0/15.0
- Appreciation +0.0/10.0
$99,000
🖨 Deal sheet 📄 Offer letter ✓ Due diligence
Multi-family units
County records classify this as Multi-Family (5+ Unit). Listing-text estimate: 4 units. estimate disagrees with records
5+ unit building — per-unit beds/baths from public records are typically unavailable; the breakdown below (if shown) is an estimate from the listing text.
Listing remarks MLS
This is a 4 unit house with a newer roof. The two units on the first floor have all utilities included and the two units on the second floor have separate utilities.
Key facts
- Separate utilities
- Newer roof
- Utilities included
Tags
Neighborhood map
What this means for you Summary
Snapshot
- This is a 4 × 2-bed/4.0-bath units multifamily listed at $99k.
Deal economics
- At list price, monthly cash flow is $2k ($25k/yr) — positive. Per door: $529/mo.
- The deal already cash-flows at list — no discount required.
- Meets the 1% rule at list price ($4k rent vs $99k).
- Recommended offer: $87k (12.0% below list) — sets the bar for market timing.
- Cap rate 31.9% vs local median 16.6% in Jamestown — top-decile yield for the area; either an underpriced asset or a hidden risk that comps aren't pricing in. Stress-test before assuming the spread holds.
Location & tenants
- Location reads 69/100 on livability (#470 in NY) — a middle-class / working-renter tenant base. Strengths: cost of living A+, housing A+, health & safety A+; Watch: schools C-, amenities D, crime F.
- Jamestown City School District (town): math 33% / reading 42% proficiency, ranked #553 of 590 in NY (top 94%) — families likely to look elsewhere, expect single-tenant / working-renter base with shorter leases.
- Market conditions: 313 active listings in the ZIP; 127 units permitted in Chautauqua County in 2024 (0 in 5+ unit buildings).
- At $3,600/mo this rent would consume 87% of the median local household income ($50k/yr) (locally 1838% of renters already pay >50% of income on rent) — very limited rent-growth headroom before tenants either downsize or default.
Forward outlook
- Local home prices are declining (-3.0%/yr); year-one equity from $684 of loan paydown is wiped out by about $3k of value loss. Plan a longer hold.
- Chautauqua County population projected at -22% by 2050 — secular population decline; favor cash flow + early exit over multi-decade hold.
- At projected returns (-3.0% appreciation + 3.0% rent growth), your $28k cash investment doubles in ~2 years — after that, you're playing with house money.
Negotiation context
- It's been on market 144 days — a 12% lower offer ($87k) is reasonable based on typical stale-listing flexibility.
- 3 sale attempts since 7y ago; this cycle's ask has dropped $26k (21%) from the opening price — seller is motivated, your offer sets the floor, not the list.
Risks & watch-outs
- Watch-outs: built in 1892 — expect roof / HVAC / electrical / plumbing capex.
Questions for the listing agent
- It's been on market 144 days. Have you received any prior offers? Is the seller open to a 12% concession, seller financing, or rate buy-down credit?
- Can we see the unit-by-unit rent roll, current vacancy, and any below-market leases? What's the average tenancy length?
- What capital expenditures (roof, boiler, parking lot, exteriors) have been made in the last 5 years, and what's planned in the next 2?
- Built in 1892 — when were the roof, HVAC, electrical panel, plumbing, and water heater last replaced?
- Why hasn't it sold? Are there any deal-killer items the seller is aware of (foundation, flood, title, zoning, code violations)?
- Is there a deadline driving the sale (1031 exchange, divorce, estate, relocation)? That informs how much negotiation room exists.
- Crime grade is F in this area — have there been break-ins, vandalism, or insurance claims at this property in the last 3 years? What carrier currently insures it and at what premium?
- What's the average days-on-market for RENTAL listings here right now (not sales)? A rising rental-DOM trend means longer vacancies and softer asking-rent achievability than the comps imply.
- What's the recent tenant-quality profile in this submarket — average credit score on applications, eviction rate, late-payment / NSF rate, and stable-employment percentage? A property-management company in the area should have these aggregated.
- How much new apartment / multifamily construction is in the pipeline within 1–3 miles? Heavy new supply (>2% of stock underway) typically softens rents 12–24 months out; light construction supports rent growth.
Investment metrics
- 1% rule
- 3.64% ✓
- Cap rate
- 31.92%
- Cash-on-cash
- 91.54%
- DSCR
- 5.07
- GRM
- 2.3
CMA / ARV
- ARV (median comp)
- $70,937
- List price
- $99,000
- Delta
- 39.56%
- Verdict
- OVERPRICED
- Comps
- 20 within 1.0 mi
Projected returns pro-forma
-3.0% appreciation · 3.0% rent growth · sell at horizon
- IRR
- 92.3%
- Equity multiple
- 5.28×
- Total profit
- $118,717
- Equity at exit
- $14,761
- IRR
- 95.1%
- Equity multiple
- 11.00×
- Total profit
- $277,128
- Equity at exit
- $8,560
Cash invested: $27,720 (down + closing). Projections, not guarantees.
Landlord ↔ Tenant lean methodology
- Overall (STATE)
- 15 Strongly Tenant-Friendly
- State New York
- 15 Strongly Tenant-Friendly · D+10
- County
- — inherits STATE
- City
- — inherits STATE
ZIP-level market 14701
- Home prices YoY
- -18.5%
- Active inventory
- 313
- Price-to-rent
- 9.2×
Monthly cashflow live
- Estimated rent
- $3,600 medium interval (Pro) →
- Mortgage (P&I)
- −$519
- Tax from tax record
- −$169 /mo · $2,028/yr
- Insurance
- −$41
- HOA
- −$0
- Vacancy / Maint / Mgmt
- −$756
- Net cashflow
- $2,115
Break-even live
4-unit breakdown (identical units grouped — click to expand)
| Units | Beds | Baths | Est. rent |
|---|---|---|---|
| 4× units | 2 | 4 | $3,600 |
| #1 | 2 | 4 | $900 |
| #2 | 2 | 4 | $900 |
| #3 | 2 | 4 | $900 |
| #4 | 2 | 4 | $900 |
| Total (4 units) | $3,600 | ||
UW: 25.0% down · 7.5% · 30yr · 1.5% tax · 5.0% vac · 8.0% maint · 8.0% mgmt
Financing live
Cash to close
- Down payment
- $24,750
- Closing costs
- $2,970
- Reserves months
- —
- Total cash needed
- —
Loan-product check · same deal, 3 products live
Conventional
25% down · 7.5% · 30yr
- Down + closing
- —
- Monthly P&I
- —
- Monthly cashflow
- —
- DSCR
- —
- Eligible?
- —
Personal DTI + credit; lowest rate.
DSCR
20% down · 8.5% · 30yr
- Down + closing
- —
- Monthly P&I
- —
- Monthly cashflow
- —
- DSCR
- —
- Eligible?
- —
No personal income docs; deal must DSCR.
Hard money
10% down · 12.0% · 12mo
- Down + closing
- —
- Monthly P&I
- —
- Monthly cashflow
- —
- DSCR
- —
- Eligible?
- —
Short-term bridge; refi at stabilization.
Listing history 28 events
-
2026-06-19days on market $99,000 Active 144 DOM
-
2026-06-18days on market $99,000 Active 143 DOM
-
2026-06-17days on market $99,000 Active 142 DOM
-
2026-06-16days on market $99,000 Active 141 DOM
-
2026-06-15days on market $99,000 Active 140 DOM
-
2026-06-14days on market $99,000 Active 138 DOM
-
2026-06-12days on market $99,000 Active 137 DOM
-
2026-06-09days on market $99,000 Active 134 DOM
-
2026-06-08days on market $99,000 Active 133 DOM
-
2026-06-07days on market $99,000 Active 132 DOM
-
2026-06-05days on market $99,000 Active 129 DOM
-
2026-06-02days on market $99,000 Active 127 DOM
-
2026-06-01days on market $99,000 Active 126 DOM
-
2026-05-31days on market $99,000 Active 125 DOM
-
2026-05-30days on market $99,000 Active 124 DOM
-
2026-04-22price $99,000 165-char remark
Show marketing remark (165 chars)
This is a 4 unit house with a newer roof. The two units on the first floor have all utilities included and the two units on the second floor have separate utilities.
-
2026-01-26$125,000 Active 165-char remark
Show marketing remark (165 chars)
This is a 4 unit house with a newer roof. The two units on the first floor have all utilities included and the two units on the second floor have separate utilities.
-
2023-06-05soldstatus $110,000
-
2023-06-02soldstatus $110,000 Closed Sale or Rented 198-char remark
Show marketing remark (198 chars)
This is a 4 unit house with a new roof. The upstairs units have separate utilities. The downstairs units have utilities included in rent which the owner is responsible for. There is a full basement.
-
2023-03-21status Pending Sale 198-char remark
Show marketing remark (198 chars)
This is a 4 unit house with a new roof. The upstairs units have separate utilities. The downstairs units have utilities included in rent which the owner is responsible for. There is a full basement.
-
2023-02-22$120,000 Active 198-char remark
Show marketing remark (198 chars)
This is a 4 unit house with a new roof. The upstairs units have separate utilities. The downstairs units have utilities included in rent which the owner is responsible for. There is a full basement.
-
2020-09-08soldstatus $44,000 Closed Sale or Rented
-
2020-09-02soldstatus $44,000
-
2020-07-01status Pending Sale
-
2019-08-27price $54,900
-
2019-07-09$59,900 Active
-
2005-07-15soldstatus $32,000
-
2004-06-01soldstatus $46,000
ⓘ Source: listings_history table (triggers on properties + properties_extension) + one-shot
backfill from property_details.listing_events for pre-trigger history.
Tax reassessment forecast NY · Partial reset (capped growth)
- Current annual tax
- $2,028 · $169/mo
- Projected year-2 tax
- $2,028 · $169/mo
- Expected delta
- $0/yr ($0/mo · 0.0%)
ⓘ Screening estimate from a state-policy table — verify with the county assessor before closing.
Climate risk First Street
- Flood 1/10 Low FEMA zone X · 0% chance over 30 yrs
- Wildfire 2/10 Low
- Heat 2/10 Low 7 d/yr ≥91°F today · 17 d/yr by 30 yrs out
- Wind 1/10 Low
- Air quality 2/10 Low 0 unhealthy d/yr today · 1 by 30 yrs out
Nearby sold comps map
Loading sold comps map…
Walkable amenities ~0.75 mi
Loading nearby amenities…
Taxation est. · year 1
- Rental income
- $43,200
- − Mortgage interest
- −$5,546
- − Property taxes
- −$2,028
- − Insurance
- −$495
- − Repairs & maintenance
- −$3,456
- − Management
- −$3,456
- − Depreciation
- −$2,880
- Taxable income
- $25,339
- Est. tax owed @ 24.0%
- −$6,081
- After-tax cash flow
- $19,293/yr
For passive investors: Depreciation is non-cash, so a rental often shows a tax loss while cash-flowing — sheltering income. Rental losses are passive: they offset passive income freely, and up to $25,000/yr can offset ordinary (W-2) income if you actively participate and your MAGI is under $100k (phasing out to $0 by $150k); unused losses carry forward. On sale, claimed depreciation is recaptured at up to 25%, and gains may owe capital-gains tax (a 1031 exchange can defer both). Figures are a year-1 estimate at your 24.0% rate — not tax advice; consult a CPA.
Schools (NCES district)
- District
- Jamestown City School District
- NCES district ID
- 3615630
- Math proficiency
- 33% ▼ -3.00%
- Reading proficiency
- 42% ▲ 5.00%
- Median HH income
- $32,240
- Composite
- 30.69/100
- National rank
- #6176
- State rank
- #553 of 590 in NY
Livability — Jamestown
- Score
- 69/100
- State rank
- #470
- US rank
- #8213
Category grades
Schools grade is shown separately in the Schools card above.
Census & demographics
- Census place
- Jamestown, NY
- County
- Chautauqua County · 38,461 people
- City population
- 38,461
- Metro
- Jamestown-Dunkirk-Fredonia, NY
- Population (ZIP)
- 38,461
- Household income
- $49,685
- Rent vs Own
- Severe rent burden
- 1838.0
Population outlook (Chautauqua County) Hauer SSP2
- Today (2025)
- 123,454 people
- By 2030
- 118,509 · -4.0%
- By 2040
- 107,311 · -13.1%
- By 2050
- 96,703 · -21.7%
- By 2075
- 76,757 · -37.8%
- By 2100
- 60,984 · -50.6%
Race, ethnicity, and origin ACS 2023
- Neighborhood character
- Predominantly White (82%)
- Race & ethnicity
- White 82% Hispanic / Latino 11% Two or more races 6% Black 3%
- Hispanic origin (detail)
- Puerto Rican 8%
- Common ancestry
- Romanian 6% Lithuanian 2% Slovak 2%
- Foreign-born
- 3% · Canada
- Languages at home
- 92% English-only · Spanish 6% Other Indo-European 1% French/Haitian/Cajun 1%
Political lean MEDSL · Chautauqua
- 2024 margin
- Strong R (+22.0) · D 39.0% · R 61.0%
- 2008→2024 swing
- -22.9pp toward R · 2008: 0.9pp · 2024: -22.0pp
- All cycles
- 2024: R+22.0 2020: R+19.8 2016: R+24.6 2012: R+8.2 2008: D+0.9
Not yet ingested
- Civics
- —
Market trends
- HPI YoY
- ▼ -58.93%
- Current HPI
- 259.402
- Rent YoY
- —
- Metro
- Jamestown-Dunkirk-Fredonia, NY
- State GDP YoY
- ▲ 2.60%
- F500 in state
- 92
Industry mix (Fortune 500 HQ in NY)
| Industry | F500 HQs | Revenue |
|---|---|---|
| Financial Services | 10 | $950B |
|
||
| Consumer Goods | 9 | $162B |
|
||
| Insurance | 4 | $225B |
|
||
| Telecommunications | 2 | $144B |
|
||
| Pharmaceuticals | 2 | $112B |
|
||
| Media / Entertainment | 2 | $69B |
|
||
Price history
+115.2% since first listed13 events — show timeline
- 2026-04-22 Price Changed $99,000 UNYREIS
- 2026-01-26 Listed $125,000 UNYREIS
- 2023-06-05 Sold (Public Records) $110,000 Public Records
- 2023-06-02 Sold (MLS) $110,000 UNYREIS
- 2023-03-21 Pending — UNYREIS
- 2023-02-22 Listed $120,000 UNYREIS
- 2020-09-08 Sold (MLS) $44,000 UNYREIS
- 2020-09-02 Sold (Public Records) $44,000 Public Records
- 2020-07-01 Pending — UNYREIS
- 2019-08-27 Price Changed $54,900 UNYREIS
- 2019-07-09 Listed $59,900 UNYREIS
- 2005-07-15 Sold (Public Records) $32,000 Public Records
- 2004-06-01 Sold (Public Records) $46,000 Public Records
Property tax history
-2.9%/yrLatest (2025): $2,028 · +4.8% YoY. Source: county tax records.
Cash-flow waterfall
monthlySold comps — $/sqft
last 12 mo · ≤1 miLoading sold comps…