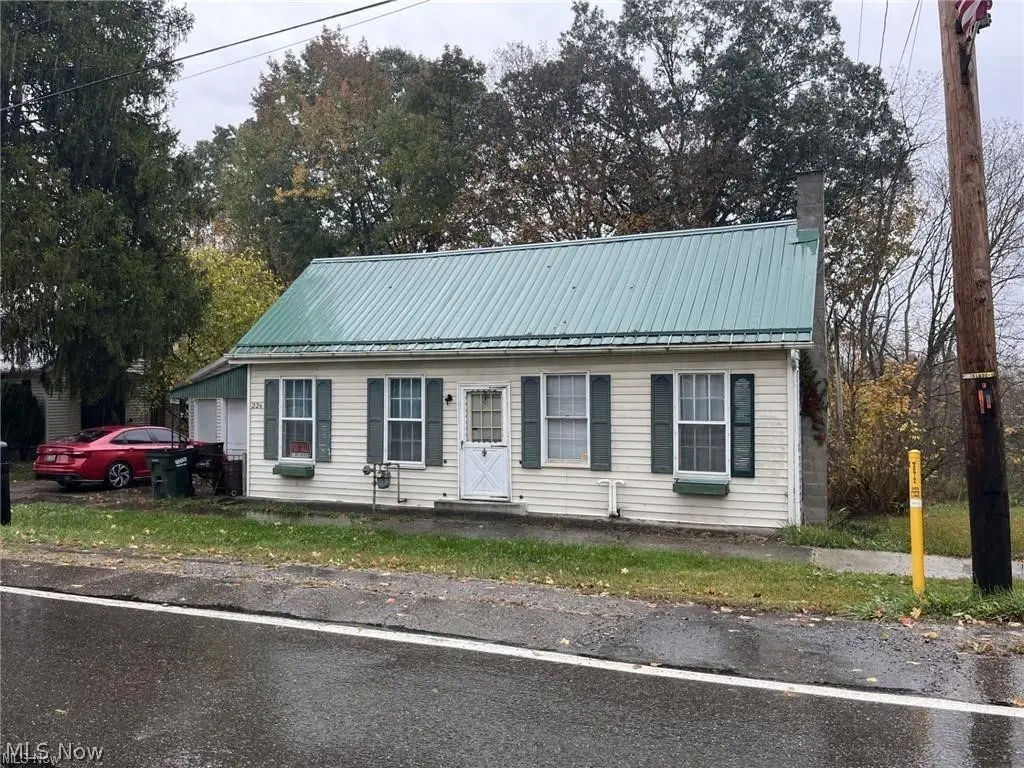
226 E Main St · Freeport, OH
Flood risk 1/10 · Minimal
- FEMA flood zone
- X (unshaded)
- Chance of flooding over 30 yrs
- 0.0%
- Est. flood insurance / yr
- $507 – $1,088
Fire risk 1/10 · Minimal
- Est. fire insurance / yr
- $713 – $1,323
Heat risk 3/10 · Minor
- Hot days now (above 97°F)
- 7 days/yr
- Hot days in 30 yrs
- 19 days/yr
Wind risk 1/10 · Minimal
- Chance of severe wind over 30 yrs
- —
Air-quality risk 2/10 · Minimal
- Unhealthy air days now
- 0 days/yr
- Unhealthy air days in 30 yrs
- 1 days/yr
Risk factors via First Street. Map © Google.
Why this score? — see what drove the A- grade
The composite is a weighted blend of 9 inputs, each scored 0–100. Each bar is that input's sub-score; the figure is the points it added to the 100-point composite (weight × sub-score).
- Cash flow +30.0/30.0
- ARV discount +15.0/15.0
- 1% rule +10.0/10.0
- DSCR +10.0/10.0
- Appreciation +7.3/10.0
- Schools +3.6/10.0
- Livability +3.0/5.0
- Rent growth +2.5/5.0
- Condition / age +2.5/5.0
$34,500
🖨 Deal sheet 📄 Offer letter ✓ Due diligence
Listing remarks
Dreaming of a place near the water? This cozy one-bedroom, one-bath home may need some TLC, but it's full of potential! Perfect for DIY enthusiasts or anyone looking for a rewarding project. With a detached one-car garage and a location close to multiple lakes for great fishing and outdoor fun, this could be your ideal retreat ? Just bring your vision and make it shine! The home has a new Gibson heating/central air, metal roof, updated electric in 2019, public water, and public sewer was installed in 2025. The property offers a spacious backyard as well as a detached one car garage.
Key facts
- Outdoor fun
- Detached garage
- 7,187 sq ft lot
Tags
Property features AI
Finance
- HOA & community: Sidewalks; Nearby fishing
Exterior
- Parking: Driveway; Detached garage (1 car)
- Utilities: Public water; Public sewer
- Home design: Single-story; Fixer condition
- Construction: Metal roof; Vinyl and wood siding; Block foundation; Built (year per public records)
- Exterior features: Awning(s); Side porch; Few trees; Paved lot; Has view
Interior
- Kitchen: Breakfast bar connected to counter; Counter bar / eat-in area; Access to pantry
- Bedrooms: One main-level bedroom
- Flooring: Carpet in living room and bedroom; Laminate in dining room; Hardwood in family room
- Bathrooms: One full bathroom on the main level
- Heating & cooling: Gas heating; Central air (electric)
- Interior features: Breakfast bar; Built-in features; Pantry; Unfinished basement; Laundry room
- Laundry & utility: Main-level laundry room; Utility room on the main level
Neighborhood map
What this means for you Summary
Snapshot
- This is a 1-bed/2.0-bath single-family listed at $34k.
Deal economics
- At list price, monthly cash flow is $406 ($5k/yr) — positive.
- The deal already cash-flows at list — no discount required.
- Meets the 1% rule at list price ($835 rent vs $34k).
- Recommended offer: $34k (1.5% below list) — sets the bar for market timing.
Location & tenants
- Location reads 59/100 on livability (#1,029 in OH) — a working-class tenant base; expect higher turnover. Strengths: cost of living A+, housing B+; Watch: schools C-, crime D, employment D.
- Harrison Hills City (rural): math 35% / reading 51% proficiency, ranked #522 of 656 in OH (top 80%) — families likely to look elsewhere, expect single-tenant / working-renter base with shorter leases.
- Market conditions: 10 active listings in the ZIP; 1 units permitted in Harrison County in 2024 (0 in 5+ unit buildings).
- This rent is only 14% of the median local income ($71k/yr) — well below the 30% rent-burden line; pricing power to push rent on renewal without tenant pushback.
Forward outlook
- In year one you build about $2k of equity ($239 loan paydown + $2k appreciation (4.5% local appreciation)).
- Harrison County population projected at -20% by 2050 — secular population decline; favor cash flow + early exit over multi-decade hold.
- At projected returns (4.5% appreciation + 3.0% rent growth), your $10k cash investment doubles in ~2 years — after that, you're playing with house money.
Negotiation context
- It's been on market 19 days — a 2% lower offer ($34k) is reasonable based on typical stale-listing flexibility.
- 2 sale attempts with the ask held roughly flat each time — persistent listings suggest the price (not the market) is what's stuck; bring a comps-based counter.
Risks & watch-outs
- Watch-outs: built in 1920 — expect roof / HVAC / electrical / plumbing capex.
Questions for the listing agent
- Built in 1920 — when were the roof, HVAC, electrical panel, plumbing, and water heater last replaced?
- Is there a deadline driving the sale (1031 exchange, divorce, estate, relocation)? That informs how much negotiation room exists.
- Crime grade is D in this area — have there been break-ins, vandalism, or insurance claims at this property in the last 3 years? What carrier currently insures it and at what premium?
- What's the average days-on-market for RENTAL listings here right now (not sales)? A rising rental-DOM trend means longer vacancies and softer asking-rent achievability than the comps imply.
- What's the recent tenant-quality profile in this submarket — average credit score on applications, eviction rate, late-payment / NSF rate, and stable-employment percentage? A property-management company in the area should have these aggregated.
- How much new for-sale + rental construction is in the pipeline within 1–3 miles? Heavy new supply typically softens prices + rents 12–24 months out; constrained supply supports both.
Investment metrics
- 1% rule
- 2.42% ✓
- Cap rate
- 20.40%
- Cash-on-cash
- 50.39%
- DSCR
- 3.24
- GRM
- 3.4
CMA / ARV
- ARV (median comp)
- $52,719
- List price
- $34,500
- Delta
- -34.56%
- Verdict
- UNDERPRICED
- Comps
- 2 within 1.0 mi
Projected returns pro-forma
4.54% appreciation · 3.0% rent growth · sell at horizon
- IRR
- 57.4%
- Equity multiple
- 4.41×
- Total profit
- $32,913
- Equity at exit
- $18,599
- IRR
- 55.6%
- Equity multiple
- 9.04×
- Total profit
- $77,657
- Equity at exit
- $31,340
Cash invested: $9,660 (down + closing). Projections, not guarantees.
Landlord ↔ Tenant lean methodology
- Overall (STATE)
- 73 Landlord-Friendly
- State Ohio
- 73 Landlord-Friendly · R+6
- County
- — inherits STATE
- City
- — inherits STATE
ZIP-level market 43973
- Home prices YoY
- 2.8%
- Active inventory
- 10
- Price-to-rent
- 3.4×
Monthly cashflow live
- Estimated rent
- $835 medium interval (Pro) →
- Mortgage (P&I)
- −$181
- Tax from tax record
- −$59 /mo · $709/yr
- Insurance
- −$14
- HOA
- −$0
- Vacancy / Maint / Mgmt
- −$175
- Net cashflow
- $406
Break-even live
UW: 25.0% down · 7.5% · 30yr · 1.5% tax · 5.0% vac · 8.0% maint · 8.0% mgmt
Financing live
Cash to close
- Down payment
- $8,625
- Closing costs
- $1,035
- Reserves months
- —
- Total cash needed
- —
Loan-product check · same deal, 3 products live
Conventional
25% down · 7.5% · 30yr
- Down + closing
- —
- Monthly P&I
- —
- Monthly cashflow
- —
- DSCR
- —
- Eligible?
- —
Personal DTI + credit; lowest rate.
DSCR
20% down · 8.5% · 30yr
- Down + closing
- —
- Monthly P&I
- —
- Monthly cashflow
- —
- DSCR
- —
- Eligible?
- —
No personal income docs; deal must DSCR.
Hard money
10% down · 12.0% · 12mo
- Down + closing
- —
- Monthly P&I
- —
- Monthly cashflow
- —
- DSCR
- —
- Eligible?
- —
Short-term bridge; refi at stabilization.
Listing history 9 events
-
2026-06-04statusdays on market $34,500 Pending 19 DOM
-
2026-06-02days on market $34,500 Active 18 DOM
-
2026-06-01days on market $34,500 Active 17 DOM
-
2026-05-31days on market $34,500 Active 16 DOM
-
2026-05-15$34,500 Active 590-char remark
-
2026-05-06historical
-
2026-01-29price $48,000
-
2025-11-06$52,500 Active
-
2020-05-11soldstatus $45,000
ⓘ Source: listings_history table (triggers on properties + properties_extension) + one-shot
backfill from property_details.listing_events for pre-trigger history.
Tax reassessment forecast OH · Partial reset (capped growth)
- Current annual tax
- $709 · $59/mo
- Projected year-2 tax
- $709 · $59/mo
- Expected delta
- $0/yr ($0/mo · 0.0%)
ⓘ Screening estimate from a state-policy table — verify with the county assessor before closing.
Climate risk First Street
- Flood 1/10 Low FEMA zone X (unshaded) · 0% chance over 30 yrs
- Wildfire 1/10 Low
- Heat 3/10 Moderate 7 d/yr ≥97°F today · 19 d/yr by 30 yrs out
- Wind 1/10 Low
- Air quality 2/10 Low 0 unhealthy d/yr today · 1 by 30 yrs out
Nearby sold comps map
Loading sold comps map…
Walkable amenities ~0.75 mi
Loading nearby amenities…
Taxation est. · year 1
- Rental income
- $10,025
- − Mortgage interest
- −$1,933
- − Property taxes
- −$709
- − Insurance
- −$172
- − Repairs & maintenance
- −$802
- − Management
- −$802
- − Depreciation
- −$1,004
- Taxable income
- $4,603
- Est. tax owed @ 24.0%
- −$1,105
- After-tax cash flow
- $3,762/yr
For passive investors: Depreciation is non-cash, so a rental often shows a tax loss while cash-flowing — sheltering income. Rental losses are passive: they offset passive income freely, and up to $25,000/yr can offset ordinary (W-2) income if you actively participate and your MAGI is under $100k (phasing out to $0 by $150k); unused losses carry forward. On sale, claimed depreciation is recaptured at up to 25%, and gains may owe capital-gains tax (a 1031 exchange can defer both). Figures are a year-1 estimate at your 24.0% rate — not tax advice; consult a CPA.
Schools (NCES district)
- District
- Harrison Hills City
- NCES district ID
- 3904524
- Math proficiency
- 35% ▼ -24.00%
- Reading proficiency
- 51% ▼ -12.00%
- Median HH income
- $39,642
- Composite
- 35.93/100
- National rank
- #4803
- State rank
- #522 of 656 in OH
Livability — Freeport
- Score
- 59/100
- State rank
- #1029
- US rank
- #20449
Category grades
Schools grade is shown separately in the Schools card above.
Census & demographics
- Census place
- Freeport, OH
- County
- Harrison · 13,333 people
- Population (ZIP)
- 2,341
- Household income
- $70,833
- Rent vs Own
Population outlook (Harrison County) Hauer SSP2
- Today (2025)
- 14,537 people
- By 2030
- 13,961 · -4.0%
- By 2040
- 12,753 · -12.3%
- By 2050
- 11,607 · -20.2%
- By 2075
- 9,299 · -36.0%
- By 2100
- 7,447 · -48.8%
Race, ethnicity, and origin ACS 2023
- Neighborhood character
- Predominantly White (97%)
- Race & ethnicity
- White 97% Hispanic / Latino 3%
- Common ancestry
- Iranian 11% Romanian 4% Serbian 1%
- Foreign-born
- 0%
- Languages at home
- 93% English-only · German/W. Germanic 6% Russian/Polish/Slavic 1% Other Indo-European 1%
Political lean MEDSL · Harrison
- 2024 margin
- Solid R (+55.2) · D 21.9% · R 77.1%
- 2008→2024 swing
- -52.8pp toward R · 2008: -2.4pp · 2024: -55.2pp
- All cycles
- 2024: R+55.2 2020: R+52.6 2016: R+48.3 2012: R+14.9 2008: R+2.4
Not yet ingested
- Civics
- —
Market trends
- HPI YoY
- ▲ 4.54%
- Current HPI
- 164.5633
- Rent YoY
- —
- Metro
- —
- State GDP YoY
- ▲ 1.98%
- F500 in state
- 48
Industry mix (Fortune 500 HQ in OH)
| Industry | F500 HQs | Revenue |
|---|---|---|
| Insurance | 3 | $145B |
|
||
| Industrial Machinery | 3 | $49B |
|
||
| Financial Services | 3 | $24B |
|
||
| Consumer Goods | 2 | $93B |
|
||
| Aerospace / Defense | 2 | $47B |
|
||
| Utilities | 2 | $33B |
|
||
Price history
-23.3% since first listed6 events — show timeline
- 2026-06-03 Pending — MLSNOW
- 2026-05-15 Listed $34,500 MLSNOW
- 2026-05-06 Listing Removed — MLSNOW
- 2026-01-29 Price Changed $48,000 MLSNOW
- 2025-11-06 Listed $52,500 MLSNOW
- 2020-05-11 Sold (Public Records) $45,000 Public Records
Property tax history
+23.1%/yrLatest (2025): $709 · +0.1% YoY. Source: county tax records.
Cash-flow waterfall
monthlySold comps — $/sqft
last 12 mo · ≤1 miLoading sold comps…