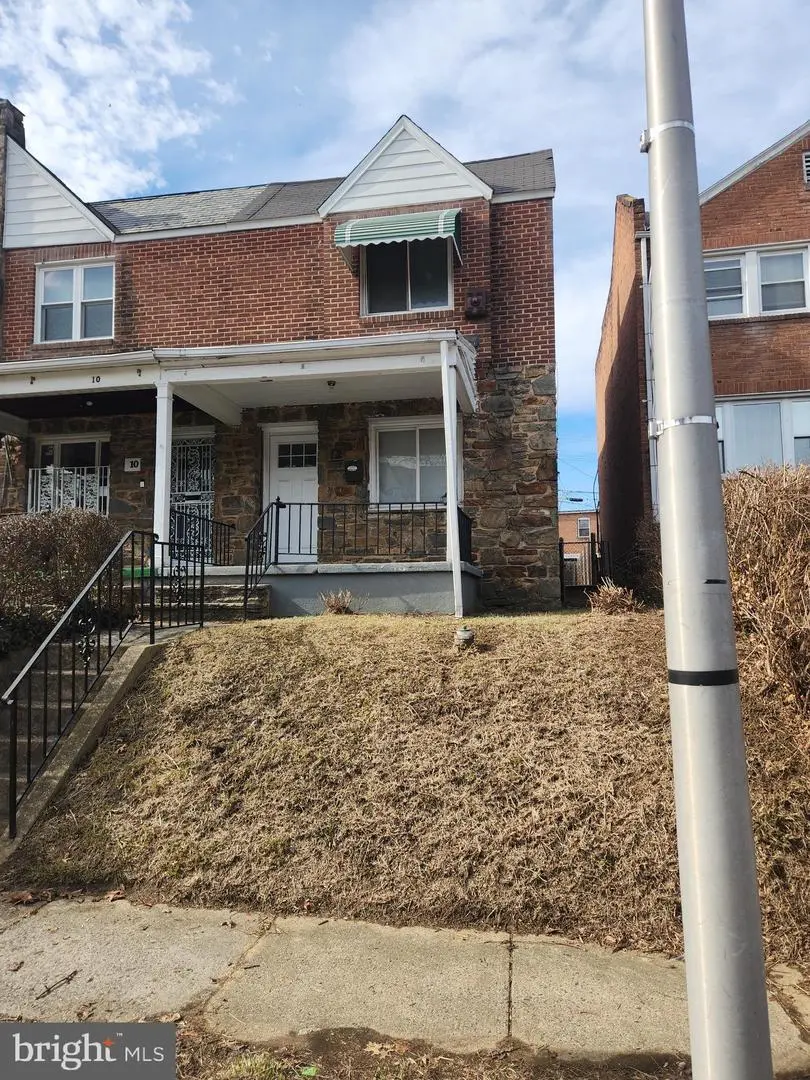
12 N Kossuth St · Baltimore, MD
Flood risk 1/10 · Minimal
- FEMA flood zone
- X (unshaded)
- Chance of flooding over 30 yrs
- 0.0%
- Est. flood insurance / yr
- $473 – $860
Fire risk 1/10 · Minimal
- Est. fire insurance / yr
- $755 – $1,403
Heat risk 7/10 · Major
- Hot days now (above 103°F)
- 7 days/yr
- Hot days in 30 yrs
- 15 days/yr
Wind risk 6/10 · Moderate
- Chance of severe wind over 30 yrs
- 27.0%
Air-quality risk 3/10 · Minor
- Unhealthy air days now
- 3 days/yr
- Unhealthy air days in 30 yrs
- 4 days/yr
Risk factors via First Street. Map © Google.
Why this score? — see what drove the C grade
The composite is a weighted blend of 9 inputs, each scored 0–100. Each bar is that input's sub-score; the figure is the points it added to the 100-point composite (weight × sub-score).
- Cash flow +27.8/30.0
- DSCR +9.8/10.0
- 1% rule +7.3/10.0
- Rent growth +3.8/5.0
- Livability +3.8/5.0
- Condition / age +2.5/5.0
- Schools +1.0/10.0
- ARV discount +0.1/15.0
- Appreciation +0.0/10.0
$145,900
🖨 Deal sheet 📄 Offer letter ✓ Due diligence
Listing remarks MLS
ATTENTION! ATTENTION! Come one, come all! Priced to sell! This 3 bedroom and one and a half baths townhome is ideal for first time home buyers or investors who wish to add to their portfolio. Located in an attractive block near Hilton Pwy, the home renders easy access to I95 and is just minutes from the new renovation project of Edmondson Village Shopping Center. The home offers central air conditioning and forced hot air heating. There are LVT flooring on all levels, including the basement. Stainless steel appliances and a breakfast bar are attractive features of the kitchen. Upstairs you will find 3 decent sized bedrooms and a full bath. The living room and dining room are separated by a convenient half bath. From the kitchen you can access the backyard, which is fully enclosed by a privacy fence. The gated side yard leads to the front lawn. This home has great potential and waits eagerly for the right buyer.
Key facts
- Built 1940
- Listed 107 days
Neighborhood map
What this means for you Summary
Snapshot
- This is a 3-bed/1.0-bath townhouse listed at $146k.
Deal economics
- At list price, monthly cash flow is $446 ($5k/yr) — positive.
- The deal already cash-flows at list — no discount required.
- Meets the 1% rule at list price ($2k rent vs $146k).
- Recommended offer: $133k (9.0% below list) — sets the bar for market timing.
- Cap rate 10.0% vs local median 6.0% in Baltimore — top-decile yield for the area; either an underpriced asset or a hidden risk that comps aren't pricing in. Stress-test before assuming the spread holds.
Location & tenants
- Location reads 76/100 on livability (#90 in MD, #3,396 nationally) — a middle-class / working-renter tenant base. Strengths: amenities A+, commute A+, housing A+; Watch: schools D, crime F.
- Baltimore City Public Schools (urban): math 7% / reading 16% proficiency, ranked #24 of 24 in MD (top 100%) — low school quality limits family demand, transient renter base, plan for 1-2y turnover; 79% free/reduced lunch — lower-income household profile, screen leases tightly.
- Market conditions: Rents rising fast (+5.4%/yr); 252 active listings in the ZIP; 40 comparable units currently listed for rent nearby; rentals at typical pace (median 24d on market — plan ~3-4 weeks tenant-placement turnaround); 45% of comp listings sitting > 30 days — soft ceiling on asking rent; 1,273 units permitted in Baltimore city in 2024 (1,104 in 5+ unit buildings).
- This rent runs 36% of the median local income ($60k/yr) — at the standard rent-burdened threshold; future hikes will face affordability resistance.
Forward outlook
- Local home prices are declining (-3.0%/yr); year-one equity from $1k of loan paydown is wiped out by about $4k of value loss. Plan a longer hold.
- Baltimore County population projected to shrink 4% by 2050 — rents likely to lag national; underwrite the cash flow, not the appreciation.
- At projected returns (-3.0% appreciation + 5.4% rent growth), your $41k cash investment doubles in ~8 years — after that, you're playing with house money.
Negotiation context
- It's been on market 107 days — a 9% lower offer ($133k) is reasonable based on typical stale-listing flexibility.
- 6 sale attempts since 20y ago; this cycle's ask has dropped $14k (9%) from the opening price — seller is motivated, your offer sets the floor, not the list.
Risks & watch-outs
- Watch-outs: built in 1940 — expect roof / HVAC / electrical / plumbing capex.
- Climate carrying-cost: major wind risk, 27% chance of damaging wind over 30y; extreme-heat days projected 7→15/yr by 2055 (HVAC capex compounding) — expect insurance premiums to compound above CPI over the hold.
Questions for the listing agent
- It's been on market 107 days. Have you received any prior offers? Is the seller open to a 9% concession, seller financing, or rate buy-down credit?
- Built in 1940 — when were the roof, HVAC, electrical panel, plumbing, and water heater last replaced?
- Why hasn't it sold? Are there any deal-killer items the seller is aware of (foundation, flood, title, zoning, code violations)?
- Is there a deadline driving the sale (1031 exchange, divorce, estate, relocation)? That informs how much negotiation room exists.
- Schools are D-rated, which usually means shorter tenancies and higher turnover. Who's the typical renter profile here, and what's been the actual vacancy rate?
- Crime grade is F in this area — have there been break-ins, vandalism, or insurance claims at this property in the last 3 years? What carrier currently insures it and at what premium?
- What's the average days-on-market for RENTAL listings here right now (not sales)? A rising rental-DOM trend means longer vacancies and softer asking-rent achievability than the comps imply.
- What's the recent tenant-quality profile in this submarket — average credit score on applications, eviction rate, late-payment / NSF rate, and stable-employment percentage? A property-management company in the area should have these aggregated.
- How much new for-sale + rental construction is in the pipeline within 1–3 miles? Heavy new supply typically softens prices + rents 12–24 months out; constrained supply supports both.
Investment metrics
- 1% rule
- 1.23% ✓
- Cap rate
- 9.96%
- Cash-on-cash
- 13.11%
- DSCR
- 1.58
- GRM
- 6.8
CMA / ARV
- ARV (median comp)
- $125,270
- List price
- $145,900
- Delta
- 16.47%
- Verdict
- OVERPRICED
- Comps
- 20 within 1.0 mi
Show comp detail 12 sales within ~0.75 mi
| Address | Dist | Beds/Ba | Sqft | Sold | Price | $/sf | Match |
|---|---|---|---|---|---|---|---|
| 222 N Hilton St | 0.14mi | 3/1.0 | 1,120 (+2%) | 1mo | $89,775 | $80 | 90 |
| 107 N Monastery Ave | 0.07mi | 2/1.5 (-1) | 1,080 (-2%) | 2mo | $65,000 | $60 | 85 |
| 209 Mount Holly St | 0.30mi | 3/2.0 | 1,080 (-2%) | 2mo | $228,000 | $211 | 78 |
| 119 Hilton St | 0.14mi | 2/2.0 (-1) | 1,040 (-6%) | 0mo | $211,000 | $203 | 75 |
| 3039 Harlem Ave | 0.65mi | 3/1.0 | 1,070 (-3%) | 1mo | $27,500 | $26 | 64 |
| 38 N Monastery Ave | 0.17mi | 3/2.0 | 1,260 (+14%) | 3mo | $90,000 | $71 | 62 |
| 300 Denison St | 0.21mi | 3/2.0 | 1,260 (+14%) | 2mo | $205,000 | $163 | 60 |
| 3302 W Franklin St | 0.37mi | 3/1.0 | 960 (-13%) | 2mo | $50,000 | $52 | 60 |
| 21 Culver St | 0.14mi | 2/2.0 (-1) | 1,260 (+14%) | 1mo | $210,000 | $167 | 59 |
| 3306 W Franklin St | 0.36mi | 3/2.0 | 960 (-13%) | 1mo | $51,500 | $54 | 57 |
| 537 Longwood St | 0.65mi | 4/2.0 (+1) | 1,176 (+7%) | 0mo | $60,000 | $51 | 49 |
| 3017 Frederick Ave | 0.67mi | 4/3.0 (+1) | 1,260 (+14%) | 2mo | $217,000 | $172 | 30 |
Match score weights: distance 35% · size 25% · config 20% · recency 20%. Top-matched comps best support the ARV.
Projected returns pro-forma
-3.0% appreciation · 5.38% rent growth · sell at horizon
- IRR
- 5.6%
- Equity multiple
- 1.22×
- Total profit
- $9,188
- Equity at exit
- $21,754
- IRR
- 17.1%
- Equity multiple
- 2.56×
- Total profit
- $63,584
- Equity at exit
- $12,615
Cash invested: $40,852 (down + closing). Projections, not guarantees.
Landlord ↔ Tenant lean methodology
- Overall (CITY)
- 12 Strongly Tenant-Friendly
- State Maryland
- 27 Tenant-Leaning · D+14
- County
- — inherits STATE
- City Baltimore
- 12 Strongly Tenant-Friendly · D+58
ZIP-level market 21229
- Rents YoY
- 5.4%
- Active inventory
- 252
- Price-to-rent
- 6.8×
Monthly cashflow live
- Estimated rent
- $1,795 high interval (Pro) →
- Mortgage (P&I)
- −$765
- Tax from tax record
- −$146 /mo · $1,752/yr
- Insurance
- −$61
- HOA
- −$0
- Vacancy / Maint / Mgmt
- −$377
- Net cashflow
- $446
Break-even live
UW: 25.0% down · 7.5% · 30yr · 1.5% tax · 5.0% vac · 8.0% maint · 8.0% mgmt
Financing live
Cash to close
- Down payment
- $36,475
- Closing costs
- $4,377
- Reserves months
- —
- Total cash needed
- —
Loan-product check · same deal, 3 products live
Conventional
25% down · 7.5% · 30yr
- Down + closing
- —
- Monthly P&I
- —
- Monthly cashflow
- —
- DSCR
- —
- Eligible?
- —
Personal DTI + credit; lowest rate.
DSCR
20% down · 8.5% · 30yr
- Down + closing
- —
- Monthly P&I
- —
- Monthly cashflow
- —
- DSCR
- —
- Eligible?
- —
No personal income docs; deal must DSCR.
Hard money
10% down · 12.0% · 12mo
- Down + closing
- —
- Monthly P&I
- —
- Monthly cashflow
- —
- DSCR
- —
- Eligible?
- —
Short-term bridge; refi at stabilization.
Rent comps 40 comps
| Address | Beds | Baths | Sqft | Rent | $/sqft | DOM | Units | Dist |
|---|---|---|---|---|---|---|---|---|
| 41 N Kossuth St Baltimore, MD | 3.0 | 2.0 | 1216 | $1,800 | $1.48 | 23d | 1 | 0.08mi |
| 3310 Elbert St Baltimore, MD | 2.0 | 1.0 | 920 | $1,550 | $1.68 | 23d | 1 | 0.12mi |
| 3336 W Caton Ave Baltimore, MD | 3.0 | 2.0 | 1236 | $1,625 | $1.31 | 23d | 1 | 0.16mi |
| 3607 W Lexington St Baltimore, MD | 3.0 | 2.0 | 1050 | $1,895 | $1.80 | 4d | 1 | 0.19mi |
| 405 N Edgewood St Baltimore, MD | 4.0 | 2.0 | 1408 | $2,950 | $2.10 | 4d | 1 | 0.28mi |
| 3706 W Franklin St Unit 1 Baltimore, MD | 2.0 | 1.0 | 735 | $1,100 | $1.50 | 4d | 1 | 0.39mi |
| 3507 Edmondson Ave Baltimore, MD | 4.0 | 2.0 | 1428 | $2,300 | $1.61 | 43d | 1 | 0.40mi |
| 3423 Edmondson Ave Baltimore, MD | 2.0 | 1.5 | 1400 | $1,710 | $1.22 | 43d | 1 | 0.40mi |
| 623 N Grantley St Baltimore, MD | 4.0 | 2.0 | 1250 | $2,000 | $1.60 | 23d | 1 | 0.50mi |
| 212 S Loudon Ave Baltimore, MD | 3.0 | 1.5 | 1310 | $1,550 | $1.18 | 43d | 1 | 0.51mi |
| 4018 Massachusetts Ave Baltimore, MD | 3.0 | 1.0 | 1050 | $1,400 | $1.33 | 23d | 1 | 0.53mi |
| 709 Denison St Baltimore, MD | 2.0 | 2.0 | 840 | $1,630 | $1.94 | 23d | 1 | 0.53mi |
| 730 Linnard St Unit 1 Baltimore, MD | 4.0 | 1.0 | 1360 | $1,750 | $1.29 | 23d | 1 | 0.55mi |
| 3712 Gelston Dr Baltimore, MD | 3.0 | 2.0 | 1250 | $2,500 | $2.00 | 23d | 1 | 0.59mi |
| 780 Linnard St Baltimore, MD | 3.0 | 2.0 | 1224 | $1,590 | $1.30 | 43d | 1 | 0.63mi |
| 787 N Grantley St Baltimore, MD | 3.0 | 1.0 | 1116 | $1,575 | $1.41 | 23d | 1 | 0.64mi |
| 2 S Woodington Rd Baltimore, MD | 2.0 | 1.0 | 856 | $1,160 | $1.36 | 14d | 1 | 0.65mi |
| 2 N Woodington Rd Baltimore, MD | 1.0–2.0 | 1.0 | 738 | $1,335 | $1.81 | 2d | 5 | 0.66mi |
| 798 N Grantley St Baltimore, MD | 3.0 | 2.0 | 1360 | $2,295 | $1.69 | 23d | 1 | 0.66mi |
| 3130 Stafford St Baltimore, MD | 3.0 | 1.0 | 1200 | $1,500 | $1.25 | 20d | 1 | 0.66mi |
| 304 Collins Ave Unit 2 Baltimore, MD | 3.0 | 1.0 | 1016 | $2,100 | $2.07 | 43d | 1 | 0.67mi |
| 4020 Gelston Dr Baltimore, MD | 3.0 | 2.0 | 1270 | $1,875 | $1.48 | 43d | 1 | 0.69mi |
| 3015 Rayner Ave Baltimore, MD | 3.0 | 1.0 | 1152 | $1,350 | $1.17 | 43d | 1 | 0.70mi |
| 2815 W Mulberry St Baltimore, MD | 4.0 | 2.0 | 1040 | $2,050 | $1.97 | 43d | 1 | 0.72mi |
| 111 Upmanor Rd Baltimore, MD | 3.0 | 1.5 | 1224 | $2,163 | $1.77 | 43d | 1 | 0.81mi |
| 2636 Lauretta Ave Baltimore, MD | 3.0 | 2.5 | 1232 | $1,900 | $1.54 | 43d | 1 | 0.89mi |
| 2609 Lauretta Ave Baltimore, MD | 3.0 | 1.0 | 1286 | $1,675 | $1.30 | 23d | 1 | 0.91mi |
| 1042 Ellicott Dr Baltimore, MD | 2.0 | 1.0 | 900 | $1,450 | $1.61 | 43d | 1 | 0.92mi |
| 3238 Westmont Ave Baltimore, MD | 3.0 | 1.0 | 1280 | $1,600 | $1.25 | 43d | 1 | 0.93mi |
| 2537 Hollins St Baltimore, MD | 3.0 | 2.0 | 1200 | $1,450 | $1.21 | 23d | 1 | 0.94mi |
| 4301 Parkton St Baltimore, MD | 1.0–3.0 | 1.0 | 730 | $1,550 | $2.12 | 43d | 1 | 0.96mi |
| 4520 Scarlet Oak Ln Baltimore, MD | 2.0 | 1.0 | 1025 | $1,500 | $1.46 | 43d | 1 | 0.96mi |
| 3392 Saint Benedict St Baltimore, MD | 2.0 | 1.0 | 864 | $1,450 | $1.68 | 23d | 1 | 0.97mi |
| 917 Kevin Rd Baltimore, MD | 3.0 | 2.0 | 1151 | $1,795 | $1.56 | 1d | 1 | 0.97mi |
| 2516 Hollins St Baltimore, MD | 3.0 | 2.0 | 1100 | $1,700 | $1.55 | 43d | 1 | 0.97mi |
| 332 S Franklintown Rd Unit 2 Baltimore, MD | 2.0 | 1.0 | 776 | $795 | $1.02 | 23d | 1 | 0.99mi |
| 4103 Mountwood Rd Baltimore, MD | 3.0 | 2.0 | 1030 | $1,700 | $1.65 | 43d | 1 | 1.00mi |
| 3935 Stokes Dr #1 Baltimore, MD | 2.0 | 1.0 | 1150 | $1,400 | $1.22 | 43d | 1 | 1.00mi |
| 1307 Wildwood Pkwy Baltimore, MD | 2.0 | 1.0 | 725 | $1,295 | $1.79 | 43d | 1 | 1.00mi |
| 1216 N Augusta Ave Baltimore, MD | 3.0 | 1.0 | 1024 | $1,550 | $1.51 | 23d | 1 | 1.01mi |
Listing history 34 events
-
2026-06-18days on market $145,900 Active 107 DOM
-
2026-06-17days on market $145,900 Active 106 DOM
-
2026-06-16days on market $145,900 Active 105 DOM
-
2026-06-15days on market $145,900 Active 104 DOM
-
2026-06-13days on market $145,900 Active 102 DOM
-
2026-06-09days on market $145,900 Active 98 DOM
-
2026-06-08days on market $145,900 Active 97 DOM
-
2026-06-07pricedays on market $145,900 Active 96 DOM
-
2026-06-04days on market $159,540 Active 93 DOM
-
2026-06-03days on market $159,540 Active 92 DOM
-
2026-06-02days on market $159,540 Active 91 DOM
-
2026-06-01days on market $159,540 Active 90 DOM
-
2026-05-31days on market $159,540 Active 89 DOM
-
2026-03-03$159,540 Active 927-char remark
Show marketing remark (927 chars)
ATTENTION! ATTENTION! Come one, come all! Priced to sell! This 3 bedroom and one and a half baths townhome is ideal for first time home buyers or investors who wish to add to their portfolio. Located in an attractive block near Hilton Pwy, the home renders easy access to I95 and is just minutes from the new renovation project of Edmondson Village Shopping Center. The home offers central air conditioning and forced hot air heating. There are LVT flooring on all levels, including the basement. Stainless steel appliances and a breakfast bar are attractive features of the kitchen. Upstairs you will find 3 decent sized bedrooms and a full bath. The living room and dining room are separated by a convenient half bath. From the kitchen you can access the backyard, which is fully enclosed by a privacy fence. The gated side yard leads to the front lawn. This home has great potential and waits eagerly for the right buyer.
-
2026-02-28historical $159,540 927-char remark
Show marketing remark (927 chars)
ATTENTION! ATTENTION! Come one, come all! Priced to sell! This 3 bedroom and one and a half baths townhome is ideal for first time home buyers or investors who wish to add to their portfolio. Located in an attractive block near Hilton Pwy, the home renders easy access to I95 and is just minutes from the new renovation project of Edmondson Village Shopping Center. The home offers central air conditioning and forced hot air heating. There are LVT flooring on all levels, including the basement. Stainless steel appliances and a breakfast bar are attractive features of the kitchen. Upstairs you will find 3 decent sized bedrooms and a full bath. The living room and dining room are separated by a convenient half bath. From the kitchen you can access the backyard, which is fully enclosed by a privacy fence. The gated side yard leads to the front lawn. This home has great potential and waits eagerly for the right buyer.
-
2015-11-01historical Withdrawn
-
2015-11-01historical
-
2015-07-01Active
-
2015-07-01$49,900
-
2015-05-01historical
-
2015-05-01historical Expired
-
2015-04-20price
-
2015-03-10price
-
2015-03-01price
-
2015-01-04price
-
2014-12-12price
-
2014-11-05Active
-
2014-11-04$49,000
-
2007-04-09soldstatus $127,000
-
2006-08-11soldstatus $127,000
-
2006-06-26historical
-
2006-04-27$127,000
-
2005-12-07soldstatus $55,000
-
1995-04-05soldstatus $27,705
ⓘ Source: listings_history table (triggers on properties + properties_extension) + one-shot
backfill from property_details.listing_events for pre-trigger history.
Tax reassessment forecast MD · Partial reset (capped growth)
- Current annual tax
- $1,752 · $146/mo
- Projected year-2 tax
- $1,752 · $146/mo
- Expected delta
- $0/yr ($0/mo · 0.0%)
ⓘ Screening estimate from a state-policy table — verify with the county assessor before closing.
Climate risk First Street
- Flood 1/10 Low FEMA zone X (unshaded) · 0% chance over 30 yrs
- Wildfire 1/10 Low
- Heat 7/10 Severe 7 d/yr ≥103°F today · 15 d/yr by 30 yrs out
- Wind 6/10 Major 27% chance of damaging wind over 30 yrs
- Air quality 3/10 Moderate 3 unhealthy d/yr today · 4 by 30 yrs out
Nearby sold comps map
Loading sold comps map…
Walkable amenities ~0.75 mi
Loading nearby amenities…
Taxation est. · year 1
- Rental income
- $21,543
- − Mortgage interest
- −$8,173
- − Property taxes
- −$1,752
- − Insurance
- −$730
- − Repairs & maintenance
- −$1,723
- − Management
- −$1,723
- − Depreciation
- −$4,244
- Taxable income
- $3,197
- Est. tax owed @ 24.0%
- −$767
- After-tax cash flow
- $4,588/yr
For passive investors: Depreciation is non-cash, so a rental often shows a tax loss while cash-flowing — sheltering income. Rental losses are passive: they offset passive income freely, and up to $25,000/yr can offset ordinary (W-2) income if you actively participate and your MAGI is under $100k (phasing out to $0 by $150k); unused losses carry forward. On sale, claimed depreciation is recaptured at up to 25%, and gains may owe capital-gains tax (a 1031 exchange can defer both). Figures are a year-1 estimate at your 24.0% rate — not tax advice; consult a CPA.
Schools (NCES district)
- District
- Baltimore City Public Schools
- NCES district ID
- 2400090
- Math proficiency
- 7% ▼ -9.00%
- Reading proficiency
- 16% ▼ -5.00%
- Median HH income
- $42,108
- Composite
- 10.08/100
- National rank
- #9805
- State rank
- #24 of 24 in MD
Livability — Baltimore
- Score
- 76/100
- State rank
- #90
- US rank
- #3396
Category grades
Schools grade is shown separately in the Schools card above.
Census & demographics
- Census place
- Baltimore, MD
- County
- Baltimore City · 558,601 people
- City population
- 588,727
- Metro
- Baltimore-Columbia-Towson, MD
- Population (ZIP)
- 46,679
- Household income
- $60,047
- Rent vs Own
- Severe rent burden
- 2776.0
Population outlook (Baltimore County) Hauer SSP2
- Today (2025)
- 624,249 people
- By 2030
- 621,541 · -0.4%
- By 2040
- 609,756 · -2.3%
- By 2050
- 597,249 · -4.3%
- By 2075
- 552,236 · -11.5%
- By 2100
- 513,934 · -17.7%
Race, ethnicity, and origin ACS 2023
- Neighborhood character
- Predominantly Black (73%)
- Race & ethnicity
- Black 73% White 15% Hispanic / Latino 6% Two or more races 4% Asian 3%
- Hispanic origin (detail)
- Common ancestry
- Lithuanian 1% Romanian 1% Serbian 1%
- Foreign-born
- 5% · Canada, Philippines
- Languages at home
- 91% English-only · Spanish 4% Other Indo-European 2% Other Asian/Pacific 1%
Political lean MEDSL · Baltimore
- 2024 margin
- Solid D (+73.0) · D 85.2% · R 12.2% · Other 2.6%
- 2008→2024 swing
- -2.5pp toward R · 2008: 75.5pp · 2024: 73.0pp
- All cycles
- 2024: D+73.0 2020: D+76.6 2016: D+74.6 2012: D+76.4 2008: D+75.5
Not yet ingested
- Civics
- —
Market trends
- HPI YoY
- ▼ -259.07%
- Current HPI
- 226.896
- Rent YoY
- ▲ 5.38%
- Metro
- Baltimore-Columbia-Towson, MD
- State GDP YoY
- ▲ 2.97%
- F500 in state
- 12
Industry mix (Fortune 500 HQ in MD)
| Industry | F500 HQs | Revenue |
|---|---|---|
| Aerospace / Defense | 1 | $71B |
|
||
| Utilities | 1 | $25B |
|
||
| Hotels | 1 | $24B |
|
||
| Consumer Goods | 1 | $7B |
|
||
| Real Estate | 1 | $6B |
|
||
| Chemicals | 1 | $2B |
|
||
Price history
+475.9% since first listed21 events — show timeline
- 2026-03-03 Listed $159,540 BRIGHT MLS
- 2026-02-28 Coming Soon $159,540 BRIGHT MLS
- 2015-11-01 Listing Removed — BRIGHT MLS
- 2015-11-01 Delisted — MRIS
- 2015-07-01 Listed — MRIS
- 2015-07-01 Listed $49,900 BRIGHT MLS
- 2015-05-01 Delisted — MRIS
- 2015-05-01 Listing Removed — BRIGHT MLS
- 2015-04-20 Price Changed — MRIS
- 2015-03-10 Price Changed — MRIS
- 2015-03-01 Price Changed — MRIS
- 2015-01-04 Price Changed — MRIS
- 2014-12-12 Price Changed — MRIS
- 2014-11-05 Listed — MRIS
- 2014-11-04 Listed $49,000 BRIGHT MLS
- 2007-04-09 Sold (Public Records) $127,000 Public Records
- 2006-08-11 Sold (MLS) $127,000 MRIS
- 2006-06-26 Delisted — MRIS
- 2006-04-27 Listed $127,000 MRIS
- 2005-12-07 Sold (Public Records) $55,000 Public Records
- 1995-04-05 Sold (Public Records) $27,705 Public Records
Property tax history
-1.3%/yrLatest (2025): $1,752 · +5.1% YoY. Source: county tax records.
Cash-flow waterfall
monthlySold comps — $/sqft
last 12 mo · ≤1 miLoading sold comps…