 Multi-family
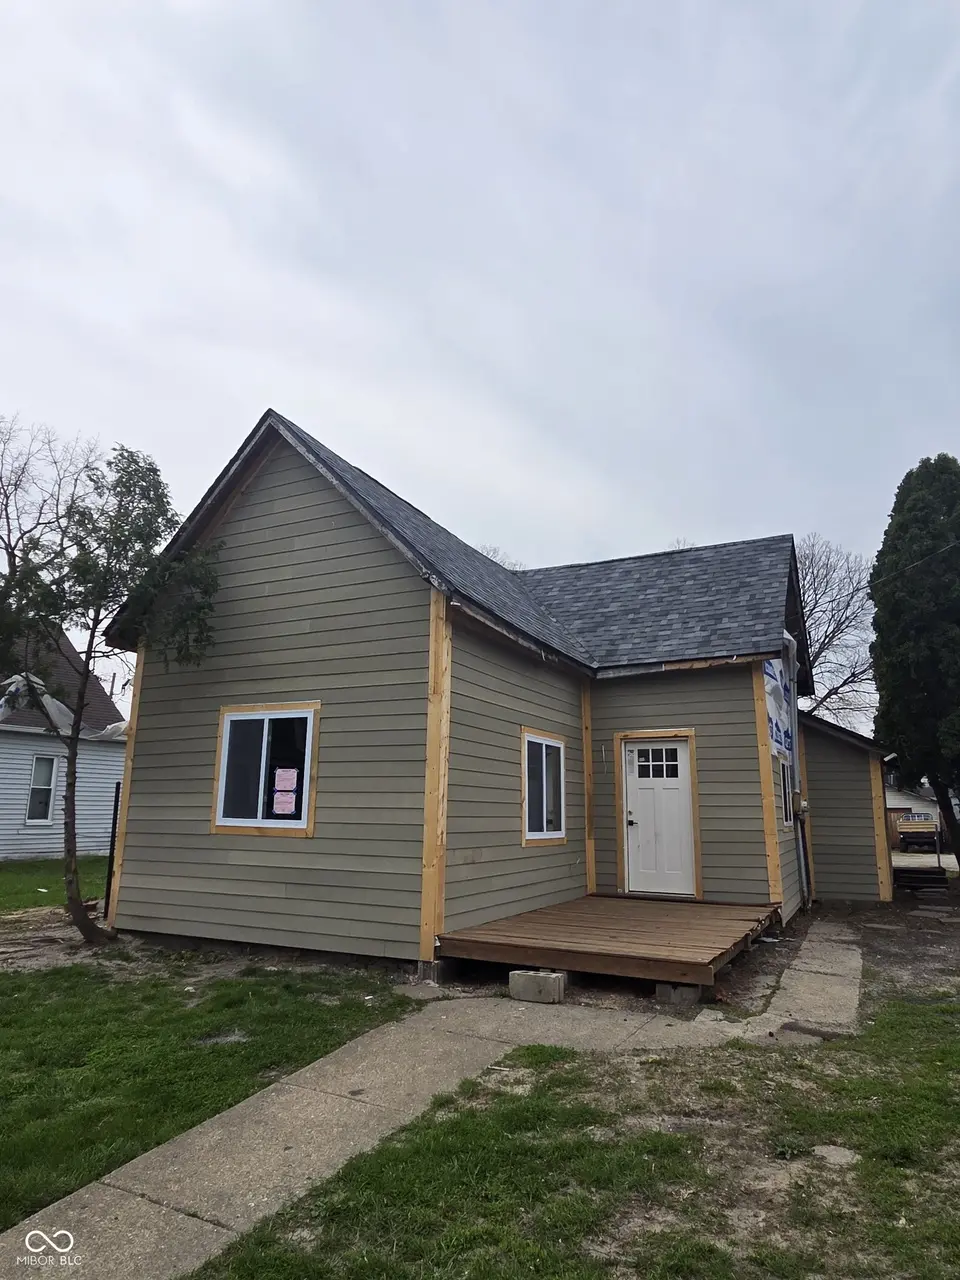
1016 Dawson St · Indianapolis city (balance), IN
Flood risk 1/10 · Minimal
- FEMA flood zone
- X (unshaded)
- Chance of flooding over 30 yrs
- 0.0%
- Est. flood insurance / yr
- $507 – $1,088
Fire risk 1/10 · Minimal
- Est. fire insurance / yr
- $717 – $1,331
Heat risk 4/10 · Minor
- Hot days now (above 101°F)
- 7 days/yr
- Hot days in 30 yrs
- 19 days/yr
Wind risk 2/10 · Minimal
- Chance of severe wind over 30 yrs
- 1.0%
Air-quality risk 4/10 · Minor
- Unhealthy air days now
- 5 days/yr
- Unhealthy air days in 30 yrs
- 7 days/yr
Risk factors via First Street. Map © Google.
Why this score? — see what drove the C+ grade
The composite is a weighted blend of 9 inputs, each scored 0–100. Each bar is that input's sub-score; the figure is the points it added to the 100-point composite (weight × sub-score).
- Cash flow +21.9/30.0
- ARV discount +15.0/15.0
- DSCR +7.0/10.0
- 1% rule +5.6/10.0
- Condition / age +4.8/5.0
- Rent growth +3.2/5.0
- Livability +2.5/5.0
- Schools +1.4/10.0
- Appreciation +0.0/10.0
$154,900
🖨 Deal sheet 📄 Offer letter ✓ Due diligence
Multi-family units
County records classify this as Multi-Family (2-4 Unit). Listing-text estimate: 1 unit. estimate disagrees with records
Listing remarks MLS
**INVESTOR FLIP POTENTIAL** Take advantage of extra strong values in this Fountain Square fixer. You can continue what was started to realize potential gains or renovate for cash flows. Unlimited potential due to location and neighboring homes. Bring your contractor with you as current condition is in framing stage. There is room to build a garage for even higher values in this area. New owner will need to apply for permits through Marion County.
Key facts
- Apply for permits
- Room to build garage
- 3,180 sq ft lot
Tags
Neighborhood map
What this means for you Summary
Snapshot
- This is a 3-bed/2.0-bath multifamily listed at $155k. Condition is rated excellent.
Deal economics
- At list price, monthly cash flow is $244 ($3k/yr) — positive.
- The deal already cash-flows at list — no discount required.
- Meets the 1% rule at list price ($2k rent vs $155k).
- Recommended offer: $136k (12.0% below list) — sets the bar for market timing.
- Cap rate 8.2% vs local median 4.4% in Indianapolis city (balance) — top-decile yield for the area; either an underpriced asset or a hidden risk that comps aren't pricing in. Stress-test before assuming the spread holds.
Location & tenants
- Location reads: area grade C — affects rentability + tenant quality, not the cash-flow math above.
- Indianapolis Public Schools (urban): math 14% / reading 20% proficiency, ranked #286 of 301 in IN (top 95%) — low school quality limits family demand, transient renter base, plan for 1-2y turnover; 77% free/reduced lunch — lower-income household profile, screen leases tightly.
- Market conditions: Rents rising (+2.9%/yr); 493 active listings in the ZIP; 40 comparable units currently listed for rent nearby; rentals at typical pace (median 24d on market — plan ~3-4 weeks tenant-placement turnaround); 42% of comp listings sitting > 30 days — soft ceiling on asking rent; 1,906 units permitted in Marion County in 2024 (621 in 5+ unit buildings).
- This rent runs 34% of the median local income ($57k/yr) — at the standard rent-burdened threshold; future hikes will face affordability resistance.
Forward outlook
- Local home prices are declining (-3.0%/yr); year-one equity from $1k of loan paydown is wiped out by about $5k of value loss. Plan a longer hold.
- Marion County population projected at +18% by 2050 — long-run rental-demand tailwind backs the buy-and-hold thesis.
Negotiation context
- It's been on market 423 days — a 12% lower offer ($136k) is reasonable based on typical stale-listing flexibility.
- 2 sale attempts since 2y ago; this cycle's ask has dropped $45k (23%) from the opening price — seller is motivated, your offer sets the floor, not the list.
Risks & watch-outs
- Watch-outs: built in 1900 — expect roof / HVAC / electrical / plumbing capex.
Questions for the listing agent
- It's been on market 423 days. Have you received any prior offers? Is the seller open to a 12% concession, seller financing, or rate buy-down credit?
- Built in 1900 — when were the roof, HVAC, electrical panel, plumbing, and water heater last replaced?
- Why hasn't it sold? Are there any deal-killer items the seller is aware of (foundation, flood, title, zoning, code violations)?
- Is there a deadline driving the sale (1031 exchange, divorce, estate, relocation)? That informs how much negotiation room exists.
- What's the average days-on-market for RENTAL listings here right now (not sales)? A rising rental-DOM trend means longer vacancies and softer asking-rent achievability than the comps imply.
- What's the recent tenant-quality profile in this submarket — average credit score on applications, eviction rate, late-payment / NSF rate, and stable-employment percentage? A property-management company in the area should have these aggregated.
- How much new apartment / multifamily construction is in the pipeline within 1–3 miles? Heavy new supply (>2% of stock underway) typically softens rents 12–24 months out; light construction supports rent growth.
Investment metrics
- 1% rule
- 1.06% ✓
- Cap rate
- 8.19%
- Cash-on-cash
- 6.76%
- DSCR
- 1.30
- GRM
- 7.8
CMA / ARV
- ARV (median comp)
- $227,308
- List price
- $154,900
- Delta
- -31.85%
- Verdict
- UNDERPRICED
- Comps
- 20 within 1.0 mi
Show comp detail 7 sales within ~0.75 mi
| Address | Dist | Beds/Ba | Sqft | Sold | Price | $/sf | Match |
|---|---|---|---|---|---|---|---|
| 421 Villa Ave | 0.47mi | 2/2.0 (-1) | 1,186 (+3%) | 0mo | $140,000 | $118 | 68 |
| 2109 Lexington Ave | 0.26mi | 2/2.0 (-1) | 1,067 (-8%) | 9mo | $170,000 | $159 | 62 |
| 422-424 Villa Ave | 0.47mi | 2/2.0 (-1) | 1,248 (+8%) | 2mo | $199,900 | $160 | 58 |
| 1727 S Randolph St | 0.66mi | 2/2.0 (-1) | 1,232 (+7%) | 5mo | $165,000 | $134 | 49 |
| 1916 E Maryland St | 0.75mi | 2/2.0 (-1) | 1,100 (-5%) | 7mo | $80,000 | $73 | 46 |
| 572 Trowbridge St | 0.58mi | 4/2.0 (+1) | 1,288 (+11%) | 19mo | $245,000 | $190 | 33 |
| 1712 E Maryland St | 0.74mi | 2/3.0 (-1) | 1,299 (+12%) | 4mo | $226,000 | $174 | 33 |
Match score weights: distance 35% · size 25% · config 20% · recency 20%. Top-matched comps best support the ARV.
Projected returns pro-forma
-3.0% appreciation · 2.88% rent growth · sell at horizon
- IRR
- -6.0%
- Equity multiple
- 0.78×
- Total profit
- $-9,725
- Equity at exit
- $23,096
- IRR
- 3.5%
- Equity multiple
- 1.25×
- Total profit
- $10,816
- Equity at exit
- $13,393
Cash invested: $43,372 (down + closing). Projections, not guarantees.
Landlord ↔ Tenant lean methodology
- Overall (STATE)
- 90 Strongly Landlord-Friendly
- State Indiana
- 90 Strongly Landlord-Friendly · R+11
- County
- — inherits STATE
- City
- — inherits STATE
ZIP-level market 46203
- Home prices YoY
- -26.7%
- Rents YoY
- 2.9%
- Active inventory
- 493
- Price-to-rent
- 7.8×
Monthly cashflow live
- Estimated rent
- $1,646 high interval (Pro) →
- Mortgage (P&I)
- −$812
- Tax from tax record
- −$179 /mo · $2,149/yr
- Insurance
- −$65
- HOA
- −$0
- Vacancy / Maint / Mgmt
- −$346
- Net cashflow
- $244
Break-even live
UW: 25.0% down · 7.5% · 30yr · 1.5% tax · 5.0% vac · 8.0% maint · 8.0% mgmt
Financing live
Cash to close
- Down payment
- $38,725
- Closing costs
- $4,647
- Reserves months
- —
- Total cash needed
- —
Loan-product check · same deal, 3 products live
Conventional
25% down · 7.5% · 30yr
- Down + closing
- —
- Monthly P&I
- —
- Monthly cashflow
- —
- DSCR
- —
- Eligible?
- —
Personal DTI + credit; lowest rate.
DSCR
20% down · 8.5% · 30yr
- Down + closing
- —
- Monthly P&I
- —
- Monthly cashflow
- —
- DSCR
- —
- Eligible?
- —
No personal income docs; deal must DSCR.
Hard money
10% down · 12.0% · 12mo
- Down + closing
- —
- Monthly P&I
- —
- Monthly cashflow
- —
- DSCR
- —
- Eligible?
- —
Short-term bridge; refi at stabilization.
Rent comps 40 comps
| Address | Beds | Baths | Sqft | Rent | $/sqft | DOM | Units | Dist |
|---|---|---|---|---|---|---|---|---|
| 1053 Villa Ave Indianapolis, IN | 3.0 | 1.5 | 1281 | $1,400 | $1.09 | 44d | 1 | 0.18mi |
| 1502 Woodlawn Ave Indianapolis, IN | 2.0 | 2.0 | 1441 | $2,500 | $1.73 | 15d | 1 | 0.19mi |
| 1527 Prospect St Indianapolis, IN | 3.0 | 1.5 | 1150 | $1,200 | $1.04 | 24d | 1 | 0.20mi |
| 1011 Harlan St Indianapolis, IN | 2.0 | 2.0 | 1008 | $1,525 | $1.51 | 44d | 1 | 0.23mi |
| 1013 Harlan St Indianapolis, IN | 2.0 | 1.0 | 1008 | $1,475 | $1.46 | 44d | 1 | 0.23mi |
| 2116 Woodlawn Ave Indianapolis, IN | 2.0 | 2.0 | 1054 | $1,175 | $1.11 | 8d | 1 | 0.24mi |
| 1441 Prospect St Indianapolis, IN | 2.0 | 1.0–2.0 | 2840 | $2,000 | $0.70 | 2d | 13 | 0.26mi |
| 2218 Pleasant St Indianapolis, IN | 3.0 | 2.0 | 1376 | $2,499 | $1.82 | 24d | 1 | 0.33mi |
| 2230 Woodlawn Ave Indianapolis, IN | 2.0 | 1.0 | 924 | $1,350 | $1.46 | 44d | 1 | 0.33mi |
| 1449 Fletcher Ave Indianapolis, IN | 2.0 | 2.0 | 1000 | $2,000 | $2.00 | 18d | 1 | 0.34mi |
| 1123 Churchman Ave Indianapolis, IN | 3.0 | 1.5 | 1472 | $1,360 | $0.92 | 14d | 1 | 0.35mi |
| 518 S State Ave Indianapolis, IN | 2.0 | 1.0 | 900 | $725 | $0.81 | 44d | 1 | 0.36mi |
| 512 S State Ave Unit 512 State 120% AMI Indianapolis, IN | 3.0 | 1.0 | 1200 | $1,400 | $1.17 | 24d | 1 | 0.37mi |
| 1224 Prospect St Indianapolis, IN | 2.0 | 1.0–2.0 | 691 | $2,235 | $3.23 | 2d | 8 | 0.40mi |
| 909 Saint Peter St Indianapolis, IN | 3.0 | 2.0 | 1200 | $1,800 | $1.50 | 44d | 1 | 0.42mi |
| 1512 English Ave Indianapolis, IN | 3.0 | 2.0 | 1416 | $1,650 | $1.17 | 4d | 1 | 0.45mi |
| 1503 Dawson St Indianapolis, IN | 2.0 | 1.0 | 700 | $1,200 | $1.71 | 44d | 1 | 0.46mi |
| 420 Harlan St Indianapolis, IN | 2.0 | 2.0 | 1260 | $1,500 | $1.19 | 24d | 1 | 0.47mi |
| 420 Hamilton Ave Unit B Indianapolis, IN | 3.0 | 2.0 | 1350 | $1,450 | $1.07 | 11d | 1 | 0.50mi |
| 420 Hamilton Ave Unit A Indianapolis, IN | 3.0 | 2.0 | 1350 | $1,550 | $1.15 | 44d | 1 | 0.50mi |
| 1534 Dawson St Indianapolis, IN | 3.0 | 1.0 | 1040 | $1,499 | $1.44 | 24d | 1 | 0.51mi |
| 2320 Spann Ave Indianapolis, IN | 2.0 | 2.0 | 1219 | $1,795 | $1.47 | 16d | 1 | 0.51mi |
| 1148 Fletcher Ave Indianapolis, IN | 2.0 | 1.0 | 900 | $1,800 | $2.00 | 18d | 1 | 0.53mi |
| 1620 E Palmer St Indianapolis, IN | 2.0 | 1.0 | 824 | $1,200 | $1.46 | 24d | 1 | 0.53mi |
| 1543 S State Ave Indianapolis, IN | 2.0 | 1.0 | 1086 | $1,100 | $1.01 | 8d | 1 | 0.53mi |
| 1602 Quill St Unit B Indianapolis, IN | 3.0 | 2.0 | 1250 | $1,650 | $1.32 | 15d | 1 | 0.55mi |
| 1602 Quill St Unit B Indianapolis, IN | 3.0 | 2.0 | 1250 | $1,750 | $1.40 | 44d | 1 | 0.55mi |
| 247 S Randolph St Indianapolis, IN | 2.0 | 1.0 | 720 | $750 | $1.04 | 44d | 1 | 0.57mi |
| 1140 Shelby St Apt 515 Indianapolis, IN | 2.0 | 2.0 | 1181 | $2,090 | $1.77 | 24d | 1 | 0.57mi |
| 245 S Randolph St Indianapolis, IN | 2.0 | 1.0 | 720 | $750 | $1.04 | 44d | 1 | 0.57mi |
| 1637 S State Ave Indianapolis, IN | 2.0 | 1.5 | 816 | $900 | $1.10 | 18d | 1 | 0.59mi |
| 1012 Prospect St Unit 1527 Indianapolis, IN | 3.0 | 1.5 | 1150 | $1,200 | $1.04 | 44d | 1 | 0.61mi |
| 1012 Prospect St Unit 512 State 120% AMI Indianapolis, IN | 3.0 | 1.0 | 1200 | $1,400 | $1.17 | 44d | 1 | 0.61mi |
| 1012 Prospect St Unit 907 Prospect NO AMI Indianapolis, IN | 3.0 | 1.5 | 1121 | $1,400 | $1.25 | 44d | 1 | 0.61mi |
| 2015 Southeastern Ave Unit 2015 Indianapolis, IN | 2.0 | 2.5 | 1350 | $2,200 | $1.63 | 24d | 1 | 0.62mi |
| 225 Hamilton Ave Indianapolis, IN | 2.0 | 2.0 | 1008 | $1,695 | $1.68 | 44d | 1 | 0.63mi |
| 1035 Sanders St Unit 163 Indianapolis, IN | 2.0 | 1.0 | 1481 | $1,921 | $1.30 | 44d | 1 | 0.64mi |
| 1045 Orange St Indianapolis, IN | 2.0 | 1.0 | 1232 | $2,200 | $1.79 | 44d | 1 | 0.66mi |
| 1045 Orange St Indianapolis, IN | 2.0 | 1.0 | 1232 | $2,000 | $1.62 | 24d | 1 | 0.66mi |
| 931 Fletcher Ave Indianapolis, IN | 2.0–3.0 | 1.0–2.5 | 1094 | $2,765 | $2.53 | 2d | 4 | 0.68mi |
Listing history 27 events
-
2026-06-18days on market $154,900 Active 423 DOM
-
2026-06-17days on market $154,900 Active 422 DOM
-
2026-06-16days on market $154,900 Active 421 DOM
-
2026-06-15days on market $154,900 Active 420 DOM
-
2026-06-13days on market $154,900 Active 418 DOM
-
2026-06-13days on market $154,900 Active 417 DOM
-
2026-06-09days on market $154,900 Active 414 DOM
-
2026-06-08days on market $154,900 Active 413 DOM
-
2026-06-07days on market $154,900 Active 412 DOM
-
2026-06-03pricedays on market $154,900 Active 408 DOM
-
2026-06-02days on market $159,900 Active 407 DOM
-
2026-06-01days on market $159,900 Active 406 DOM
-
2026-05-31days on market $159,900 Active 405 DOM
-
2026-05-01price $159,900 450-char remark
Show marketing remark (450 chars)
**INVESTOR FLIP POTENTIAL** Take advantage of extra strong values in this Fountain Square fixer. You can continue what was started to realize potential gains or renovate for cash flows. Unlimited potential due to location and neighboring homes. Bring your contractor with you as current condition is in framing stage. There is room to build a garage for even higher values in this area. New owner will need to apply for permits through Marion County.
-
2026-03-31price $164,900 450-char remark
Show marketing remark (450 chars)
**INVESTOR FLIP POTENTIAL** Take advantage of extra strong values in this Fountain Square fixer. You can continue what was started to realize potential gains or renovate for cash flows. Unlimited potential due to location and neighboring homes. Bring your contractor with you as current condition is in framing stage. There is room to build a garage for even higher values in this area. New owner will need to apply for permits through Marion County.
-
2026-02-12price $169,900 450-char remark
Show marketing remark (450 chars)
**INVESTOR FLIP POTENTIAL** Take advantage of extra strong values in this Fountain Square fixer. You can continue what was started to realize potential gains or renovate for cash flows. Unlimited potential due to location and neighboring homes. Bring your contractor with you as current condition is in framing stage. There is room to build a garage for even higher values in this area. New owner will need to apply for permits through Marion County.
-
2026-01-05price $172,400 450-char remark
Show marketing remark (450 chars)
**INVESTOR FLIP POTENTIAL** Take advantage of extra strong values in this Fountain Square fixer. You can continue what was started to realize potential gains or renovate for cash flows. Unlimited potential due to location and neighboring homes. Bring your contractor with you as current condition is in framing stage. There is room to build a garage for even higher values in this area. New owner will need to apply for permits through Marion County.
-
2025-12-01price $174,900 450-char remark
Show marketing remark (450 chars)
**INVESTOR FLIP POTENTIAL** Take advantage of extra strong values in this Fountain Square fixer. You can continue what was started to realize potential gains or renovate for cash flows. Unlimited potential due to location and neighboring homes. Bring your contractor with you as current condition is in framing stage. There is room to build a garage for even higher values in this area. New owner will need to apply for permits through Marion County.
-
2025-10-28price $177,400 450-char remark
Show marketing remark (450 chars)
**INVESTOR FLIP POTENTIAL** Take advantage of extra strong values in this Fountain Square fixer. You can continue what was started to realize potential gains or renovate for cash flows. Unlimited potential due to location and neighboring homes. Bring your contractor with you as current condition is in framing stage. There is room to build a garage for even higher values in this area. New owner will need to apply for permits through Marion County.
-
2025-08-24price $179,900 450-char remark
Show marketing remark (450 chars)
**INVESTOR FLIP POTENTIAL** Take advantage of extra strong values in this Fountain Square fixer. You can continue what was started to realize potential gains or renovate for cash flows. Unlimited potential due to location and neighboring homes. Bring your contractor with you as current condition is in framing stage. There is room to build a garage for even higher values in this area. New owner will need to apply for permits through Marion County.
-
2025-07-22price $184,900 450-char remark
Show marketing remark (450 chars)
**INVESTOR FLIP POTENTIAL** Take advantage of extra strong values in this Fountain Square fixer. You can continue what was started to realize potential gains or renovate for cash flows. Unlimited potential due to location and neighboring homes. Bring your contractor with you as current condition is in framing stage. There is room to build a garage for even higher values in this area. New owner will need to apply for permits through Marion County.
-
2025-06-19price $194,900 450-char remark
Show marketing remark (450 chars)
**INVESTOR FLIP POTENTIAL** Take advantage of extra strong values in this Fountain Square fixer. You can continue what was started to realize potential gains or renovate for cash flows. Unlimited potential due to location and neighboring homes. Bring your contractor with you as current condition is in framing stage. There is room to build a garage for even higher values in this area. New owner will need to apply for permits through Marion County.
-
2025-04-21$199,900 Active 450-char remark
Show marketing remark (450 chars)
**INVESTOR FLIP POTENTIAL** Take advantage of extra strong values in this Fountain Square fixer. You can continue what was started to realize potential gains or renovate for cash flows. Unlimited potential due to location and neighboring homes. Bring your contractor with you as current condition is in framing stage. There is room to build a garage for even higher values in this area. New owner will need to apply for permits through Marion County.
-
2024-07-16status Pending
-
2024-07-15historical
-
2024-06-13price $195,000
-
2024-05-07$209,900 Active
ⓘ Source: listings_history table (triggers on properties + properties_extension) + one-shot
backfill from property_details.listing_events for pre-trigger history.
Tax reassessment forecast IN · Partial reset (capped growth)
- Current annual tax
- $2,149 · $179/mo
- Projected year-2 tax
- $2,149 · $179/mo
- Expected delta
- $0/yr ($0/mo · 0.0%)
ⓘ Screening estimate from a state-policy table — verify with the county assessor before closing.
Climate risk First Street
- Flood 1/10 Low FEMA zone X (unshaded) · 0% chance over 30 yrs
- Wildfire 1/10 Low
- Heat 4/10 Moderate 7 d/yr ≥101°F today · 19 d/yr by 30 yrs out
- Wind 2/10 Low 100% chance of damaging wind over 30 yrs
- Air quality 4/10 Moderate 5 unhealthy d/yr today · 7 by 30 yrs out
Nearby sold comps map
Loading sold comps map…
Walkable amenities ~0.75 mi
Loading nearby amenities…
Taxation est. · year 1
- Rental income
- $19,750
- − Mortgage interest
- −$8,677
- − Property taxes
- −$2,149
- − Insurance
- −$774
- − Repairs & maintenance
- −$1,580
- − Management
- −$1,580
- − Depreciation
- −$4,506
- Taxable income
- $483
- Est. tax owed @ 24.0%
- −$116
- After-tax cash flow
- $2,815/yr
For passive investors: Depreciation is non-cash, so a rental often shows a tax loss while cash-flowing — sheltering income. Rental losses are passive: they offset passive income freely, and up to $25,000/yr can offset ordinary (W-2) income if you actively participate and your MAGI is under $100k (phasing out to $0 by $150k); unused losses carry forward. On sale, claimed depreciation is recaptured at up to 25%, and gains may owe capital-gains tax (a 1031 exchange can defer both). Figures are a year-1 estimate at your 24.0% rate — not tax advice; consult a CPA.
Condition & rehab AI · 13 photos
This property is in excellent condition with a good exterior and interior framing. It is ready for painting and flooring to be completed for a move-in-ready state.
Value-add opportunities
- Both Paint the interior walls and trim — Painting the interior will enhance the appearance and make the space more inviting for both buyers and renters.
- Both Install flooring — Installing flooring will complete the interior and make the space move-in ready for both buyers and renters.
Renovation cost estimate screening
Value-add ROI direction
- Both Paint the interior walls and trim — Painting the interior will enhance the appearance and make the space more inviting for both buyers and renters. ↑
- Both Install flooring — Installing flooring will complete the interior and make the space move-in ready for both buyers and renters. ↑
ⓘ Cost ranges are severity-bucket heuristics (US national rule-of-thumb). Get contractor quotes + a written scope before underwriting a rehab budget.
Schools (NCES district)
- District
- Indianapolis Public Schools
- NCES district ID
- 1804770
- Math proficiency
- 14% ▼ -7.00%
- Reading proficiency
- 20% ▼ -3.00%
- Median HH income
- $32,034
- Composite
- 13.69/100
- National rank
- #9499
- State rank
- #286 of 301 in IN
Livability — Indianapolis city (balance)
No livability data for this city. (Only ~50 U.S. cities are tracked.)
Census & demographics
- Census place
- Indianapolis city (balance), IN
- County
- Marion County · 998,460 people
- City population
- 881,119
- Metro
- Indianapolis-Carmel-Anderson, IN
- Population (ZIP)
- 37,758
- Household income
- $57,393
- Rent vs Own
- Severe rent burden
- 1499.0
Population outlook (Marion County) Hauer SSP2
- Today (2025)
- 1,025,572 people
- By 2030
- 1,065,727 · +3.9%
- By 2040
- 1,141,577 · +11.3%
- By 2050
- 1,208,920 · +17.9%
- By 2075
- 1,367,288 · +33.3%
- By 2100
- 1,438,201 · +40.2%
Race, ethnicity, and origin ACS 2023
- Neighborhood character
- Predominantly White (69%)
- Race & ethnicity
- White 69% Hispanic / Latino 14% Black 12% Two or more races 8% Asian 2% Native American 1%
- Hispanic origin (detail)
- Mexican 12% Puerto Rican 1%
- Common ancestry
- Slovak 2% Lithuanian 2% Italian 1%
- Foreign-born
- 8% · Canada
- Languages at home
- 88% English-only · Spanish 10% Other Indo-European 1%
Political lean MEDSL · Marion
- 2024 margin
- Strong D (+27.7) · D 63.0% · R 35.3% · Other 1.7%
- 2008→2024 swing
- -0.7pp no change · 2008: 28.4pp · 2024: 27.7pp
- All cycles
- 2024: D+27.7 2020: D+29.1 2016: D+22.8 2012: D+22.2 2008: D+28.4
Not yet ingested
- Civics
- —
Market trends
- HPI YoY
- ▼ -127.37%
- Current HPI
- 349.579
- Rent YoY
- ▲ 2.88%
- Metro
- Indianapolis-Carmel-Anderson, IN
- State GDP YoY
- ▲ 2.90%
- F500 in state
- 18
Industry mix (Fortune 500 HQ in IN)
| Industry | F500 HQs | Revenue |
|---|---|---|
| Industrial Machinery | 2 | $37B |
|
||
| Healthcare | 1 | $177B |
|
||
| Pharmaceuticals | 1 | $45B |
|
||
| Metals / Steel | 1 | $18B |
|
||
| Agriculture | 1 | $17B |
|
||
| Packaging | 1 | $12B |
|
||
Price history
-23.8% since first listed14 events — show timeline
- 2026-05-01 Price Changed $159,900 MIBOR as Distributed by MLS Grid
- 2026-03-31 Price Changed $164,900 MIBOR as Distributed by MLS Grid
- 2026-02-12 Price Changed $169,900 MIBOR as Distributed by MLS Grid
- 2026-01-05 Price Changed $172,400 MIBOR as Distributed by MLS Grid
- 2025-12-01 Price Changed $174,900 MIBOR as Distributed by MLS Grid
- 2025-10-28 Price Changed $177,400 MIBOR as Distributed by MLS Grid
- 2025-08-24 Price Changed $179,900 MIBOR as Distributed by MLS Grid
- 2025-07-22 Price Changed $184,900 MIBOR as Distributed by MLS Grid
- 2025-06-19 Price Changed $194,900 MIBOR as Distributed by MLS Grid
- 2025-04-21 Listed $199,900 MIBOR as Distributed by MLS Grid
- 2024-07-16 Pending — MIBOR as Distributed by MLS Grid
- 2024-07-15 Listing Removed — MIBOR as Distributed by MLS Grid
- 2024-06-13 Price Changed $195,000 MIBOR as Distributed by MLS Grid
- 2024-05-07 Listed $209,900 MIBOR as Distributed by MLS Grid
Property tax history
+7.8%/yrLatest (2025): $2,149 · +7.8% YoY. Source: county tax records.
Cash-flow waterfall
monthlySold comps — $/sqft
last 12 mo · ≤1 miLoading sold comps…