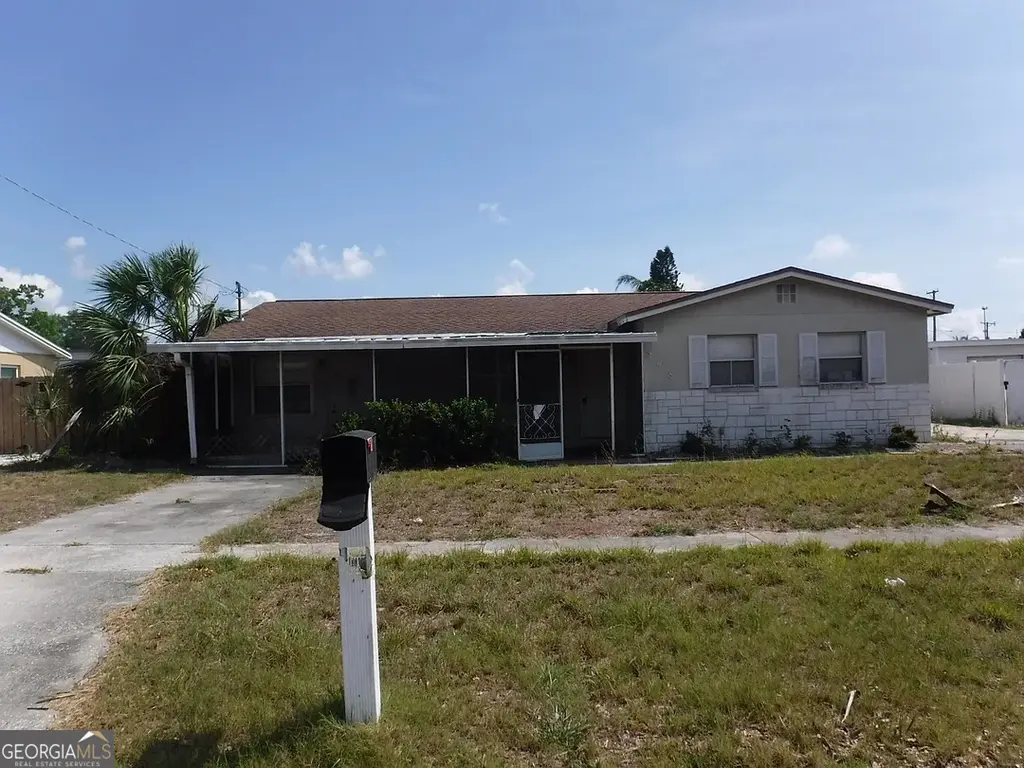
548 Frandor Pl · Apollo Beach, FL
Flood risk 9/10 · Severe
- FEMA flood zone
- AE
- Chance of flooding over 30 yrs
- 0.99%
- Est. flood insurance / yr
- $1,737 – $8,500
Fire risk 4/10 · Minor
- Est. fire insurance / yr
- $947 – $1,759
Heat risk 10/10 · Severe
- Hot days now (above 107°F)
- 7 days/yr
- Hot days in 30 yrs
- 28 days/yr
Wind risk 9/10 · Severe
- Chance of severe wind over 30 yrs
- 99.0%
Air-quality risk 3/10 · Minor
- Unhealthy air days now
- 3 days/yr
- Unhealthy air days in 30 yrs
- 4 days/yr
Risk factors via First Street. Map © Google.
Why this score? — see what drove the B- grade
The composite is a weighted blend of 9 inputs, each scored 0–100. Each bar is that input's sub-score; the figure is the points it added to the 100-point composite (weight × sub-score).
- Cash flow +29.2/30.0
- DSCR +10.0/10.0
- ARV discount +7.5/15.0
- 1% rule +7.3/10.0
- Schools +4.2/10.0
- Livability +3.6/5.0
- Rent growth +3.3/5.0
- Condition / age +2.5/5.0
- Appreciation +0.0/10.0
$219,900
🖨 Deal sheet 📄 Offer letter ✓ Due diligence
Listing remarks MLS
Excellent buy on 4BR/2BA pool home within walking or bike riding distance of elementary school and county recreation. 2 Screen porches, large fenced & private backyard, 2 driveways, lots of storage. Newer roof; CHA , water heater, bathrooms, & tile floors. Shed/Workshop!
Key facts
- 7,500 sq ft lot
- Pool
- Built 1968
Property features AI
Finance
- Other: Lot about 0.17 acre (approx. 75 x 100); Zoned RSC-6; Property listed as fixer; Unfurnished
- HOA & community: No HOA/association indicated
Exterior
- Parking: Driveway
- Utilities: Public water; Public sewer; Water and sewer connected
- Home design: Single-family residence; Residential property; One story; Faces north; Fixer condition
- Construction: Stone and stucco construction; Shingle roof; Built on slab foundation
- Exterior features: Patio; In-ground private pool; Asphalt road access
Interior
- Kitchen: No appliances included
- Bedrooms: 4 bedrooms
- Flooring: Other flooring
- Bathrooms: 2 full bathrooms
- Heating & cooling: Central heating; Central air conditioning
- Interior features: Open floor plan
- Laundry & utility: Washer hookup; Electric dryer hookup; Slab foundation (utility access at slab)
Neighborhood map
What this means for you Summary
Snapshot
- This is a 4-bed/2.0-bath single-family listed at $220k.
Deal economics
- At list price, monthly cash flow is $338 ($4k/yr) — positive.
- The deal already cash-flows at list — no discount required.
- Meets the 1% rule at list price ($3k rent vs $220k).
Location & tenants
- Location reads 72/100 on livability (#333 in FL) — a middle-class / working-renter tenant base. Strengths: crime A+, employment A+, housing A+; Watch: cost of living C-, amenities F, health & safety F.
- Hillsborough (suburban): math 47% / reading 50% proficiency, ranked #41 of 73 in FL (top 56%) — families likely to look elsewhere, expect single-tenant / working-renter base with shorter leases.
- Market conditions: Rents rising (+3.4%/yr); 761 active listings in the ZIP; 16 comparable units currently listed for rent nearby; rentals at typical pace (median 24d on market — plan ~3-4 weeks tenant-placement turnaround); high-income renter base; 9,053 units permitted in Hillsborough County in 2024 (4,555 in 5+ unit buildings).
Forward outlook
- Local home prices are declining (-3.0%/yr); year-one equity from $2k of loan paydown is wiped out by about $7k of value loss. Plan a longer hold.
- Hillsborough County population projected at +37% by 2050 — long-run rental-demand tailwind backs the buy-and-hold thesis.
Negotiation context
- Only 7 days on market — expect competitive offers; lowballing is unlikely to land.
- 2 sale attempts since 17y ago with the ask held roughly flat each time — persistent listings suggest the price (not the market) is what's stuck; bring a comps-based counter.
- Current owner paid $110k; list at $220k implies a 100% gain — meaningful room to come down on a strong offer.
Risks & watch-outs
- Watch-outs: flood insurance adds $427/mo.
- Climate carrying-cost: in FEMA flood zone AE (mandatory federal flood insurance); severe wind risk, 99% chance of damaging wind over 30y; extreme-heat days projected 7→28/yr by 2055 (HVAC capex compounding) — expect insurance premiums to compound above CPI over the hold.
Questions for the listing agent
- Built in 1968 — when were the roof, HVAC, electrical panel, plumbing, and water heater last replaced?
- What's the actual annual flood-insurance premium (NFIP or private), and is the property in a SFHA with mandatory coverage?
- Is there a deadline driving the sale (1031 exchange, divorce, estate, relocation)? That informs how much negotiation room exists.
- Schools are B-rated — typically a magnet for longer-tenancy family renters. What's the average tenant stay here, and is there a school-zone premium baked into asking?
- What's the average days-on-market for RENTAL listings here right now (not sales)? A rising rental-DOM trend means longer vacancies and softer asking-rent achievability than the comps imply.
- What's the recent tenant-quality profile in this submarket — average credit score on applications, eviction rate, late-payment / NSF rate, and stable-employment percentage? A property-management company in the area should have these aggregated.
- How much new for-sale + rental construction is in the pipeline within 1–3 miles? Heavy new supply typically softens prices + rents 12–24 months out; constrained supply supports both.
Investment metrics
- 1% rule
- 1.23% ✓
- Cap rate
- 10.46%
- Cash-on-cash
- 14.90%
- DSCR
- 1.66
- GRM
- 6.8
CMA / ARV
No comps found within radius.
Projected returns pro-forma
-3.0% appreciation · 3.36% rent growth · sell at horizon
- IRR
- -5.6%
- Equity multiple
- 0.79×
- Total profit
- $-12,925
- Equity at exit
- $32,788
- IRR
- 4.6%
- Equity multiple
- 1.35×
- Total profit
- $21,366
- Equity at exit
- $19,013
Cash invested: $61,572 (down + closing). Projections, not guarantees.
Landlord ↔ Tenant lean methodology
- Overall (STATE)
- 87 Strongly Landlord-Friendly
- State Florida
- 87 Strongly Landlord-Friendly · R+3
- County
- — inherits STATE
- City
- — inherits STATE
ZIP-level market 33572
- Rents YoY
- 3.4%
- Active inventory
- 761
- Price-to-rent
- 6.8×
Monthly cashflow live
- Estimated rent
- $2,702 high interval (Pro) →
- Mortgage (P&I)
- −$1,153
- Tax from tax record
- −$125 /mo · $1,502/yr
- Insurance
- −$92
- Flood insurance flood zone
- −$427 /mo · $5,118/yr
- HOA
- −$0
- Vacancy / Maint / Mgmt
- −$567
- Net cashflow
- $338
Break-even live
UW: 25.0% down · 7.5% · 30yr · 1.5% tax · 5.0% vac · 8.0% maint · 8.0% mgmt
Financing live
Cash to close
- Down payment
- $54,975
- Closing costs
- $6,597
- Reserves months
- —
- Total cash needed
- —
Loan-product check · same deal, 3 products live
Conventional
25% down · 7.5% · 30yr
- Down + closing
- —
- Monthly P&I
- —
- Monthly cashflow
- —
- DSCR
- —
- Eligible?
- —
Personal DTI + credit; lowest rate.
DSCR
20% down · 8.5% · 30yr
- Down + closing
- —
- Monthly P&I
- —
- Monthly cashflow
- —
- DSCR
- —
- Eligible?
- —
No personal income docs; deal must DSCR.
Hard money
10% down · 12.0% · 12mo
- Down + closing
- —
- Monthly P&I
- —
- Monthly cashflow
- —
- DSCR
- —
- Eligible?
- —
Short-term bridge; refi at stabilization.
Rent comps 16 comps
| Address | Beds | Baths | Sqft | Rent | $/sqft | DOM | Units | Dist |
|---|---|---|---|---|---|---|---|---|
| 529 Red Mangrove Ln Apollo Beach, FL | 3.0 | 2.0 | 1056 | $2,200 | $2.08 | 17d | 1 | 0.33mi |
| 6501 Manila Palm Way Apollo Beach, FL | 3.0 | 2.0 | 1651 | $2,350 | $1.42 | 24d | 1 | 0.40mi |
| 6516 Quiet Pool Ct Apollo Beach, FL | 3.0 | 2.5 | 1674 | $1,855 | $1.11 | 24d | 1 | 0.47mi |
| 6033 Flora Ter Apollo Beach, FL | 3.0 | 2.0 | 1428 | $1,895 | $1.33 | 24d | 1 | 0.54mi |
| 128 Lookout Dr Apollo Beach, FL | 3.0 | 2.0 | 1638 | $2,700 | $1.65 | 10d | 1 | 0.70mi |
| 206 Lookout Dr Apollo Beach, FL | 3.0 | 2.0 | 1282 | $2,045 | $1.60 | 3d | 1 | 0.72mi |
| 6316 Lake Sunrise Dr Apollo Beach, FL | 4.0 | 2.0 | 1809 | $3,300 | $1.82 | 24d | 1 | 0.83mi |
| 6316 Lake Sunrise Dr Apollo Beach, FL | 4.0 | 2.0 | 1809 | $3,200 | $1.77 | 14d | 1 | 0.83mi |
| 310 Mangrove Shade Cir Apollo Beach, FL | 3.0 | 2.5 | 1673 | $2,150 | $1.29 | 24d | 1 | 1.00mi |
| 299 Mangrove Shade Cir Apollo Beach, FL | 3.0 | 2.5 | 1802 | $2,150 | $1.19 | 10d | 1 | 1.01mi |
| 299 Mangrove Shade Cir Apollo Beach, FL | 3.0 | 2.5 | 1758 | $2,150 | $1.22 | 24d | 1 | 1.01mi |
| 6305 Cottonwood Ln Apollo Beach, FL | 3.0 | 2.0 | 1636 | $4,200 | $2.57 | 24d | 1 | 1.04mi |
| 910 Chipaway Dr Apollo Beach, FL | 3.0 | 2.0 | 1791 | $5,600 | $3.13 | 24d | 1 | 1.05mi |
| 6222 Camino Dr Apollo Beach, FL | 3.0 | 2.5 | 1617 | $2,400 | $1.48 | 5d | 1 | 1.17mi |
| 6322 Camino Dr Apollo Beach, FL | 3.0 | 2.5 | 1677 | $2,400 | $1.43 | 14d | 1 | 1.28mi |
| 6350 Union Station Ct Apollo Beach, FL | 3.0 | 1.0–2.0 | 1105 | $2,744 | $2.48 | 1d | 42 | 1.32mi |
Listing history 12 events
-
2026-06-07statusdays on market $219,900 Pending 7 DOM
-
2026-06-04days on market $219,900 Active 6 DOM
-
2026-06-03days on market $219,900 Active 5 DOM
-
2026-06-02days on market $219,900 Active 4 DOM
-
2026-06-01days on market $219,900 Active 3 DOM
-
2026-05-31days on market $219,900 Active 2 DOM
-
2009-11-02soldstatus $109,900
-
2009-10-28soldstatus $109,900 282-char remark
Show marketing remark (282 chars)
Excellent buy on 4BR/2BA pool home within walking or bike riding distance of elementary school and county recreation. 2 Screen porches, large fenced & private backyard, 2 driveways, lots of storage. Newer roof; CHA , water heater, bathrooms, & tile floors. Shed/Workshop!
-
2009-07-22$109,900 282-char remark
Show marketing remark (282 chars)
Excellent buy on 4BR/2BA pool home within walking or bike riding distance of elementary school and county recreation. 2 Screen porches, large fenced & private backyard, 2 driveways, lots of storage. Newer roof; CHA , water heater, bathrooms, & tile floors. Shed/Workshop!
-
1993-08-10soldstatus $60,000
-
1986-09-01soldstatus $55,000
-
1981-06-01soldstatus $40,000
ⓘ Source: listings_history table (triggers on properties + properties_extension) + one-shot
backfill from property_details.listing_events for pre-trigger history.
Tax reassessment forecast FL · Resets to sale price
- Current annual tax
- $1,502 · $125/mo
- Projected year-2 tax
- $1,825 · $152/mo
- Expected delta
- +$323/yr (+$27/mo · 21.5%)
ⓘ Screening estimate from a state-policy table — verify with the county assessor before closing.
Climate risk First Street
- Flood 9/10 Extreme FEMA zone AE · 99% chance over 30 yrs
- Wildfire 4/10 Moderate
- Heat 10/10 Extreme 7 d/yr ≥107°F today · 28 d/yr by 30 yrs out
- Wind 9/10 Extreme 99% chance of damaging wind over 30 yrs
- Air quality 3/10 Moderate 3 unhealthy d/yr today · 4 by 30 yrs out
Nearby sold comps map
Loading sold comps map…
Walkable amenities ~0.75 mi
Loading nearby amenities…
Taxation est. · year 1
- Rental income
- $32,420
- − Mortgage interest
- −$12,318
- − Property taxes
- −$1,502
- − Insurance
- −$6,218
- − Repairs & maintenance
- −$2,594
- − Management
- −$2,594
- − Depreciation
- −$6,397
- Taxable income
- $798
- Est. tax owed @ 24.0%
- −$192
- After-tax cash flow
- $3,862/yr
For passive investors: Depreciation is non-cash, so a rental often shows a tax loss while cash-flowing — sheltering income. Rental losses are passive: they offset passive income freely, and up to $25,000/yr can offset ordinary (W-2) income if you actively participate and your MAGI is under $100k (phasing out to $0 by $150k); unused losses carry forward. On sale, claimed depreciation is recaptured at up to 25%, and gains may owe capital-gains tax (a 1031 exchange can defer both). Figures are a year-1 estimate at your 24.0% rate — not tax advice; consult a CPA.
Schools (NCES district)
- District
- Hillsborough
- NCES district ID
- 1200870
- Math proficiency
- 47% ▼ -8.00%
- Reading proficiency
- 50% ▼ -4.00%
- Median HH income
- $50,622
- Composite
- 41.6/100
- National rank
- #3435
- State rank
- #41 of 73 in FL
Livability — Apollo Beach
- Score
- 72/100
- State rank
- #333
- US rank
- #5784
Category grades
Schools grade is shown separately in the Schools card above.
Census & demographics
- Census place
- Apollo Beach, FL
- County
- Hillsborough County · 1,540,968 people
- City population
- 26,495
- Metro
- Tampa-St. Petersburg-Clearwater, FL
- Population (ZIP)
- 26,495
- Household income
- $122,130
- Rent vs Own
- Severe rent burden
- 381.0
Population outlook (Hillsborough County) Hauer SSP2
- Today (2025)
- 1,607,022 people
- By 2030
- 1,733,968 · +7.9%
- By 2040
- 1,979,565 · +23.2%
- By 2050
- 2,203,427 · +37.1%
- By 2075
- 2,667,893 · +66.0%
- By 2100
- 2,891,558 · +79.9%
Race, ethnicity, and origin ACS 2023
- Neighborhood character
- Predominantly White (65%)
- Race & ethnicity
- White 65% Hispanic / Latino 15% Black 13% Two or more races 12% Asian 2%
- Hispanic origin (detail)
- Mexican 2% Puerto Rican 3% Cuban 2% Dominican 2%
- Common ancestry
- Romanian 3% Lithuanian 3% Slovak 2%
- Foreign-born
- 10% · Canada, Jamaica, Guatemala
- Languages at home
- 86% English-only · Spanish 10% Russian/Polish/Slavic 1% Tagalog/Filipino 1%
Political lean MEDSL · Hillsborough
- 2024 margin
- Toss-up / Even · D 47.8% · R 50.9% · Other 1.3%
- 2008→2024 swing
- -10.2pp toward R · 2008: 7.1pp · 2024: -3.1pp
- All cycles
- 2024: R+3.1 2020: D+6.9 2016: D+6.8 2012: D+6.7 2008: D+7.1
Not yet ingested
- Civics
- —
Market trends
- HPI YoY
- ▼ -393.97%
- Current HPI
- 300.9596
- Rent YoY
- ▲ 3.36%
- Metro
- Tampa-St. Petersburg-Clearwater, FL
- State GDP YoY
- ▲ 3.28%
- F500 in state
- 36
Industry mix (Fortune 500 HQ in FL)
| Industry | F500 HQs | Revenue |
|---|---|---|
| Industrial Technology | 2 | $29B |
|
||
| Insurance | 2 | $17B |
|
||
| Retail | 1 | $60B |
|
||
| Technology Distribution | 1 | $58B |
|
||
| Homebuilding | 1 | $35B |
|
||
| Technology Manufacturing | 1 | $35B |
|
||
Price history
+449.7% since first listed8 events — show timeline
- 2026-06-05 Pending — Stellar MLS as Distributed by MLS Grid
- 2026-05-29 Listed $219,900 Stellar MLS as Distributed by MLS Grid
- 2009-11-02 Sold (Public Records) $109,900 Public Records
- 2009-10-28 Sold (MLS) $109,900 Stellar MLS as Distributed by MLS Grid
- 2009-07-22 Listed $109,900 Stellar MLS as Distributed by MLS Grid
- 1993-08-10 Sold (Public Records) $60,000 Public Records
- 1986-09-01 Sold (Public Records) $55,000 Public Records
- 1981-06-01 Sold (Public Records) $40,000 Public Records
Property tax history
+3.8%/yrLatest (2025): $1,502 · +6.4% YoY. Source: county tax records.
Cash-flow waterfall
monthlySold comps — $/sqft
last 12 mo · ≤1 miLoading sold comps…