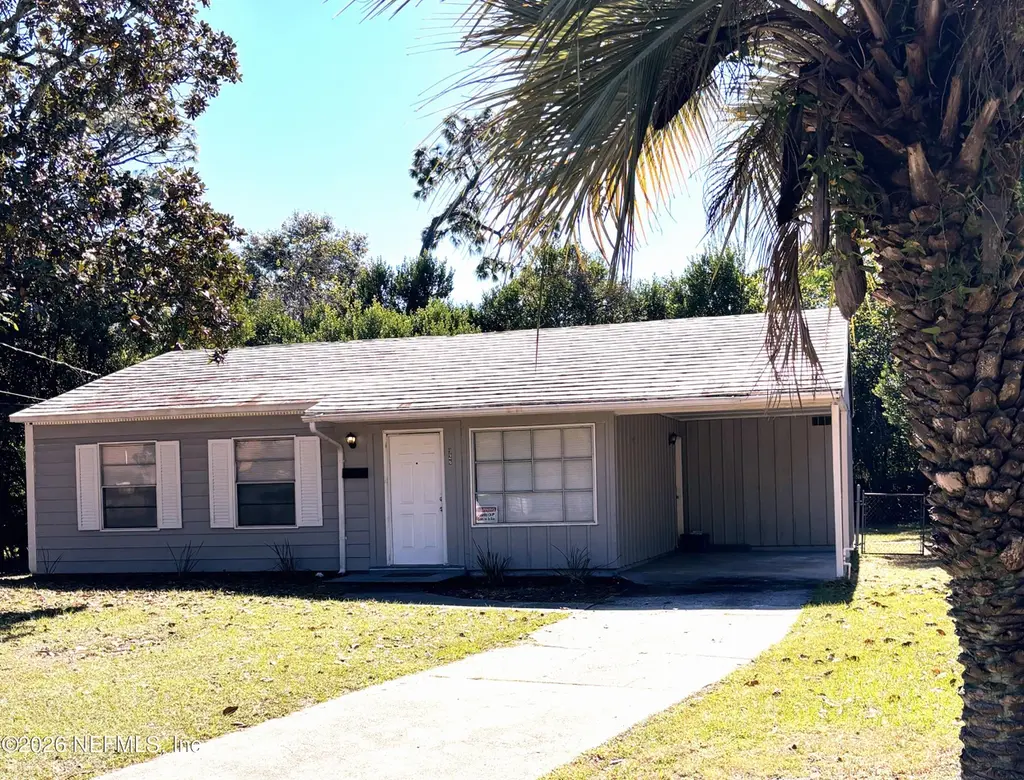
926 Pheasant Dr · Jacksonville, FL
Flood risk 1/10 · Minimal
- FEMA flood zone
- X (unshaded)
- Chance of flooding over 30 yrs
- 0.0%
- Est. flood insurance / yr
- $507 – $1,088
Fire risk 3/10 · Minor
- Est. fire insurance / yr
- $947 – $1,759
Heat risk 9/10 · Severe
- Hot days now (above 107°F)
- 7 days/yr
- Hot days in 30 yrs
- 20 days/yr
Wind risk 9/10 · Severe
- Chance of severe wind over 30 yrs
- 99.0%
Air-quality risk 4/10 · Minor
- Unhealthy air days now
- 6 days/yr
- Unhealthy air days in 30 yrs
- 6 days/yr
Risk factors via First Street. Map © Google.
Why this score? — see what drove the D grade
The composite is a weighted blend of 9 inputs, each scored 0–100. Each bar is that input's sub-score; the figure is the points it added to the 100-point composite (weight × sub-score).
- Cash flow +16.5/30.0
- DSCR +5.1/10.0
- ARV discount +5.0/15.0
- 1% rule +4.4/10.0
- Livability +4.2/5.0
- Schools +3.9/10.0
- Condition / age +2.5/5.0
- Rent growth +2.4/5.0
- Appreciation +0.0/10.0
$160,000
🖨 Deal sheet 📄 Offer letter ✓ Due diligence
Listing remarks MLS
Being Sold 'AS IS ' Seller is unaware of any defects, lead based paint or paint hazards on the property that should be disclosed.
Key facts
- 8,276 sq ft lot
- Parking
- Built 1960
Property features AI
Finance
- HOA & community: Not a senior community
Exterior
- Parking: Carport (1 space)
- Utilities: Electricity connected; Sewer connected; Water connected
- Home design: Single-family residence; Used for residential single-family purposes
- Exterior features: Lot approximately 0.19 acres; No private pool
Interior
- Kitchen: Electric oven; Refrigerator
- Bedrooms: 4 bedrooms
- Bathrooms: 1 full bathroom
- Heating & cooling: Central heating; Central air conditioning
- Interior features: Electric water heater
- Laundry & utility: Unfurnished unit (no built-in laundry specified)
Neighborhood map
What this means for you Summary
Snapshot
- This is a 3-bed/1.0-bath single-family listed at $160k.
Deal economics
- At list price, monthly cash flow is $93 ($1k/yr) — positive.
- The deal already cash-flows at list — no discount required.
- To meet the 1% rule (rent ≥ 1% of price), the offer needs to be $150k (6.5% below list).
- Recommended offer: $150k (6.5% below list) — sets the bar for 1% rule.
- Cap rate 7.0% vs local median 4.0% in Jacksonville — top-decile yield for the area; either an underpriced asset or a hidden risk that comps aren't pricing in. Stress-test before assuming the spread holds.
Location & tenants
- Location reads 83/100 on livability (#50 in FL, #911 nationally) — a professional / high-income tenant draw. Strengths: amenities A+, commute A+, housing A+.
- Duval (urban): math 46% / reading 45% proficiency, ranked #48 of 73 in FL (top 66%) — families likely to look elsewhere, expect single-tenant / working-renter base with shorter leases.
- Market conditions: Rents soft (-0.4%/yr); 728 active listings in the ZIP; 13 comparable units currently listed for rent nearby; rentals leasing fast (median 3d on market — plan ~1-2 weeks tenant-placement turnaround); 6,503 units permitted in Duval County in 2024 (1,131 in 5+ unit buildings).
Forward outlook
- Local home prices are declining (-3.0%/yr); year-one equity from $1k of loan paydown is wiped out by about $5k of value loss. Plan a longer hold.
- Duval County population projected at +19% by 2050 — long-run rental-demand tailwind backs the buy-and-hold thesis.
Negotiation context
- It's been on market 53 days — a 3% lower offer ($155k) is reasonable based on typical stale-listing flexibility.
- 6 sale attempts since 22y ago with the ask held roughly flat each time — persistent listings suggest the price (not the market) is what's stuck; bring a comps-based counter.
- Current owner paid $106k; list at $160k implies a 51% gain — meaningful room to come down on a strong offer.
Risks & watch-outs
- Climate carrying-cost: severe wind risk, 99% chance of damaging wind over 30y; extreme-heat days projected 7→20/yr by 2055 (HVAC capex compounding) — expect insurance premiums to compound above CPI over the hold.
Questions for the listing agent
- It's been on market 53 days. Have you received any prior offers? Is the seller open to a 6% concession, seller financing, or rate buy-down credit?
- Built in 1960 — when were the roof, HVAC, electrical panel, plumbing, and water heater last replaced?
- Is there a deadline driving the sale (1031 exchange, divorce, estate, relocation)? That informs how much negotiation room exists.
- Schools are B-rated — typically a magnet for longer-tenancy family renters. What's the average tenant stay here, and is there a school-zone premium baked into asking?
- The area grade is low — what's the realistic commute time and amenity access for the typical tenant pool here? Any planned neighborhood developments (good or bad) we should know about?
- What's the average days-on-market for RENTAL listings here right now (not sales)? A rising rental-DOM trend means longer vacancies and softer asking-rent achievability than the comps imply.
- What's the recent tenant-quality profile in this submarket — average credit score on applications, eviction rate, late-payment / NSF rate, and stable-employment percentage? A property-management company in the area should have these aggregated.
- How much new for-sale + rental construction is in the pipeline within 1–3 miles? Heavy new supply typically softens prices + rents 12–24 months out; constrained supply supports both.
Investment metrics
- 1% rule
- 0.94% ✗
- Cap rate
- 6.99%
- Cash-on-cash
- 2.48%
- DSCR
- 1.11
- GRM
- 8.9
CMA / ARV
- ARV (on-the-fly)
- $151,536
- Comps found
- 12
Show comp detail 12 sales within ~0.75 mi
| Address | Dist | Beds/Ba | Sqft | Sold | Price | $/sf | Match |
|---|---|---|---|---|---|---|---|
| 10258 Elmhurst Dr | 0.29mi | 3/1.5 | 912 (-1%) | 10mo | $165,000 | $181 | 74 |
| 10204 Elmhurst Dr | 0.37mi | 3/1.0 | 942 (+2%) | 9mo | $149,000 | $158 | 72 |
| 10550 Fairlane Dr | 0.12mi | 3/2.0 | 1,036 (+12%) | 1mo | $170,000 | $164 | 69 |
| 1120 Carthage Dr | 0.36mi | 3/1.0 | 911 (-1%) | 15mo | $110,000 | $121 | 68 |
| 10252 Elmhurst Dr | 0.30mi | 3/1.0 | 888 (-4%) | 14mo | $154,500 | $174 | 68 |
| 10235 Swarthmore Dr | 0.39mi | 3/1.0 | 954 (+3%) | 12mo | $192,000 | $201 | 66 |
| 10242 Westmar Rd | 0.28mi | 2/1.0 (-1) | 952 (+3%) | 13mo | $115,000 | $121 | 66 |
| 10633 Ithaca Dr | 0.67mi | 2/1.0 (-1) | 881 (-5%) | 6mo | $70,000 | $79 | 51 |
| 10615 Briarcliff Rd E | 0.33mi | 3/1.0 | 1,062 (+15%) | 13mo | $120,500 | $113 | 49 |
| 10433 Briarcliff Rd S | 0.52mi | 3/1.0 | 816 (-12%) | 9mo | $174,900 | $214 | 49 |
| 10536 Wooster Dr | 0.64mi | 3/1.0 | 996 (+8%) | 16mo | $95,000 | $95 | 44 |
| 10360 Pinehurst Dr | 0.62mi | 3/1.5 | 1,008 (+9%) | 13mo | $177,250 | $176 | 43 |
Match score weights: distance 35% · size 25% · config 20% · recency 20%. Top-matched comps best support the ARV.
Projected returns pro-forma
-3.0% appreciation · 0.0% rent growth · sell at horizon
- IRR
- -15.7%
- Equity multiple
- 0.46×
- Total profit
- $-24,392
- Equity at exit
- $23,857
- IRR
- -13.5%
- Equity multiple
- 0.32×
- Total profit
- $-30,530
- Equity at exit
- $13,834
Cash invested: $44,800 (down + closing). Projections, not guarantees.
Landlord ↔ Tenant lean methodology
- Overall (STATE)
- 87 Strongly Landlord-Friendly
- State Florida
- 87 Strongly Landlord-Friendly · R+3
- County
- — inherits STATE
- City
- — inherits STATE
ZIP-level market 32218
- Home prices YoY
- -25.7%
- Rents YoY
- -0.4%
- Active inventory
- 728
- Price-to-rent
- 8.9×
Monthly cashflow live
- Estimated rent
- $1,496 high interval (Pro) →
- Mortgage (P&I)
- −$839
- Tax from tax record
- −$184 /mo · $2,205/yr
- Insurance
- −$67
- HOA
- −$0
- Vacancy / Maint / Mgmt
- −$314
- Net cashflow
- $93
Break-even live
UW: 25.0% down · 7.5% · 30yr · 1.5% tax · 5.0% vac · 8.0% maint · 8.0% mgmt
Financing live
Cash to close
- Down payment
- $40,000
- Closing costs
- $4,800
- Reserves months
- —
- Total cash needed
- —
Loan-product check · same deal, 3 products live
Conventional
25% down · 7.5% · 30yr
- Down + closing
- —
- Monthly P&I
- —
- Monthly cashflow
- —
- DSCR
- —
- Eligible?
- —
Personal DTI + credit; lowest rate.
DSCR
20% down · 8.5% · 30yr
- Down + closing
- —
- Monthly P&I
- —
- Monthly cashflow
- —
- DSCR
- —
- Eligible?
- —
No personal income docs; deal must DSCR.
Hard money
10% down · 12.0% · 12mo
- Down + closing
- —
- Monthly P&I
- —
- Monthly cashflow
- —
- DSCR
- —
- Eligible?
- —
Short-term bridge; refi at stabilization.
Rent comps 13 comps
| Address | Beds | Baths | Sqft | Rent | $/sqft | DOM | Units | Dist |
|---|---|---|---|---|---|---|---|---|
| 1033 Ake Ln Jacksonville, FL | 3.0 | 1.0 | 868 | $1,200 | $1.38 | 21d | 1 | 0.13mi |
| 10621 Monaco Dr Jacksonville, FL | 1.0–2.0 | 1.0–1.5 | 975 | $1,150 | $1.18 | 23d | 7 | 0.20mi |
| 10561 Ashby Rd Jacksonville, FL | 3.0 | 1.0 | 1034 | $1,181 | $1.14 | 23d | 1 | 0.33mi |
| 10529 Keuka Dr Jacksonville, FL | 4.0 | 1.0 | 1101 | $600 | $0.54 | 7d | 1 | 0.42mi |
| 12802 Haverford Rd Jacksonville, FL | 1.0–3.0 | 1.0–2.0 | 1000 | $1,299 | $1.30 | 1d | 15 | 0.51mi |
| 1333 Dunn Ave Jacksonville, FL | 2.0 | 1.0 | 576 | $1,185 | $2.06 | 1d | 16 | 0.62mi |
| 11011 Harts Rd Jacksonville, FL | 1.0–3.0 | 1.0–2.0 | 1052 | $1,742 | $1.66 | 1d | 23 | 0.80mi |
| 1601 Dunn Ave Jacksonville, FL | 1.0–3.0 | 1.0–2.0 | 852 | $1,575 | $1.85 | 2d | 12 | 0.84mi |
| 11050 Harts Rd Jacksonville, FL | 3.0 | 2.0–2.5 | 1145 | $1,511 | $1.32 | 2d | 10 | 0.87mi |
| 780 Island Point Dr Jacksonville, FL | 1.0–3.0 | 1.0–2.0 | 1164 | $2,143 | $1.84 | 3d | 16 | 1.12mi |
| 745 Northpoint Cir N Jacksonville, FL | 2.0 | 2.0 | 897 | $1,600 | $1.78 | 23d | 1 | 1.20mi |
| 1000 Island Point Dr Jacksonville, FL | 1.0–3.0 | 1.0–2.0 | 949 | $1,684 | $1.77 | 2d | 9 | 1.34mi |
| 800 Broward Rd Jacksonville, FL | 1.0–3.0 | 1.0–2.0 | 1028 | $1,711 | $1.66 | 1d | 42 | 1.34mi |
Listing history 30 events
-
2026-06-18days on market $160,000 Active 53 DOM
-
2026-06-17days on market $160,000 Active 52 DOM
-
2026-06-16days on market $160,000 Active 51 DOM
-
2026-06-15days on market $160,000 Active 50 DOM
-
2026-06-13days on market $160,000 Active 47 DOM
-
2026-06-10days on market $160,000 Active 44 DOM
-
2026-06-08days on market $160,000 Active 43 DOM
-
2026-06-07days on market $160,000 Active 42 DOM
-
2026-06-05days on market $160,000 Active 39 DOM
-
2026-06-03days on market $160,000 Active 38 DOM
-
2026-06-02days on market $160,000 Active 37 DOM
-
2026-06-01days on market $160,000 Active 36 DOM
-
2026-05-31days on market $160,000 Active 35 DOM
-
2026-05-21status Active
-
2026-04-01historical
-
2026-03-07$160,000 Active
-
2025-05-02historical $1,399
-
2025-03-31$1,399
-
2023-11-17historical $1,399
-
2023-11-10$1,399
-
2023-09-20soldstatus $106,000 Closed
-
2023-08-29status Pending
-
2023-08-15status Pending
-
2023-07-26$119,900 Active
-
2021-11-09soldstatus $7,523,700
-
2006-03-06soldstatus $90,000
-
2004-08-27soldstatus $54,900 129-char remark
Show marketing remark (129 chars)
Being Sold 'AS IS ' Seller is unaware of any defects, lead based paint or paint hazards on the property that should be disclosed.
-
2004-07-14$54,900 129-char remark
Show marketing remark (129 chars)
Being Sold 'AS IS ' Seller is unaware of any defects, lead based paint or paint hazards on the property that should be disclosed.
-
2001-06-21soldstatus $68,000
-
1970-09-21soldstatus $12,000
ⓘ Source: listings_history table (triggers on properties + properties_extension) + one-shot
backfill from property_details.listing_events for pre-trigger history.
Tax reassessment forecast FL · Resets to sale price
- Current annual tax
- $2,205 · $184/mo
- Projected year-2 tax
- $2,205 · $184/mo
- Expected delta
- $0/yr ($0/mo · 0.0%)
ⓘ Screening estimate from a state-policy table — verify with the county assessor before closing.
Climate risk First Street
- Flood 1/10 Low FEMA zone X (unshaded) · 0% chance over 30 yrs
- Wildfire 3/10 Moderate
- Heat 9/10 Extreme 7 d/yr ≥107°F today · 20 d/yr by 30 yrs out
- Wind 9/10 Extreme 99% chance of damaging wind over 30 yrs
- Air quality 4/10 Moderate 6 unhealthy d/yr today · 6 by 30 yrs out
Nearby sold comps map
Loading sold comps map…
Walkable amenities ~0.75 mi
Loading nearby amenities…
Taxation est. · year 1
- Rental income
- $17,958
- − Mortgage interest
- −$8,962
- − Property taxes
- −$2,205
- − Insurance
- −$800
- − Repairs & maintenance
- −$1,437
- − Management
- −$1,437
- − Depreciation
- −$4,655
- Taxable loss
- −$1,537
- Est. tax savings @ 24.0%
- +$369
- After-tax cash flow
- $1,482/yr
For passive investors: Depreciation is non-cash, so a rental often shows a tax loss while cash-flowing — sheltering income. Rental losses are passive: they offset passive income freely, and up to $25,000/yr can offset ordinary (W-2) income if you actively participate and your MAGI is under $100k (phasing out to $0 by $150k); unused losses carry forward. On sale, claimed depreciation is recaptured at up to 25%, and gains may owe capital-gains tax (a 1031 exchange can defer both). Figures are a year-1 estimate at your 24.0% rate — not tax advice; consult a CPA.
Schools (NCES district)
- District
- Duval
- NCES district ID
- 1200480
- Math proficiency
- 46% ▼ -11.00%
- Reading proficiency
- 45% ▼ -4.00%
- Median HH income
- $48,987
- Composite
- 38.97/100
- National rank
- #4076
- State rank
- #48 of 73 in FL
Livability — Jacksonville
- Score
- 83/100
- State rank
- #50
- US rank
- #911
Category grades
Schools grade is shown separately in the Schools card above.
Census & demographics
- Census place
- Jacksonville, FL
- County
- Duval County · 1,015,274 people
- City population
- 979,034
- Metro
- Jacksonville, FL
- Population (ZIP)
- 72,905
- Household income
- $69,638
- Rent vs Own
- Severe rent burden
- 2289.0
Population outlook (Duval County) Hauer SSP2
- Today (2025)
- 1,013,010 people
- By 2030
- 1,059,228 · +4.6%
- By 2040
- 1,141,439 · +12.7%
- By 2050
- 1,205,258 · +19.0%
- By 2075
- 1,324,282 · +30.7%
- By 2100
- 1,319,620 · +30.3%
Race, ethnicity, and origin ACS 2023
- Neighborhood character
- Diverse neighborhood (Simpson 0.64)
- Race & ethnicity
- Black 48% White 35% Hispanic / Latino 9% Two or more races 8% Asian 2%
- Hispanic origin (detail)
- Mexican 2% Puerto Rican 4%
- Common ancestry
- Slovak 1% Lithuanian 1% Italian 1%
- Foreign-born
- 6% · Canada, Jamaica, Vietnam
- Languages at home
- 89% English-only · Spanish 6% French/Haitian/Cajun 1% Tagalog/Filipino 1%
Political lean MEDSL · Duval
- 2024 margin
- Toss-up / Even · D 48.7% · R 50.1% · Other 1.2%
- 2008→2024 swing
- +0.4pp no change · 2008: -1.9pp · 2024: -1.5pp
- All cycles
- 2024: R+1.5 2020: D+3.8 2016: R+1.5 2012: R+3.6 2008: R+1.9
Not yet ingested
- Civics
- —
Market trends
- HPI YoY
- ▼ -90.73%
- Current HPI
- 262.2329
- Rent YoY
- ▼ -0.40%
- Metro
- Jacksonville, FL
- State GDP YoY
- ▲ 3.28%
- F500 in state
- 36
Industry mix (Fortune 500 HQ in FL)
| Industry | F500 HQs | Revenue |
|---|---|---|
| Industrial Technology | 2 | $29B |
|
||
| Insurance | 2 | $17B |
|
||
| Retail | 1 | $60B |
|
||
| Technology Distribution | 1 | $58B |
|
||
| Homebuilding | 1 | $35B |
|
||
| Technology Manufacturing | 1 | $35B |
|
||
Price history
+1233.3% since first listed17 events — show timeline
- 2026-05-21 Relisted — realMLS
- 2026-04-01 Listing Removed — realMLS
- 2026-03-07 Listed $160,000 realMLS
- 2025-05-02 Rental Removed $1,399 APPFOLIO
- 2025-03-31 Listed for Rent $1,399 APPFOLIO
- 2023-11-17 Rental Removed $1,399 APPFOLIO
- 2023-11-10 Listed for Rent $1,399 APPFOLIO
- 2023-09-20 Sold (MLS) $106,000 realMLS
- 2023-08-29 Pending — realMLS
- 2023-08-15 Pending — realMLS
- 2023-07-26 Listed $119,900 realMLS
- 2021-11-09 Sold (Public Records) $7,523,700 Public Records
- 2006-03-06 Sold (Public Records) $90,000 Public Records
- 2004-08-27 Sold (MLS) $54,900 realMLS
- 2004-07-14 Listed $54,900 realMLS
- 2001-06-21 Sold (Public Records) $68,000 Public Records
- 1970-09-21 Sold (Public Records) $12,000 Public Records
Property tax history
+5.0%/yrLatest (2025): $2,205 · +22.9% YoY. Source: county tax records.
Cash-flow waterfall
monthlySold comps — $/sqft
last 12 mo · ≤1 miLoading sold comps…