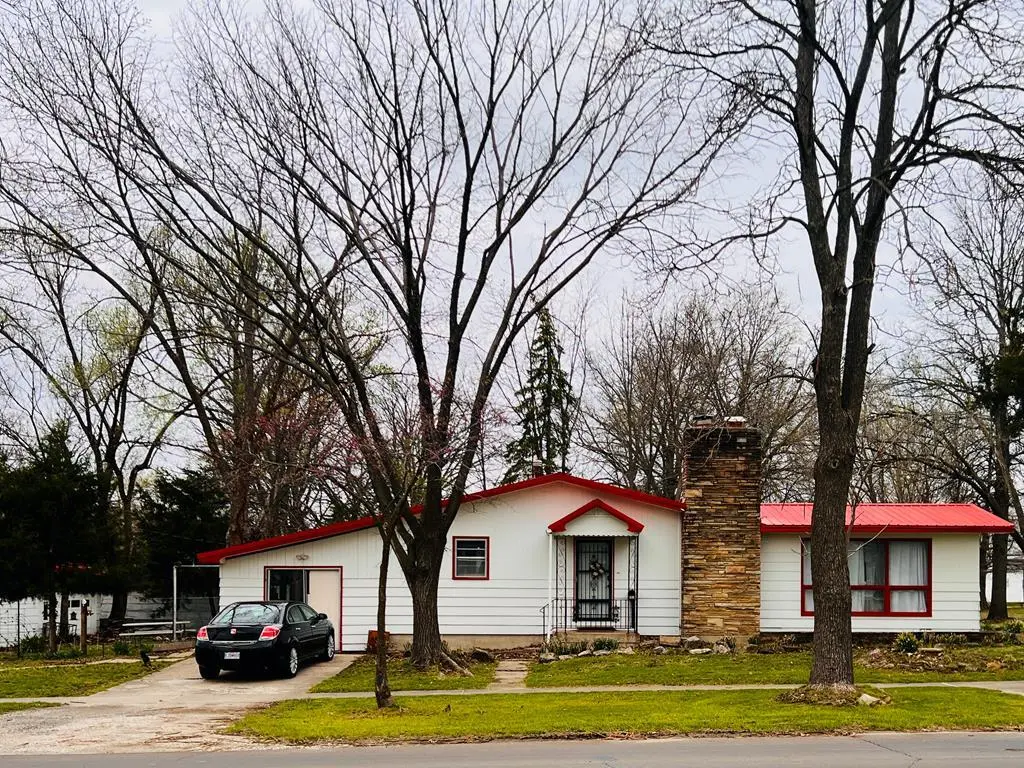
302 S Kansas Ave · Marceline, MO
Flood risk 1/10 · Minimal
- FEMA flood zone
- X (unshaded)
- Chance of flooding over 30 yrs
- 0.0%
- Est. flood insurance / yr
- $473 – $860
Fire risk 3/10 · Minor
- Est. fire insurance / yr
- $1,054 – $1,958
Heat risk 3/10 · Minor
- Hot days now (above 106°F)
- 7 days/yr
- Hot days in 30 yrs
- 16 days/yr
Wind risk 2/10 · Minimal
- Chance of severe wind over 30 yrs
- —
Air-quality risk 1/10 · Minimal
- Unhealthy air days now
- 0 days/yr
- Unhealthy air days in 30 yrs
- 0 days/yr
Risk factors via First Street. Map © Google.
Why this score? — see what drove the C grade
The composite is a weighted blend of 9 inputs, each scored 0–100. Each bar is that input's sub-score; the figure is the points it added to the 100-point composite (weight × sub-score).
- ARV discount +15.0/15.0
- Cash flow +12.9/30.0
- Appreciation +9.9/10.0
- Schools +5.2/10.0
- DSCR +3.9/10.0
- Livability +3.6/5.0
- Rent growth +2.5/5.0
- Condition / age +2.5/5.0
- 1% rule +2.4/10.0
$150,000
🖨 Deal sheet 📄 Offer letter ✓ Due diligence
Listing remarks MLS
Welcome home to this inviting 3 bed, 2 full bath property offering space, character, & excellent potential. Situated on a corner lot, this home features original hardwood floors that add warmth & timeless appeal throughout the main living areas. Enjoy cozy evenings by the wood-burning fireplace on the main floor, with a 2nd fireplace located in the unfinished basement—perfect for future expansion. The basement offers great potential to be finished into additional living space, includes an extra stool & sink for added convenience. The home is equipped with laundry hookups on both the main level & the basement, providing flexibility to suit your needs. The oversized 2-car detached garage, complete with a 3rd pull-up door on the side, is sure to please. You don't want to miss this one!!
Key facts
- Unfinished basement
- Corner lot
- 0.32 acre lot
Tags
Neighborhood map
What this means for you Summary
Snapshot
- This is a 3-bed/2.0-bath single-family listed at $150k.
Deal economics
- At list price, monthly cash flow is $-11 ($-130/yr) — negative.
- To cash-flow at today's rent, offer at most $148k (1.3% below list).
- To meet the 1% rule (rent ≥ 1% of price), the offer needs to be $112k (25.6% below list).
- Recommended offer: $112k (25.6% below list) — sets the bar for 1% rule.
Location & tenants
- Location reads 72/100 on livability (#96 in MO) — a middle-class / working-renter tenant base. Strengths: crime A+, cost of living A+, housing A+; Watch: employment D, amenities F, commute F.
- Marceline R-V (rural): math 64% / reading 59% proficiency, ranked #13 of 324 in MO (top 4%) — acceptable for families but not a draw, mixed tenant base, ~2y average lease.
- Market conditions: 22 active listings in the ZIP; 4 units permitted in Linn County in 2024 (0 in 5+ unit buildings).
Forward outlook
- In year one you build about $16k of equity ($1k loan paydown + $15k appreciation (9.8% local appreciation)).
- Linn County population projected at -21% by 2050 — secular population decline; favor cash flow + early exit over multi-decade hold.
- At projected returns (9.8% appreciation + 3.0% rent growth), your $42k cash investment doubles in ~3 years — after that, you're playing with house money.
- By year 3, paydown + projected appreciation supports a ~$40k cash-out refi (75% LTV) — recoverable capital for the next deal without selling this one.
Negotiation context
- It's been on market 69 days — a 6% lower offer ($141k) is reasonable based on typical stale-listing flexibility.
- 6 sale attempts since 4y ago with the ask held roughly flat each time — persistent listings suggest the price (not the market) is what's stuck; bring a comps-based counter.
Questions for the listing agent
- What do current leases actually rent for vs. the listed asking? Can we see a recent rent roll and the last 12 months of T-12 income?
- It's been on market 69 days. Have you received any prior offers? Is the seller open to a 26% concession, seller financing, or rate buy-down credit?
- Built in 1966 — when were the roof, HVAC, electrical panel, plumbing, and water heater last replaced?
- Why hasn't it sold? Are there any deal-killer items the seller is aware of (foundation, flood, title, zoning, code violations)?
- Is there a deadline driving the sale (1031 exchange, divorce, estate, relocation)? That informs how much negotiation room exists.
- Schools are B-rated — typically a magnet for longer-tenancy family renters. What's the average tenant stay here, and is there a school-zone premium baked into asking?
- What's the average days-on-market for RENTAL listings here right now (not sales)? A rising rental-DOM trend means longer vacancies and softer asking-rent achievability than the comps imply.
- What's the recent tenant-quality profile in this submarket — average credit score on applications, eviction rate, late-payment / NSF rate, and stable-employment percentage? A property-management company in the area should have these aggregated.
- How much new for-sale + rental construction is in the pipeline within 1–3 miles? Heavy new supply typically softens prices + rents 12–24 months out; constrained supply supports both.
Investment metrics
- 1% rule
- 0.74% ✗
- Cap rate
- 6.21%
- Cash-on-cash
- -0.31%
- DSCR
- 0.99
- GRM
- 11.2
CMA / ARV
- ARV (median comp)
- $181,375
- List price
- $150,000
- Delta
- -17.30%
- Verdict
- UNDERPRICED
- Comps
- 5 within 1.0 mi
Show comp detail 3 sales within ~0.75 mi
| Address | Dist | Beds/Ba | Sqft | Sold | Price | $/sf | Match |
|---|---|---|---|---|---|---|---|
| 400 E Howell Ave | 0.37mi | 3/2.0 | 1,620 (+10%) | 7mo | $177,000 | $109 | 61 |
| 31461 Highway JJ N/A | 0.60mi | 3/1.5 | 1,560 (+5%) | 6mo | $180,000 | $115 | 56 |
| 227 E California Ave | 0.39mi | 3/2.0 | 1,659 (+12%) | 12mo | $185,000 | $112 | 52 |
Match score weights: distance 35% · size 25% · config 20% · recency 20%. Top-matched comps best support the ARV.
Projected returns pro-forma
9.81% appreciation · 3.0% rent growth · sell at horizon
- IRR
- 23.6%
- Equity multiple
- 2.88×
- Total profit
- $78,976
- Equity at exit
- $133,051
- IRR
- 21.0%
- Equity multiple
- 6.53×
- Total profit
- $232,458
- Equity at exit
- $284,742
Cash invested: $42,000 (down + closing). Projections, not guarantees.
Landlord ↔ Tenant lean methodology
- Overall (STATE)
- 81 Strongly Landlord-Friendly
- State Missouri
- 81 Strongly Landlord-Friendly · R+10
- County
- — inherits STATE
- City
- — inherits STATE
ZIP-level market 64658
- Home prices YoY
- 3.9%
- Active inventory
- 22
- Price-to-rent
- 11.2×
Monthly cashflow live
- Estimated rent
- $1,116 medium interval (Pro) →
- Mortgage (P&I)
- −$787
- Tax from tax record
- −$43 /mo · $521/yr
- Insurance
- −$62
- HOA
- −$0
- Vacancy / Maint / Mgmt
- −$234
- Net cashflow
- $-11
Break-even live
UW: 25.0% down · 7.5% · 30yr · 1.5% tax · 5.0% vac · 8.0% maint · 8.0% mgmt
Financing live
Cash to close
- Down payment
- $37,500
- Closing costs
- $4,500
- Reserves months
- —
- Total cash needed
- —
Loan-product check · same deal, 3 products live
Conventional
25% down · 7.5% · 30yr
- Down + closing
- —
- Monthly P&I
- —
- Monthly cashflow
- —
- DSCR
- —
- Eligible?
- —
Personal DTI + credit; lowest rate.
DSCR
20% down · 8.5% · 30yr
- Down + closing
- —
- Monthly P&I
- —
- Monthly cashflow
- —
- DSCR
- —
- Eligible?
- —
No personal income docs; deal must DSCR.
Hard money
10% down · 12.0% · 12mo
- Down + closing
- —
- Monthly P&I
- —
- Monthly cashflow
- —
- DSCR
- —
- Eligible?
- —
Short-term bridge; refi at stabilization.
Listing history 24 events
-
2026-06-18days on market $150,000 Active 69 DOM
-
2026-06-17days on market $150,000 Active 68 DOM
-
2026-06-16days on market $150,000 Active 67 DOM
-
2026-06-15days on market $150,000 Active 66 DOM
-
2026-06-13days on market $150,000 Active 64 DOM
-
2026-06-12days on market $150,000 Active 63 DOM
-
2026-06-09days on market $150,000 Active 60 DOM
-
2026-06-08days on market $150,000 Active 59 DOM
-
2026-06-07days on market $150,000 Active 58 DOM
-
2026-06-07days on market $150,000 Active 57 DOM
-
2026-06-04days on market $150,000 Active 54 DOM
-
2026-06-02days on market $150,000 Active 53 DOM
-
2026-06-01days on market $150,000 Active 52 DOM
-
2026-05-31days on market $150,000 Active 51 DOM
-
2026-04-10$150,000 Active 823-char remark
Show marketing remark (823 chars)
Welcome home to this inviting 3 bed, 2 full bath property offering space, character, & excellent potential. Situated on a corner lot, this home features original hardwood floors that add warmth & timeless appeal throughout the main living areas. Enjoy cozy evenings by the wood-burning fireplace on the main floor, with a 2nd fireplace located in the unfinished basement—perfect for future expansion. The basement offers great potential to be finished into additional living space, includes an extra stool & sink for added convenience. The home is equipped with laundry hookups on both the main level & the basement, providing flexibility to suit your needs. The oversized 2-car detached garage, complete with a 3rd pull-up door on the side, is sure to please. You don't want to miss this one!!
-
2023-08-30status Active
-
2023-08-12historical
-
2023-02-27price $146,900
-
2023-02-27price $146,900
-
2022-12-17$154,900 Active
-
2022-12-16$154,900 Active
-
2022-08-12$154,900 Active
-
2022-08-10$154,900 Active
-
1967-10-26soldstatus
ⓘ Source: listings_history table (triggers on properties + properties_extension) + one-shot
backfill from property_details.listing_events for pre-trigger history.
Tax reassessment forecast MO · Resets to sale price
- Current annual tax
- $521 · $43/mo
- Projected year-2 tax
- $1,455 · $121/mo
- Expected delta
- +$934/yr (+$78/mo · 179.1%)
ⓘ Screening estimate from a state-policy table — verify with the county assessor before closing.
Climate risk First Street
- Flood 1/10 Low FEMA zone X (unshaded) · 0% chance over 30 yrs
- Wildfire 3/10 Moderate
- Heat 3/10 Moderate 7 d/yr ≥106°F today · 16 d/yr by 30 yrs out
- Wind 2/10 Low
- Air quality 1/10 Low 0 unhealthy d/yr today · 0 by 30 yrs out
Nearby sold comps map
Loading sold comps map…
Walkable amenities ~0.75 mi
Loading nearby amenities…
Taxation est. · year 1
- Rental income
- $13,393
- − Mortgage interest
- −$8,402
- − Property taxes
- −$521
- − Insurance
- −$750
- − Repairs & maintenance
- −$1,071
- − Management
- −$1,071
- − Depreciation
- −$4,364
- Taxable loss
- −$2,787
- Est. tax savings @ 24.0%
- +$669
- After-tax cash flow
- $539/yr
For passive investors: Depreciation is non-cash, so a rental often shows a tax loss while cash-flowing — sheltering income. Rental losses are passive: they offset passive income freely, and up to $25,000/yr can offset ordinary (W-2) income if you actively participate and your MAGI is under $100k (phasing out to $0 by $150k); unused losses carry forward. On sale, claimed depreciation is recaptured at up to 25%, and gains may owe capital-gains tax (a 1031 exchange can defer both). Figures are a year-1 estimate at your 24.0% rate — not tax advice; consult a CPA.
Schools (NCES district)
- District
- Marceline R-V
- NCES district ID
- 2920050
- Math proficiency
- 64% ▼ -4.00%
- Reading proficiency
- 59% ▼ -6.00%
- Median HH income
- $42,608
- Composite
- 51.64/100
- National rank
- #1699
- State rank
- #13 of 324 in MO
Livability — Marceline
- Score
- 72/100
- State rank
- #96
- US rank
- #6432
Category grades
Schools grade is shown separately in the Schools card above.
Census & demographics
- Census place
- Marceline, MO
- Population (ZIP)
- 3,112
Population outlook (Linn County) Hauer SSP2
- Today (2025)
- 11,437 people
- By 2030
- 10,946 · -4.3%
- By 2040
- 9,969 · -12.8%
- By 2050
- 9,056 · -20.8%
- By 2075
- 7,342 · -35.8%
- By 2100
- 5,656 · -50.5%
Race, ethnicity, and origin ACS 2023
- Neighborhood character
- Predominantly White (94%)
- Race & ethnicity
- White 94% Hispanic / Latino 4% Two or more races 3% Black 1%
- Common ancestry
- Slovak 2% Serbian 1% Italian 1%
- Foreign-born
- 2% · Canada, Jamaica
Political lean MEDSL · Linn
- 2024 margin
- Solid R (+57.2) · D 20.8% · R 78.1% · Other 1.1%
- 2008→2024 swing
- -48.8pp toward R · 2008: -8.5pp · 2024: -57.2pp
- All cycles
- 2024: R+57.2 2020: R+53.9 2016: R+51.1 2012: R+23.5 2008: R+8.5
Not yet ingested
- Civics
- —
Market trends
- HPI YoY
- ▲ 9.81%
- Current HPI
- 258.5949
- Rent YoY
- —
- Metro
- —
- State GDP YoY
- ▲ 1.84%
- F500 in state
- 20
Industry mix (Fortune 500 HQ in MO)
| Industry | F500 HQs | Revenue |
|---|---|---|
| Healthcare | 1 | $163B |
|
||
| Insurance | 1 | $21B |
|
||
| Industrial Technology | 1 | $17B |
|
||
| Retail | 1 | $16B |
|
||
| Industrial Distribution | 1 | $10B |
|
||
| Utilities | 1 | $9B |
|
||
Price history
-3.2% since first listed10 events — show timeline
- 2026-04-10 Listed $150,000 NECAR
- 2023-08-30 Relisted — CBORMLS
- 2023-08-12 Delisted — CBORMLS
- 2023-02-27 Price Changed $146,900 NECAR
- 2023-02-27 Price Changed $146,900 CBORMLS
- 2022-12-17 Listed $154,900 NECAR
- 2022-12-16 Listed $154,900 CBORMLS
- 2022-08-12 Listed $154,900 NECAR
- 2022-08-10 Listed $154,900 CBORMLS
- 1967-10-26 Sold (Public Records) — Public Records
Property tax history
+1.5%/yrLatest (2025): $521 · +5.0% YoY. Source: county tax records.
Cash-flow waterfall
monthlySold comps — $/sqft
last 12 mo · ≤1 miLoading sold comps…