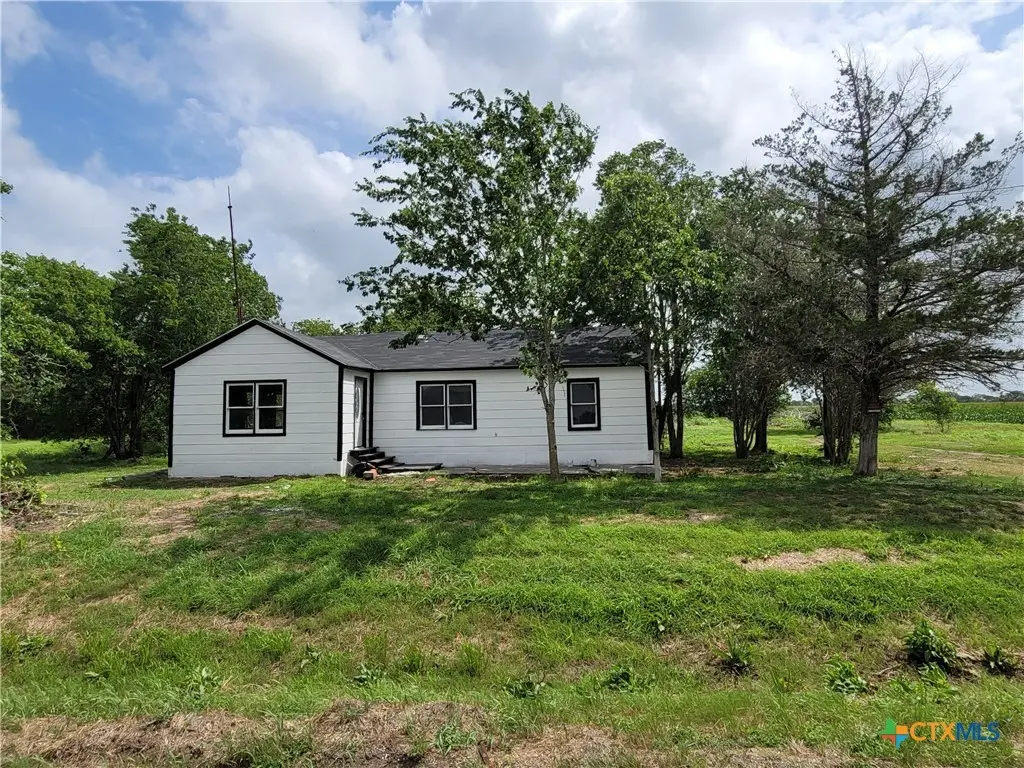
1108 S East St · Edna, TX
Flood risk 3/10 · Minor
- FEMA flood zone
- X (unshaded)
- Chance of flooding over 30 yrs
- 0.2%
- Est. flood insurance / yr
- $507 – $1,088
Fire risk 2/10 · Minimal
- Est. fire insurance / yr
- $1,222 – $2,270
Heat risk 9/10 · Severe
- Hot days now (above 110°F)
- 7 days/yr
- Hot days in 30 yrs
- 21 days/yr
Wind risk 9/10 · Severe
- Chance of severe wind over 30 yrs
- 99.0%
Air-quality risk 1/10 · Minimal
- Unhealthy air days now
- 0 days/yr
- Unhealthy air days in 30 yrs
- 0 days/yr
Risk factors via First Street. Map © Google.
Why this score? — see what drove the B- grade
The composite is a weighted blend of 9 inputs, each scored 0–100. Each bar is that input's sub-score; the figure is the points it added to the 100-point composite (weight × sub-score).
- Cash flow +30.0/30.0
- 1% rule +10.0/10.0
- DSCR +10.0/10.0
- ARV discount +7.5/15.0
- Schools +3.6/10.0
- Livability +3.6/5.0
- Rent growth +2.5/5.0
- Condition / age +2.5/5.0
- Appreciation +0.0/10.0
$79,000
🖨 Deal sheet 📄 Offer letter ✓ Due diligence
Listing remarks
With fresh exterior paint and new carpet, this home is ready for you to complete the updates. Located on approx 3/4 acre, there's plenty of space to do your thing. There's also a large shop. This property has so much potential, take a look today!
Key facts
- New carpet
- Fresh exterior paint
- Approx 3/4 acre
Tags
Property features AI
Exterior
- Utilities: Public water; Public sewer
- Home design: Single-story; Resale property; Pillar/post/pier foundation
- Construction: Lap siding exterior; Composition/Shingle roof; Year built source: assessor
- Exterior features: Storage; Workshop; City lot; approximately half to one acre; City street frontage
Interior
- Flooring: Carpet
- Bathrooms: 2 full bathrooms
- Heating & cooling: Heating: see remarks
- Interior features: Carpet flooring; Other interior features (see remarks)
- Laundry & utility: Laundry details: see remarks; Water heater
Neighborhood map
What this means for you Summary
Snapshot
- This is a 4-bed/2.0-bath single-family listed at $79k.
Deal economics
- At list price, monthly cash flow is $697 ($8k/yr) — positive.
- The deal already cash-flows at list — no discount required.
- Meets the 1% rule at list price ($2k rent vs $79k).
- Recommended offer: $77k (3.0% below list) — sets the bar for market timing.
- Cap rate 16.9% vs local median 2.8% in Edna — top-decile yield for the area; either an underpriced asset or a hidden risk that comps aren't pricing in. Stress-test before assuming the spread holds.
Location & tenants
- Location reads 72/100 on livability (#254 in TX) — a middle-class / working-renter tenant base. Strengths: cost of living A+, housing A+, health & safety A+; Watch: schools D+, amenities F, commute F.
- Edna ISD (town): math 45% / reading 39% proficiency, ranked #335 of 826 in TX (top 41%) — families likely to look elsewhere, expect single-tenant / working-renter base with shorter leases.
- Market conditions: 73 active listings in the ZIP.
Forward outlook
- Local home prices are declining (-3.0%/yr); year-one equity from $546 of loan paydown is wiped out by about $2k of value loss. Plan a longer hold.
- Jackson County population projected at +28% by 2050 — long-run rental-demand tailwind backs the buy-and-hold thesis.
- At projected returns (-3.0% appreciation + 3.0% rent growth), your $22k cash investment doubles in ~4 years — after that, you're playing with house money.
Negotiation context
- It's been on market 31 days — a 3% lower offer ($77k) is reasonable based on typical stale-listing flexibility.
- Current owner paid $36k; list at $79k implies a 119% gain — meaningful room to come down on a strong offer.
Risks & watch-outs
- Watch-outs: property tax is 2.7% of price.
- Climate carrying-cost: severe wind risk, 99% chance of damaging wind over 30y; extreme-heat days projected 7→21/yr by 2055 (HVAC capex compounding) — expect insurance premiums to compound above CPI over the hold.
Questions for the listing agent
- It's been on market 31 days. Have you received any prior offers? Is the seller open to a 3% concession, seller financing, or rate buy-down credit?
- Built in 1973 — when were the roof, HVAC, electrical panel, plumbing, and water heater last replaced?
- Property tax is high relative to price — has the assessment been appealed recently, and will the sale trigger a re-assessment?
- Is there a deadline driving the sale (1031 exchange, divorce, estate, relocation)? That informs how much negotiation room exists.
- Schools are D-rated, which usually means shorter tenancies and higher turnover. Who's the typical renter profile here, and what's been the actual vacancy rate?
- What's the average days-on-market for RENTAL listings here right now (not sales)? A rising rental-DOM trend means longer vacancies and softer asking-rent achievability than the comps imply.
- What's the recent tenant-quality profile in this submarket — average credit score on applications, eviction rate, late-payment / NSF rate, and stable-employment percentage? A property-management company in the area should have these aggregated.
- How much new for-sale + rental construction is in the pipeline within 1–3 miles? Heavy new supply typically softens prices + rents 12–24 months out; constrained supply supports both.
Investment metrics
- 1% rule
- 2.12% ✓
- Cap rate
- 16.88%
- Cash-on-cash
- 37.81%
- DSCR
- 2.68
- GRM
- 3.9
CMA / ARV
- ARV (on-the-fly)
- $336,720
- Comps found
- 3
Show comp detail 3 sales within ~0.75 mi
| Address | Dist | Beds/Ba | Sqft | Sold | Price | $/sf | Match |
|---|---|---|---|---|---|---|---|
| 402 Sunset Dr | 0.43mi | 4/3.0 | 3,028 (+3%) | 2mo | $450,000 | $149 | 69 |
| 801 Fulton St | 0.37mi | 4/2.5 | 2,824 (-4%) | 22mo | $275,000 | $97 | 56 |
| 509 Hanover St | 0.65mi | 3/2.5 (-1) | 3,208 (+10%) | 3mo | $370,000 | $115 | 44 |
Match score weights: distance 35% · size 25% · config 20% · recency 20%. Top-matched comps best support the ARV.
Projected returns pro-forma
-3.0% appreciation · 3.0% rent growth · sell at horizon
- IRR
- 33.9%
- Equity multiple
- 2.43×
- Total profit
- $31,667
- Equity at exit
- $11,779
- IRR
- 40.8%
- Equity multiple
- 4.84×
- Total profit
- $85,039
- Equity at exit
- $6,830
Cash invested: $22,120 (down + closing). Projections, not guarantees.
Landlord ↔ Tenant lean methodology
- Overall (STATE)
- 87 Strongly Landlord-Friendly
- State Texas
- 87 Strongly Landlord-Friendly · R+5
- County
- — inherits STATE
- City
- — inherits STATE
ZIP-level market 77957
- Home prices YoY
- -25.8%
- Active inventory
- 73
- Price-to-rent
- 3.9×
Monthly cashflow live
- Estimated rent
- $1,673 medium interval (Pro) →
- Mortgage (P&I)
- −$414
- Tax from tax record
- −$177 /mo · $2,129/yr
- Insurance
- −$33
- HOA
- −$0
- Vacancy / Maint / Mgmt
- −$351
- Net cashflow
- $697
Break-even live
UW: 25.0% down · 7.5% · 30yr · 1.5% tax · 5.0% vac · 8.0% maint · 8.0% mgmt
Financing live
Cash to close
- Down payment
- $19,750
- Closing costs
- $2,370
- Reserves months
- —
- Total cash needed
- —
Loan-product check · same deal, 3 products live
Conventional
25% down · 7.5% · 30yr
- Down + closing
- —
- Monthly P&I
- —
- Monthly cashflow
- —
- DSCR
- —
- Eligible?
- —
Personal DTI + credit; lowest rate.
DSCR
20% down · 8.5% · 30yr
- Down + closing
- —
- Monthly P&I
- —
- Monthly cashflow
- —
- DSCR
- —
- Eligible?
- —
No personal income docs; deal must DSCR.
Hard money
10% down · 12.0% · 12mo
- Down + closing
- —
- Monthly P&I
- —
- Monthly cashflow
- —
- DSCR
- —
- Eligible?
- —
Short-term bridge; refi at stabilization.
Listing history 16 events
-
2026-06-18days on market $79,000 Active 31 DOM
-
2026-06-17days on market $79,000 Active 30 DOM
-
2026-06-16days on market $79,000 Active 29 DOM
-
2026-06-15days on market $79,000 Active 28 DOM
-
2026-06-13days on market $79,000 Active 26 DOM
-
2026-06-12days on market $79,000 Active 25 DOM
-
2026-06-09days on market $79,000 Active 22 DOM
-
2026-06-08days on market $79,000 Active 21 DOM
-
2026-06-08days on market $79,000 Active 20 DOM
-
2026-06-07days on market $79,000 Active 19 DOM
-
2026-06-03days on market $79,000 Active 16 DOM
-
2026-06-02days on market $79,000 Active 15 DOM
-
2026-06-01days on market $79,000 Active 14 DOM
-
2026-05-31days on market $79,000 Active 13 DOM
-
2026-05-18$79,000 Active
-
2009-12-09soldstatus $36,000
ⓘ Source: listings_history table (triggers on properties + properties_extension) + one-shot
backfill from property_details.listing_events for pre-trigger history.
Tax reassessment forecast TX · Resets to sale price
- Current annual tax
- $2,129 · $177/mo
- Projected year-2 tax
- $2,129 · $177/mo
- Expected delta
- $0/yr ($0/mo · 0.0%)
ⓘ Screening estimate from a state-policy table — verify with the county assessor before closing.
Climate risk First Street
- Flood 3/10 Moderate FEMA zone X (unshaded) · 20% chance over 30 yrs
- Wildfire 2/10 Low
- Heat 9/10 Extreme 7 d/yr ≥110°F today · 21 d/yr by 30 yrs out
- Wind 9/10 Extreme 99% chance of damaging wind over 30 yrs
- Air quality 1/10 Low 0 unhealthy d/yr today · 0 by 30 yrs out
Nearby sold comps map
Loading sold comps map…
Walkable amenities ~0.75 mi
Loading nearby amenities…
Taxation est. · year 1
- Rental income
- $20,076
- − Mortgage interest
- −$4,425
- − Property taxes
- −$2,129
- − Insurance
- −$395
- − Repairs & maintenance
- −$1,606
- − Management
- −$1,606
- − Depreciation
- −$2,298
- Taxable income
- $7,616
- Est. tax owed @ 24.0%
- −$1,828
- After-tax cash flow
- $6,537/yr
For passive investors: Depreciation is non-cash, so a rental often shows a tax loss while cash-flowing — sheltering income. Rental losses are passive: they offset passive income freely, and up to $25,000/yr can offset ordinary (W-2) income if you actively participate and your MAGI is under $100k (phasing out to $0 by $150k); unused losses carry forward. On sale, claimed depreciation is recaptured at up to 25%, and gains may owe capital-gains tax (a 1031 exchange can defer both). Figures are a year-1 estimate at your 24.0% rate — not tax advice; consult a CPA.
Schools (NCES district)
- District
- Edna ISD
- NCES district ID
- 4818210
- Math proficiency
- 45% ▲ 3.00%
- Reading proficiency
- 39% ▼ -3.00%
- Median HH income
- $47,887
- Composite
- 35.99/100
- National rank
- #4793
- State rank
- #335 of 826 in TX
Livability — Edna
- Score
- 72/100
- State rank
- #254
- US rank
- #5996
Category grades
Schools grade is shown separately in the Schools card above.
Census & demographics
- Census place
- Edna, TX
- Population (ZIP)
- 8,919
Population outlook (Jackson County) Hauer SSP2
- Today (2025)
- 16,579 people
- By 2030
- 17,480 · +5.4%
- By 2040
- 19,328 · +16.6%
- By 2050
- 21,182 · +27.8%
- By 2075
- 25,781 · +55.5%
- By 2100
- 28,184 · +70.0%
Race, ethnicity, and origin ACS 2023
- Neighborhood character
- Majority White (60%)
- Race & ethnicity
- White 60% Hispanic / Latino 30% Two or more races 10% Black 8%
- Hispanic origin (detail)
- Mexican 26%
- Common ancestry
- Lithuanian 3% Romanian 2% Iranian 1%
- Foreign-born
- 5% · Canada
- Languages at home
- 82% English-only · Spanish 17% Other Indo-European 1%
Political lean MEDSL · Jackson
- 2024 margin
- Solid R (+70.8) · D 14.3% · R 85.1%
- 2008→2024 swing
- -22.9pp toward R · 2008: -47.9pp · 2024: -70.8pp
- All cycles
- 2024: R+70.8 2020: R+66.2 2016: R+63.7 2012: R+56.5 2008: R+47.9
Not yet ingested
- Civics
- —
Market trends
- HPI YoY
- ▼ -58.92%
- Current HPI
- 169.9334
- Rent YoY
- —
- Metro
- —
- State GDP YoY
- ▲ 3.95%
- F500 in state
- 110
Industry mix (Fortune 500 HQ in TX)
| Industry | F500 HQs | Revenue |
|---|---|---|
| Energy | 16 | $1,198B |
|
||
| Technology | 5 | $198B |
|
||
| Engineering / Construction | 4 | $72B |
|
||
| Energy Services | 3 | $60B |
|
||
| Utilities | 3 | $41B |
|
||
| Healthcare | 2 | $330B |
|
||
Price history
+119.4% since first listed2 events — show timeline
- 2026-05-18 Listed $79,000 CTXMLS
- 2009-12-09 Sold (Public Records) $36,000 Public Records
Property tax history
+12.3%/yrLatest (2025): $2,129 · +10.4% YoY. Source: county tax records.
Cash-flow waterfall
monthlySold comps — $/sqft
last 12 mo · ≤1 miLoading sold comps…