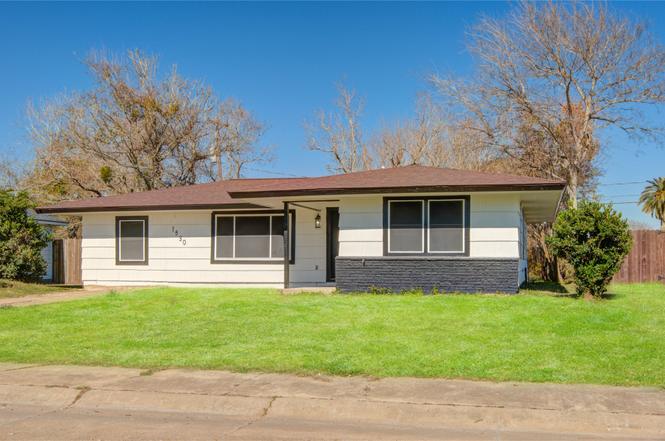
1530 W 10th St · Freeport, TX
Flood risk 8/10 · Major
- FEMA flood zone
- X (unshaded)
- Chance of flooding over 30 yrs
- 0.6%
- Est. flood insurance / yr
- $507 – $1,088
Fire risk 5/10 · Moderate
- Est. fire insurance / yr
- $1,222 – $2,270
Heat risk 10/10 · Severe
- Hot days now (above 113°F)
- 7 days/yr
- Hot days in 30 yrs
- 25 days/yr
Wind risk 9/10 · Severe
- Chance of severe wind over 30 yrs
- 99.0%
Air-quality risk 3/10 · Minor
- Unhealthy air days now
- 2 days/yr
- Unhealthy air days in 30 yrs
- 2 days/yr
Risk factors via First Street. Map © Google.
Why this score? — see what drove the D grade
The composite is a weighted blend of 9 inputs, each scored 0–100. Each bar is that input's sub-score; the figure is the points it added to the 100-point composite (weight × sub-score).
- Cash flow +17.2/30.0
- DSCR +5.4/10.0
- ARV discount +4.4/15.0
- Schools +3.7/10.0
- 1% rule +3.3/10.0
- Livability +2.9/5.0
- Rent growth +2.5/5.0
- Condition / age +2.5/5.0
- Appreciation +0.0/10.0
$184,900
🖨 Deal sheet (PDF) 📄 Offer letter ✓ Due diligence
Listing remarks
Beautifully renovated 4 bedroom, 2 bath home featuring a modern kitchen with quartz countertops and a spacious picture window that fills the living area with natural light. Fresh updates throughout give the home a clean, contemporary feel.
Key facts
- Quartz countertops
- Natural light
- Fresh updates
Tags
Neighborhood map
What this means for you Summary
Snapshot
- This is a 4-bed/1.0-bath single-family listed at $185k.
Deal economics
- At list price, monthly cash flow is $65 ($784/yr) — positive.
- The deal already cash-flows at list — no discount required.
- To meet the 1% rule (rent ≥ 1% of price), the offer needs to be $154k (16.8% below list).
- Recommended offer: $154k (16.8% below list) — sets the bar for 1% rule.
- Cap rate 7.1% vs local median 4.1% in Freeport — top-decile yield for the area; either an underpriced asset or a hidden risk that comps aren't pricing in. Stress-test before assuming the spread holds.
Location & tenants
- Location reads 58/100 on livability (#1,205 in TX) — a working-class tenant base; expect higher turnover. Strengths: cost of living A+, housing A+; Watch: crime D, amenities F, commute F.
- Brazosport ISD (suburban): math 43% / reading 41% proficiency, ranked #305 of 826 in TX (top 37%) — families likely to look elsewhere, expect single-tenant / working-renter base with shorter leases.
- Zoned schools: Freeport El (579 students, 89% FRL); O'Hara Lanier Middle (math 41% / reading 29%, grade F, #842 of 1,662 statewide, top 51%, 340 students, 92% FRL); Brazosport H S (math 40% / reading 27%, grade F, #1,011 of 1,632 statewide, top 63%, 948 students, 78% FRL) — zoned schools average 86% FRL vs 53% district-wide (33 pts higher); higher-poverty schools than district average — tighter screening recommended.
- Market conditions: 593 active listings in the ZIP; 3 comparable units currently listed for rent nearby; rentals lingering (median 46d on market — plan ~5-8 weeks vacancy on turnover, expect pricing pressure); 100% of comp listings sitting > 30 days — soft ceiling on asking rent; 3,960 units permitted in Brazoria County in 2024 (593 in 5+ unit buildings).
Forward outlook
- Local home prices are declining (-3.0%/yr); year-one equity from $1k of loan paydown is wiped out by about $6k of value loss. Plan a longer hold.
- Brazoria County population projected at +44% by 2050 — long-run rental-demand tailwind backs the buy-and-hold thesis.
Negotiation context
- It's been on market 89 days — a 6% lower offer ($174k) is reasonable based on typical stale-listing flexibility.
Risks & watch-outs
- Watch-outs: flood insurance adds $66/mo; built in 1955 — expect roof / HVAC / electrical / plumbing capex.
- Climate carrying-cost: severe flood risk; severe wind risk, 99% chance of damaging wind over 30y; moderate wildfire risk; extreme-heat days projected 7→25/yr by 2055 (HVAC capex compounding) — expect insurance premiums to compound above CPI over the hold.
Questions for the listing agent
- It's been on market 89 days. Have you received any prior offers? Is the seller open to a 17% concession, seller financing, or rate buy-down credit?
- Built in 1955 — when were the roof, HVAC, electrical panel, plumbing, and water heater last replaced?
- What's the actual annual flood-insurance premium (NFIP or private), and is the property in a SFHA with mandatory coverage?
- Why hasn't it sold? Are there any deal-killer items the seller is aware of (foundation, flood, title, zoning, code violations)?
- Is there a deadline driving the sale (1031 exchange, divorce, estate, relocation)? That informs how much negotiation room exists.
- Schools are F-rated, which usually means shorter tenancies and higher turnover. Who's the typical renter profile here, and what's been the actual vacancy rate?
- Crime grade is D in this area — have there been break-ins, vandalism, or insurance claims at this property in the last 3 years? What carrier currently insures it and at what premium?
- The area grade is low — what's the realistic commute time and amenity access for the typical tenant pool here? Any planned neighborhood developments (good or bad) we should know about?
- What's the average days-on-market for RENTAL listings here right now (not sales)? A rising rental-DOM trend means longer vacancies and softer asking-rent achievability than the comps imply.
- What's the recent tenant-quality profile in this submarket — average credit score on applications, eviction rate, late-payment / NSF rate, and stable-employment percentage? A property-management company in the area should have these aggregated.
- How much new for-sale + rental construction is in the pipeline within 1–3 miles? Heavy new supply typically softens prices + rents 12–24 months out; constrained supply supports both.
Investment metrics
- 1% rule
- 0.83% ✗
- Cap rate
- 7.15%
- Cash-on-cash
- 3.05%
- DSCR
- 1.14
- GRM
- 10.0
CMA / ARV
- ARV (on-the-fly)
- $172,980
- Comps found
- 12
Show comp detail 12 sales within ~0.75 mi
| Address | Dist | Beds/Ba | Sqft | Sold | Price | $/sf | Match |
|---|---|---|---|---|---|---|---|
| 1530 W 10th St | 0.00mi | 4/2.0 | 1,453 (+4%) | 1mo | $184,900 | $127 | 88 |
| 1427 W 7th St | 0.19mi | 3/2.0 (-1) | 1,368 (-2%) | 1mo | $145,000 | $106 | 78 |
| 1502 W 11th St | 0.10mi | 3/2.0 (-1) | 1,293 (-7%) | 5mo | $179,999 | $139 | 70 |
| 1510 W 11th St | 0.08mi | 3/1.5 (-1) | 1,201 (-14%) | 2mo | $159,000 | $132 | 64 |
| 923 W 9th St | 0.54mi | 3/2.0 (-1) | 1,391 (-0%) | 4mo | $197,495 | $142 | 62 |
| 1219 W 6th St | 0.38mi | 3/1.5 (-1) | 1,420 (+2%) | 13mo | $125,000 | $88 | 62 |
| 1118 W 11th St | 0.37mi | 4/2.0 | 1,520 (+9%) | 4mo | $178,000 | $117 | 60 |
| 1026 W 5th St | 0.56mi | 3/1.0 (-1) | 1,392 (-0%) | 10mo | $89,900 | $65 | 60 |
| 922 W 11th St | 0.54mi | 3/2.0 (-1) | 1,383 (-1%) | 8mo | $149,900 | $108 | 58 |
| 826 W 12th St | 0.62mi | 4/2.0 | 1,430 (+2%) | 11mo | $210,000 | $147 | 54 |
| 930 W 6th St | 0.59mi | 4/2.0 | 1,451 (+4%) | 11mo | $180,000 | $124 | 53 |
| 1115 W 8th St | 0.40mi | 3/1.5 (-1) | 1,509 (+8%) | 13mo | $165,000 | $109 | 50 |
Match score weights: distance 35% · size 25% · config 20% · recency 20%. Top-matched comps best support the ARV.
Projected returns pro-forma
-3.0% appreciation · 3.0% rent growth · sell at horizon
- IRR
- -13.9%
- Equity multiple
- 0.50×
- Total profit
- $-25,855
- Equity at exit
- $27,569
- IRR
- -5.2%
- Equity multiple
- 0.66×
- Total profit
- $-17,379
- Equity at exit
- $15,987
Cash invested: $51,772 (down + closing). Projections, not guarantees.
Landlord ↔ Tenant lean methodology
- Overall (STATE)
- 87 Strongly Landlord-Friendly
- State Texas
- 87 Strongly Landlord-Friendly · R+5
- County
- — inherits STATE
- City
- — inherits STATE
ZIP-level market 77541
- Home prices YoY
- -29.3%
- Active inventory
- 593
- Price-to-rent
- 10.0×
Monthly cashflow live
- Estimated rent
- $1,539 medium interval (Pro) →
- Mortgage (P&I)
- −$970
- Tax from tax record
- −$38 /mo · $450/yr
- Insurance
- −$77
- Flood insurance flood zone
- −$66 /mo · $798/yr
- HOA
- −$0
- Vacancy / Maint / Mgmt
- −$323
- Net cashflow
- $65
Break-even live
Sensitivity live
| Price | -10% $170 | -5% $118 | +0% $65 | +5% $13 | +10% $-39 |
|---|---|---|---|---|---|
| Rent | -10% $-56 | -5% $5 | +0% $65 | +5% $126 | +10% $187 |
| Rate | -1.0pp $158 | -0.5pp $112 | base $65 | +0.5pp $17 | +1.0pp $-31 |
UW: 25.0% down · 7.5% · 30yr · 1.5% tax · 5.0% vac · 8.0% maint · 8.0% mgmt
Financing live
Cash to close
- Down payment
- $46,225
- Closing costs
- $5,547
- Reserves months
- —
- Total cash needed
- —
Loan-product check · same deal, 3 products live
Conventional
25% down · 7.5% · 30yr
- Down + closing
- —
- Monthly P&I
- —
- Monthly cashflow
- —
- DSCR
- —
- Eligible?
- —
Personal DTI + credit; lowest rate.
DSCR
20% down · 8.5% · 30yr
- Down + closing
- —
- Monthly P&I
- —
- Monthly cashflow
- —
- DSCR
- —
- Eligible?
- —
No personal income docs; deal must DSCR.
Hard money
10% down · 12.0% · 12mo
- Down + closing
- —
- Monthly P&I
- —
- Monthly cashflow
- —
- DSCR
- —
- Eligible?
- —
Short-term bridge; refi at stabilization.
Rent comps 3 comps
| Address | Beds | Baths | Sqft | Rent | $/sqft | DOM | Units | Dist |
|---|---|---|---|---|---|---|---|---|
| 310 Yaupon St Unit ST402 Freeport, TX | 3.0 | 1.0 | 1050 | $1,150 | $1.10 | 45d | 1 | 0.41mi |
| 527 W 8th St Freeport, TX | 3.0 | 1.0 | 950 | $995 | $1.05 | 45d | 1 | 0.88mi |
| 102 North Avenue C Unit C Freeport, TX | 4.0 | 2.0 | 1500 | $1,550 | $1.03 | 45d | 1 | 1.00mi |
Listing history 7 events
-
2026-04-22status Pending
-
2026-04-13status Pending
-
2026-04-08price $184,900
-
2026-02-23price $194,900
-
2026-01-22$199,900 Active
-
2025-05-16soldstatus
-
1977-01-14soldstatus
ⓘ Source: listings_history table (triggers on properties + properties_extension) + one-shot
backfill from property_details.listing_events for pre-trigger history.
Tax reassessment forecast TX · Resets to sale price
- Current annual tax
- $450 · $38/mo
- Projected year-2 tax
- $3,384 · $282/mo
- Expected delta
- +$2,933/yr (+$244/mo · 651.2%)
ⓘ Screening estimate from a state-policy table — verify with the county assessor before closing.
Climate risk First Street
- Flood 8/10 Severe FEMA zone X (unshaded) · 60% chance over 30 yrs
- Wildfire 5/10 Major
- Heat 10/10 Extreme 7 d/yr ≥113°F today · 25 d/yr by 30 yrs out
- Wind 9/10 Extreme 99% chance of damaging wind over 30 yrs
- Air quality 3/10 Moderate 2 unhealthy d/yr today · 2 by 30 yrs out
Nearby sold comps map
Loading sold comps map…
Walkable amenities ~0.75 mi
Loading nearby amenities…
Taxation est. · year 1
- Rental income
- $18,471
- − Mortgage interest
- −$10,357
- − Property taxes
- −$450
- − Insurance
- −$1,722
- − Repairs & maintenance
- −$1,478
- − Management
- −$1,478
- − Depreciation
- −$5,379
- Taxable loss
- −$2,393
- Est. tax savings @ 24.0%
- +$574
- After-tax cash flow
- $1,358/yr
For passive investors: Depreciation is non-cash, so a rental often shows a tax loss while cash-flowing — sheltering income. Rental losses are passive: they offset passive income freely, and up to $25,000/yr can offset ordinary (W-2) income if you actively participate and your MAGI is under $100k (phasing out to $0 by $150k); unused losses carry forward. On sale, claimed depreciation is recaptured at up to 25%, and gains may owe capital-gains tax (a 1031 exchange can defer both). Figures are a year-1 estimate at your 24.0% rate — not tax advice; consult a CPA.
Schools (NCES district)
- District
- Brazosport ISD
- NCES district ID
- 4811190
- Math proficiency
- 43% ▼ -6.00%
- Reading proficiency
- 41% ▼ -2.00%
- Median HH income
- $57,024
- Composite
- 36.84/100
- National rank
- #4557
- State rank
- #305 of 826 in TX
Livability — Freeport
- Score
- 58/100
- State rank
- #1205
- US rank
- #21044
Category grades
Schools grade is shown separately in the Schools card above.
Census & demographics
- Census place
- Freeport, TX
- County
- Brazoria County · 374,982 people
- City population
- 16,996
- Metro
- Houston-The Woodlands-Sugar Land, TX
- Population (ZIP)
- 16,996
- Household income
- $66,507
- Rent vs Own
- Severe rent burden
- 354.0
Population outlook (Brazoria County) Hauer SSP2
- Today (2025)
- 420,414 people
- By 2030
- 457,585 · +8.8%
- By 2040
- 532,232 · +26.6%
- By 2050
- 605,399 · +44.0%
- By 2075
- 779,358 · +85.4%
- By 2100
- 883,759 · +110.2%
Race, ethnicity, and origin ACS 2023
- Neighborhood character
- Diverse neighborhood (Simpson 0.62)
- Race & ethnicity
- Hispanic / Latino 47% White 38% Two or more races 23% Black 12%
- Hispanic origin (detail)
- Mexican 42%
- Common ancestry
- Romanian 1% Italian 1% Lithuanian 1%
- Foreign-born
- 12% · Canada
- Languages at home
- 71% English-only · Spanish 29%
Political lean MEDSL · Brazoria
- 2024 margin
- R (+19.7) · D 39.5% · R 59.2% · Other 1.3%
- 2008→2024 swing
- +9.9pp toward D · 2008: -29.6pp · 2024: -19.7pp
- All cycles
- 2024: R+19.7 2020: R+18.2 2016: R+24.6 2012: R+34.2 2008: R+29.6
Not yet ingested
- Civics
- —
Market trends
- HPI YoY
- ▼ -110.12%
- Current HPI
- 265.9301
- Rent YoY
- —
- Metro
- Houston-The Woodlands-Sugar Land, TX
- State GDP YoY
- ▲ 3.95%
- F500 in state
- 110
Industry mix (Fortune 500 HQ in TX)
| Industry | F500 HQs | Revenue |
|---|---|---|
| Energy | 16 | $1,198B |
|
||
| Technology | 5 | $198B |
|
||
| Engineering / Construction | 4 | $72B |
|
||
| Energy Services | 3 | $60B |
|
||
| Utilities | 3 | $41B |
|
||
| Healthcare | 2 | $330B |
|
||
Price history
-7.5% since first listed7 events — show timeline
- 2026-04-22 Pending — HARMLS
- 2026-04-13 Pending — HARMLS
- 2026-04-08 Price Changed $184,900 HARMLS
- 2026-02-23 Price Changed $194,900 HARMLS
- 2026-01-22 Listed $199,900 HARMLS
- 2025-05-16 Sold (Public Records) — Public Records
- 1977-01-14 Sold (Public Records) — Public Records
Property tax history
-6.4%/yrLatest (2025): $450 · +18.0% YoY. Source: county tax records.
Cash-flow waterfall
monthlySold comps — $/sqft
last 12 mo · ≤1 miLoading sold comps…