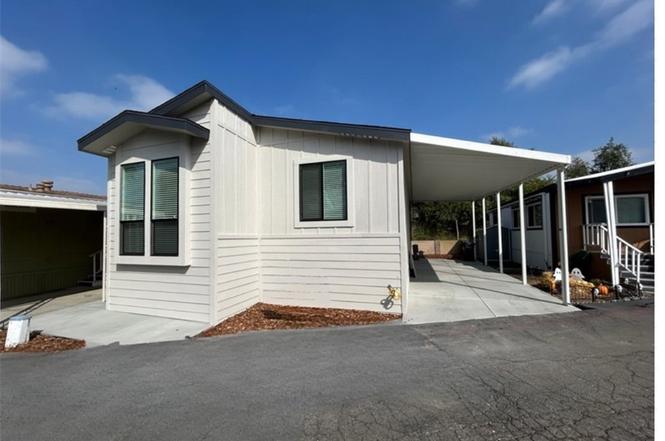
17261 Gothard St #13 · Huntington Beach, CA
Flood risk 10/10 · Severe
- FEMA flood zone
- X
- Chance of flooding over 30 yrs
- 0.99%
- Est. flood insurance / yr
- $507 – $1,088
Fire risk 1/10 · Minimal
- Est. fire insurance / yr
- $659 – $1,223
Heat risk 5/10 · Moderate
- Hot days now (above 85°F)
- 7 days/yr
- Hot days in 30 yrs
- 23 days/yr
Wind risk 1/10 · Minimal
- Chance of severe wind over 30 yrs
- —
Air-quality risk 4/10 · Minor
- Unhealthy air days now
- 5 days/yr
- Unhealthy air days in 30 yrs
- 7 days/yr
Risk factors via First Street. Map © Google.
Why this score? — see what drove the C+ grade
The composite is a weighted blend of 9 inputs, each scored 0–100. Each bar is that input's sub-score; the figure is the points it added to the 100-point composite (weight × sub-score).
- Cash flow +30.0/30.0
- 1% rule +10.0/10.0
- DSCR +10.0/10.0
- Schools +5.5/10.0
- Livability +3.4/5.0
- Rent growth +2.8/5.0
- Condition / age +2.5/5.0
- ARV discount +0.0/15.0
- Appreciation +0.0/10.0
$174,900
🖨 Deal sheet 📄 Offer letter ✓ Due diligence
Listing remarks
Motivated seller. This brand-new manufactured home is located in senior park in Huntington Beach. Centrally located near grocery stores and just a quick walk to central park. Also 3 miles from the Huntington Beach Pier. Home features 2 bedrooms, 1 bath with tile walk in shower. open floor plan, 9' ceilings, wood blinds on every energy efficient double pane window, stunning kitchen with hard surface Island and counter tops, stainless steel refrigerator, gas range, dishwasher, cabinet built in microwave, recessed lighting, indoor laundry hookups, laminate flooring, carpeted bedrooms, 759 sq ft living space, a must see! Community features pool with serene area to host and relax.
Key facts
- Open floor plan
- Centrally located
- Hard surface island
Tags
Property features AI
Finance
- Other: Lot features: 0-1 unit/acre; Mobile dimensions approximately 22' x 35'; Parcel number available; Directions: Off Gothard between Warner and Slater
- Financial info: Land lease of $1,950 per month (park-provided)
- HOA & community: Senior community; Community features include biking and street lighting; Park name: Beachview MHP; Manager approval required; Pets allowed with breed restrictions
Exterior
- Parking: Located in Beachview MHP
- Utilities: Public sewer; District/public water
- Home design: Mobile home (Goodyear model); Double body type; Turnkey condition; Single-story
- Construction: Shingle roof; Mobile home remains on site; Built by builder (year source: Builder)
- Exterior features: Community pool
Interior
- Bathrooms: 1 full bathroom
- Interior features: One-level home; Front entry
- Laundry & utility: In-unit laundry in a closet/individual room
Neighborhood map
What this means for you Summary
Snapshot
- This is a 2-bed/1.0-bath manufactured listed at $175k.
Deal economics
- At list price, monthly cash flow is $829 ($10k/yr) — positive.
- The deal already cash-flows at list — no discount required.
- Meets the 1% rule at list price ($3k rent vs $175k).
- Recommended offer: $154k (12.0% below list) — sets the bar for market timing.
- Cap rate 12.4% vs local median 1.6% in Huntington Beach — top-decile yield for the area; either an underpriced asset or a hidden risk that comps aren't pricing in. Stress-test before assuming the spread holds.
Location & tenants
- Location reads 67/100 on livability (#306 in CA) — a middle-class / working-renter tenant base. Strengths: employment A+, commute A-, schools B+; Watch: amenities C-, cost of living F, health & safety F.
- Ocean View (suburban): math 57% / reading 63% proficiency, ranked #207 of 1,400 in CA (top 15%) — acceptable for families but not a draw, mixed tenant base, ~2y average lease.
- Market conditions: Rents rising (+1.2%/yr); 75 active listings in the ZIP; 40 comparable units currently listed for rent nearby; rentals leasing fast (median 1d on market — plan ~1-2 weeks tenant-placement turnaround); solid renter incomes; 6,974 units permitted in Orange County in 2024 (3,839 in 5+ unit buildings).
- This rent runs 30% of the median local income ($105k/yr) — at the standard rent-burdened threshold; future hikes will face affordability resistance.
Forward outlook
- Local home prices are declining (-3.0%/yr); year-one equity from $1k of loan paydown is wiped out by about $5k of value loss. Plan a longer hold.
- Orange County population projected at +14% by 2050 — modest demand growth; plan on rents tracking national, not racing it.
- At projected returns (-3.0% appreciation + 1.2% rent growth), your $49k cash investment doubles in ~7 years — after that, you're playing with house money.
Negotiation context
- It's been on market 191 days — a 12% lower offer ($154k) is reasonable based on typical stale-listing flexibility.
- 2 sale attempts; this cycle's ask has dropped $20k (10%) from the opening price — seller is motivated, your offer sets the floor, not the list.
Risks & watch-outs
- Watch-outs: flood insurance adds $66/mo.
- Climate carrying-cost: severe flood risk; extreme-heat days projected 7→23/yr by 2055 (HVAC capex compounding) — expect insurance premiums to compound above CPI over the hold.
Questions for the listing agent
- It's been on market 191 days. Have you received any prior offers? Is the seller open to a 12% concession, seller financing, or rate buy-down credit?
- What's the actual annual flood-insurance premium (NFIP or private), and is the property in a SFHA with mandatory coverage?
- Why hasn't it sold? Are there any deal-killer items the seller is aware of (foundation, flood, title, zoning, code violations)?
- Is there a deadline driving the sale (1031 exchange, divorce, estate, relocation)? That informs how much negotiation room exists.
- Schools are B-rated — typically a magnet for longer-tenancy family renters. What's the average tenant stay here, and is there a school-zone premium baked into asking?
- What's the average days-on-market for RENTAL listings here right now (not sales)? A rising rental-DOM trend means longer vacancies and softer asking-rent achievability than the comps imply.
- What's the recent tenant-quality profile in this submarket — average credit score on applications, eviction rate, late-payment / NSF rate, and stable-employment percentage? A property-management company in the area should have these aggregated.
- How much new for-sale + rental construction is in the pipeline within 1–3 miles? Heavy new supply typically softens prices + rents 12–24 months out; constrained supply supports both.
Investment metrics
- 1% rule
- 1.52% ✓
- Cap rate
- 12.44%
- Cash-on-cash
- 21.94%
- DSCR
- 1.98
- GRM
- 5.5
CMA / ARV
- ARV (on-the-fly)
- $137,379
- Comps found
- 2
Show comp detail 2 sales within ~0.75 mi
| Address | Dist | Beds/Ba | Sqft | Sold | Price | $/sf | Match |
|---|---|---|---|---|---|---|---|
| 17261 Gothard St #60 | 0.00mi | 2/2.0 | 800 (+5%) | 6mo | $145,000 | $181 | 82 |
| 17261 Gothard St Spc 4 | 0.00mi | 1/1.0 (-1) | 700 (-8%) | 10mo | $48,500 | $69 | 74 |
Match score weights: distance 35% · size 25% · config 20% · recency 20%. Top-matched comps best support the ARV.
Projected returns pro-forma
-3.0% appreciation · 1.2% rent growth · sell at horizon
- IRR
- 10.5%
- Equity multiple
- 1.40×
- Total profit
- $19,792
- Equity at exit
- $26,078
- IRR
- 18.0%
- Equity multiple
- 2.36×
- Total profit
- $66,786
- Equity at exit
- $15,122
Cash invested: $48,972 (down + closing). Projections, not guarantees.
Landlord ↔ Tenant lean methodology
- Overall (STATE)
- 18 Strongly Tenant-Friendly
- State California
- 18 Strongly Tenant-Friendly · D+13
- County
- — inherits STATE
- City
- — inherits STATE
ZIP-level market 92647
- Rents YoY
- 1.2%
- Active inventory
- 75
- Price-to-rent
- 5.5×
Monthly cashflow live
- Estimated rent
- $2,663 high interval (Pro) →
- Mortgage (P&I)
- −$917
- Tax est. 1.5%
- −$219 /mo · $2,624/yr
- Insurance
- −$73
- Flood insurance flood zone
- −$66 /mo · $798/yr
- HOA
- −$0
- Vacancy / Maint / Mgmt
- −$559
- Net cashflow
- $829
Break-even live
UW: 25.0% down · 7.5% · 30yr · 1.5% tax · 5.0% vac · 8.0% maint · 8.0% mgmt
Financing live
Cash to close
- Down payment
- $43,725
- Closing costs
- $5,247
- Reserves months
- —
- Total cash needed
- —
Loan-product check · same deal, 3 products live
Conventional
25% down · 7.5% · 30yr
- Down + closing
- —
- Monthly P&I
- —
- Monthly cashflow
- —
- DSCR
- —
- Eligible?
- —
Personal DTI + credit; lowest rate.
DSCR
20% down · 8.5% · 30yr
- Down + closing
- —
- Monthly P&I
- —
- Monthly cashflow
- —
- DSCR
- —
- Eligible?
- —
No personal income docs; deal must DSCR.
Hard money
10% down · 12.0% · 12mo
- Down + closing
- —
- Monthly P&I
- —
- Monthly cashflow
- —
- DSCR
- —
- Eligible?
- —
Short-term bridge; refi at stabilization.
Rent comps 40 comps
| Address | Beds | Baths | Sqft | Rent | $/sqft | DOM | Units | Dist |
|---|---|---|---|---|---|---|---|---|
| 7302 Elk Cir Huntington Beach, CA | 2.0 | 1.0 | 850 | $2,650 | $3.12 | 10d | 1 | 0.28mi |
| 7302 Elk Cir Apt 4 Huntington Beach, CA | 2.0 | 1.0 | 850 | $2,650 | $3.12 | 1d | 1 | 0.28mi |
| 7261 La Mancha Cir Unit C Huntington Beach, CA | 2.0 | 2.0 | 921 | $2,500 | $2.71 | 21d | 1 | 0.49mi |
| 6762 Warner Ave Huntington Beach, CA | 2.0 | 1.5 | 920 | $2,750 | $2.99 | 1d | 6 | 0.50mi |
| 17441 Koledo Ln Apt D Huntington Beach, CA | 2.0 | 2.0 | 900 | $2,375 | $2.64 | 1d | 1 | 0.55mi |
| 7771 Sycamore Dr Unit SYCAMORE7771-C Huntington Beach, CA | 2.0 | 1.5 | 800 | $2,550 | $3.19 | 14d | 1 | 0.56mi |
| 17371 Queens Ln Apt 4 Huntington Beach, CA | 2.0 | 1.0 | 800 | $2,295 | $2.87 | 1d | 1 | 0.58mi |
| 6700 Warner Ave Huntington Beach, CA | 2.0 | 1.0–2.0 | 875 | $3,260 | $3.73 | 1d | 1 | 0.59mi |
| 7701 Warner Ave Unit A004 Huntington Beach, CA | 1.0 | 1.0 | 750 | $2,585 | $3.45 | 1d | 1 | 0.60mi |
| 7701 Warner Ave Apt A11 Huntington Beach, CA | 1.0 | 1.0 | 750 | $2,445 | $3.26 | 10d | 1 | 0.60mi |
| 7701 Warner Ave Unit B024 Huntington Beach, CA | 1.0 | 1.0 | 750 | $2,505 | $3.34 | 18d | 1 | 0.60mi |
| 7701 Warner Ave Unit A010 Huntington Beach, CA | 1.0 | 1.0 | 750 | $2,445 | $3.26 | 15d | 1 | 0.60mi |
| 7701 Warner Ave Unit E081 Huntington Beach, CA | 1.0 | 1.0 | 750 | $2,445 | $3.26 | 1d | 1 | 0.60mi |
| 7701 Warner Ave Apt G115 Huntington Beach, CA | 1.0 | 1.0 | 750 | $2,535 | $3.38 | 1d | 1 | 0.60mi |
| 16682 Goldenwest St Unit 2 Huntington Beach, CA | 2.0 | 2.0 | 900 | $2,800 | $3.11 | 1d | 1 | 0.61mi |
| 17301 Keelson Ln Huntington Beach, CA | 2.0 | 1.0 | 691 | $2,770 | $4.01 | 1d | 5 | 0.62mi |
| 16612 Bartlett Ln Unit 4 Huntington Beach, CA | 2.0 | 1.0 | 1000 | $2,600 | $2.60 | 18d | 1 | 0.67mi |
| 6600 Warner Ave Huntington Beach, CA | 1.0 | 1.0 | 754 | $2,348 | $3.11 | 7d | 4 | 0.68mi |
| 6600 Warner Ave Huntington Beach, OS | 1.0 | 1.0 | 769 | $2,185 | $2.84 | 1d | 2 | 0.68mi |
| 7802 Speer Dr Unit C Huntington Beach, CA | 2.0 | 2.0 | 900 | $2,595 | $2.88 | 1d | 1 | 0.68mi |
| 6600 Warner Ave #138 Huntington Beach, CA | 1.0 | 1.0 | 754 | $2,700 | $3.58 | 18d | 1 | 0.71mi |
| 16761 Viewpoint Ln Huntington Beach, CA | 2.0 | 1.5–2.0 | 938 | $2,863 | $3.05 | 1d | 15 | 0.72mi |
| 6551 Warner Ave Huntington Beach, CA | 1.0 | 1.0 | 770 | $2,520 | $3.27 | 1d | 6 | 0.76mi |
| 7822 Newman Ave Unit B Huntington Beach, CA | 2.0 | 1.5 | 950 | $2,500 | $2.63 | 1d | 1 | 0.77mi |
| 16673 Viewpoint Ln Huntington Beach, CA | 2.0 | 1.0 | 847 | $2,795 | $3.30 | 13d | 1 | 0.79mi |
| 7921 Moonshadow Cir Unit 4 Huntington Beach, CA | 2.0 | 1.0 | 950 | $2,545 | $2.68 | 1d | 1 | 0.81mi |
| 7901 Newman Ave Apt C Huntington Beach, CA | 2.0 | 2.0 | 900 | $2,425 | $2.69 | 1d | 1 | 0.82mi |
| 8081 Holland Dr Huntington Beach, CA | 1.0–2.0 | 1.0 | 790 | $2,878 | $3.64 | 1d | 9 | 0.83mi |
| 6401 Warner Ave Huntington Beach, CA | 2.0–3.0 | 1.0–2.5 | 1145 | $2,460 | $2.15 | 1d | 16 | 0.87mi |
| 17610 Cameron Ln Unit H Huntington Beach, CA | 2.0 | 2.5 | 1020 | $2,700 | $2.65 | 1d | 1 | 0.89mi |
| 17972 Baron Cir Unit 4 Huntington Beach, CA | 2.0 | 1.0 | 876 | $2,695 | $3.08 | 1d | 1 | 0.90mi |
| 7811 Talbert Ave Huntington Beach, CA | 2.0 | 1.0 | 950 | $2,969 | $3.13 | 1d | 1 | 0.90mi |
| 6242 Warner Ave Huntington Beach, CA | 1.0–2.0 | 1.0–2.0 | 830 | $2,925 | $3.52 | 1d | 12 | 0.97mi |
| 8200 Warner Ave Huntington Beach, CA | 2.0 | 1.0 | 937 | $2,800 | $2.99 | 1d | 3 | 0.99mi |
| 18242 Parkview Ln #106 Huntington Beach, CA | 1.0 | 1.0 | 593 | $1,950 | $3.29 | 1d | 1 | 1.04mi |
| 7912 Glencoe Dr Huntington Beach, CA | 3.0 | 1.0 | 1100 | $3,900 | $3.55 | 1d | 1 | 1.06mi |
| 17081 Evergreen Cir Unit D Huntington Beach, CA | 1.0 | 1.0 | 900 | $2,295 | $2.55 | 1d | 1 | 1.07mi |
| 7601 Amazon Dr Unit 2 Huntington Beach, CA | 2.0 | 2.0 | 1000 | $2,650 | $2.65 | 1d | 1 | 1.11mi |
| 7290 Edinger Ave Huntington Beach, CA | 1.0–2.0 | 1.0–2.0 | 941 | $3,824 | $4.06 | 1d | 19 | 1.16mi |
| 17031 Pinehurst Ln Unit B Huntington Beach, CA | 2.0 | 2.0 | 800 | $3,000 | $3.75 | 1d | 1 | 1.17mi |
Listing history 12 events
-
2026-06-18days on market $174,900 Active 191 DOM
-
2026-06-17days on market $174,900 Active 190 DOM
-
2026-06-16days on market $174,900 Active 189 DOM
-
2026-06-15days on market $174,900 Active 188 DOM
-
2026-06-13days on market $174,900 Active 186 DOM
-
2026-06-13days on market $174,900 Active 185 DOM
-
2026-06-10days on market $174,900 Active 183 DOM
-
2026-06-09days on market $174,900 Active 182 DOM
-
2026-06-08days on market $174,900 Active 181 DOM
-
2026-06-07days on market $174,900 Active 180 DOM
-
2026-06-04remarks 687-char remark
-
2026-06-04$174,900 Active 177 DOM
ⓘ Source: listings_history table (triggers on properties + properties_extension) + one-shot
backfill from property_details.listing_events for pre-trigger history.
Climate risk First Street
- Flood 10/10 Extreme FEMA zone X · 99% chance over 30 yrs
- Wildfire 1/10 Low
- Heat 5/10 Major 7 d/yr ≥85°F today · 23 d/yr by 30 yrs out
- Wind 1/10 Low
- Air quality 4/10 Moderate 5 unhealthy d/yr today · 7 by 30 yrs out
Nearby sold comps map
Loading sold comps map…
Walkable amenities ~0.75 mi
Loading nearby amenities…
Taxation est. · year 1
- Rental income
- $31,960
- − Mortgage interest
- −$9,797
- − Property taxes
- −$2,624
- − Insurance
- −$1,672
- − Repairs & maintenance
- −$2,557
- − Management
- −$2,557
- − Depreciation
- −$5,088
- Taxable income
- $7,666
- Est. tax owed @ 24.0%
- −$1,840
- After-tax cash flow
- $8,107/yr
For passive investors: Depreciation is non-cash, so a rental often shows a tax loss while cash-flowing — sheltering income. Rental losses are passive: they offset passive income freely, and up to $25,000/yr can offset ordinary (W-2) income if you actively participate and your MAGI is under $100k (phasing out to $0 by $150k); unused losses carry forward. On sale, claimed depreciation is recaptured at up to 25%, and gains may owe capital-gains tax (a 1031 exchange can defer both). Figures are a year-1 estimate at your 24.0% rate — not tax advice; consult a CPA.
Schools (NCES district)
- District
- Ocean View
- NCES district ID
- 0628140
- Math proficiency
- 57% ▬ 0.00%
- Reading proficiency
- 63% ▼ -1.00%
- Median HH income
- $77,469
- Composite
- 55.3/100
- National rank
- #2725
- State rank
- #207 of 1400 in CA
Livability — Huntington Beach
- Score
- 67/100
- State rank
- #306
- US rank
- #10298
Category grades
Schools grade is shown separately in the Schools card above.
Census & demographics
- Census place
- Huntington Beach, CA
- County
- Orange County · 3,096,323 people
- City population
- 194,835
- Metro
- Los Angeles-Long Beach-Anaheim, CA
- Population (ZIP)
- 59,047
- Household income
- $105,110
- Rent vs Own
- Severe rent burden
- 3065.0
Population outlook (Orange County) Hauer SSP2
- Today (2025)
- 3,477,456 people
- By 2030
- 3,613,117 · +3.9%
- By 2040
- 3,835,945 · +10.3%
- By 2050
- 3,968,736 · +14.1%
- By 2075
- 4,097,053 · +17.8%
- By 2100
- 3,903,633 · +12.3%
Race, ethnicity, and origin ACS 2023
- Neighborhood character
- Diverse neighborhood (Simpson 0.66)
- Race & ethnicity
- White 50% Hispanic / Latino 27% Two or more races 15% Asian 14% Black 2%
- Hispanic origin (detail)
- Mexican 22%
- Common ancestry
- Lithuanian 3% Italian 2% Romanian 2%
- Foreign-born
- 21% · Canada, Vietnam, China
- Languages at home
- 68% English-only · Spanish 15% Vietnamese 6% Other Indo-European 3%
Political lean MEDSL · Orange
- 2024 margin
- Toss-up / Even · D 49.7% · R 47.1% · Other 3.2%
- 2008→2024 swing
- +5.2pp toward D · 2008: -2.6pp · 2024: 2.6pp
- All cycles
- 2024: D+2.6 2020: D+9.0 2016: D+7.7 2012: R+8.3 2008: R+2.6
Not yet ingested
- Civics
- —
Market trends
- HPI YoY
- ▼ -1044.38%
- Current HPI
- 401.8266
- Rent YoY
- ▲ 1.20%
- Metro
- Los Angeles-Long Beach-Anaheim, CA
- State GDP YoY
- ▲ 3.21%
- F500 in state
- 116
Industry mix (Fortune 500 HQ in CA)
| Industry | F500 HQs | Revenue |
|---|---|---|
| Technology | 27 | $1,492B |
|
||
| Financial Services | 3 | $174B |
|
||
| Retail | 3 | $44B |
|
||
| Insurance | 3 | $26B |
|
||
| Media / Entertainment | 2 | $115B |
|
||
| Pharmaceuticals / Biotech | 2 | $62B |
|
||
Price history
-10.3% since first listed5 events — show timeline
- 2026-06-03 Relisted — CRMLS
- 2026-05-14 Listing Removed — CRMLS
- 2026-02-27 Price Changed $174,900 CRMLS
- 2026-01-29 Price Changed $189,000 CRMLS
- 2025-11-19 Listed $194,900 CRMLS
Property tax history
-0.3%/yrLatest (2025): $36 · -0.3% YoY. Source: county tax records.
Cash-flow waterfall
monthlySold comps — $/sqft
last 12 mo · ≤1 miLoading sold comps…