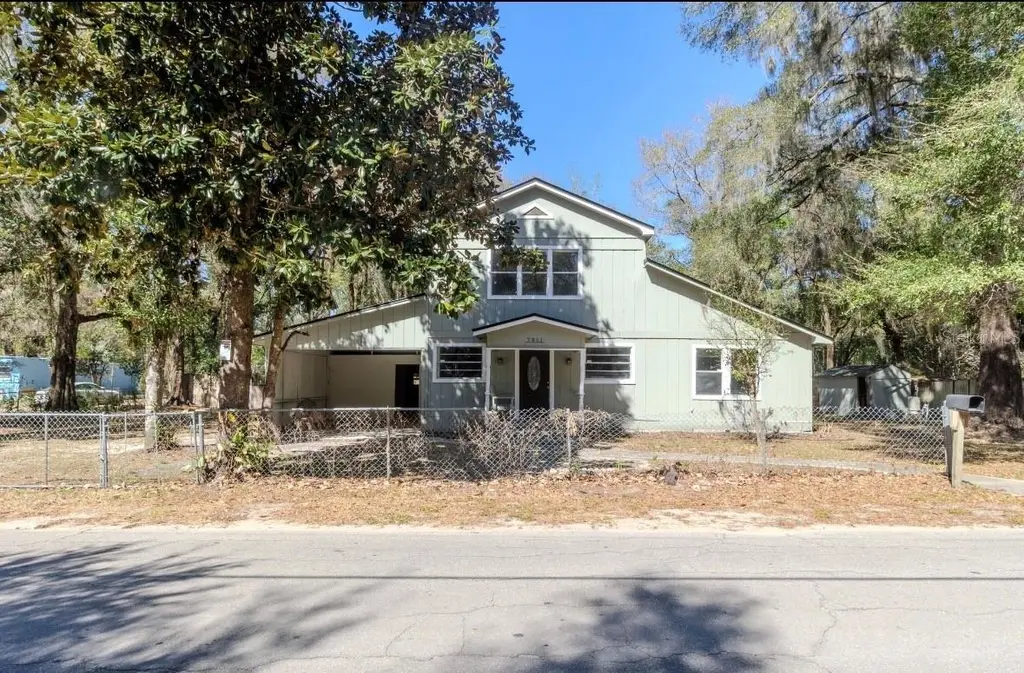
7811 E Watson St · Inverness Highlands South, FL
Flood risk 1/10 · Minimal
- FEMA flood zone
- X (unshaded)
- Chance of flooding over 30 yrs
- 0.0%
- Est. flood insurance / yr
- $507 – $1,088
Fire risk 5/10 · Moderate
- Est. fire insurance / yr
- $947 – $1,759
Heat risk 8/10 · Major
- Hot days now (above 107°F)
- 7 days/yr
- Hot days in 30 yrs
- 21 days/yr
Wind risk 9/10 · Severe
- Chance of severe wind over 30 yrs
- 99.0%
Air-quality risk 1/10 · Minimal
- Unhealthy air days now
- 0 days/yr
- Unhealthy air days in 30 yrs
- 0 days/yr
Risk factors via First Street. Map © Google.
Why this score? — see what drove the C+ grade
The composite is a weighted blend of 9 inputs, each scored 0–100. Each bar is that input's sub-score; the figure is the points it added to the 100-point composite (weight × sub-score).
- Cash flow +27.5/30.0
- DSCR +9.6/10.0
- 1% rule +7.5/10.0
- ARV discount +7.5/15.0
- Schools +4.1/10.0
- Livability +3.4/5.0
- Rent growth +2.5/5.0
- Condition / age +2.5/5.0
- Appreciation +0.0/10.0
$159,900
🖨 Deal sheet (PDF) 📄 Offer letter ✓ Due diligence
Listing remarks MLS
Don't Wait! This Custom 3 Bedroom 2 Bath Home boasts an Eat in Kitchen, Formal Dining Room, Quaint Living Room with Beamed Ceilings and a Large Screened Porch all situated on a Maintained Lot that is Fully Fenced, with Mature Tree's and Plenty of Shade. It Won't take Sherlock Holmes to Deduce, This is a Great Home. .. .After all, Its Elementary, my dear WATSON!
Key facts
- New well pump
- Prime corner lot
- Public boat ramps
Tags
Property features AI
Finance
- Other: Property subtype: Single Family Residence; Zoning: MDRMH; Oversized lot; Lot dimensions approximately 175 x 74; Lot surface includes asphalt, dirt and gravel; Mature landscaping with oak trees and wooded areas
- HOA & community: No HOA association; Pets allowed
Exterior
- Parking: Driveway; Oversized parking; Parking pad; Workshop in garage; Carport with 2 spaces
- Utilities: Public water; Public sewer; Public utilities
- Home design: Single family residence; Residential property; Two-story; East-facing; Completed condition
- Construction: Frame construction with wood siding; Shingle roof; Crawlspace and slab foundation; Built (year not provided)
- Exterior features: Covered patio; Rear porch; Outdoor lighting; Storage; Shed(s); Workshop
Interior
- Kitchen: Dishwasher; Other appliances
- Bedrooms: 3 bedrooms
- Flooring: Laminate; Other flooring
- Bathrooms: 2 full bathrooms
- Heating & cooling: Central heating; Central air conditioning
- Interior features: High ceilings; Bonus room
- Laundry & utility: Laundry room
Neighborhood map
What this means for you Summary
Snapshot
- This is a 4-bed/2.0-bath single-family listed at $160k.
Deal economics
- At list price, monthly cash flow is $473 ($6k/yr) — positive.
- The deal already cash-flows at list — no discount required.
- Meets the 1% rule at list price ($2k rent vs $160k).
- Recommended offer: $146k (9.0% below list) — sets the bar for market timing.
- Cap rate 9.8% vs local median 5.0% in Inverness Highlands South — top-decile yield for the area; either an underpriced asset or a hidden risk that comps aren't pricing in. Stress-test before assuming the spread holds.
Location & tenants
- Location reads 68/100 on livability (#508 in FL) — a middle-class / working-renter tenant base. Strengths: cost of living A+, housing A+, crime B; Watch: employment C-, health & safety C-, amenities F.
- Citrus (rural): math 49% / reading 50% proficiency, ranked #44 of 73 in FL (top 60%) — families likely to look elsewhere, expect single-tenant / working-renter base with shorter leases.
- Zoned schools: Inverness Primary School (math 54% / reading 55%, grade C, #892 of 2,144 statewide, top 44%, 683 students, 65% FRL); Citrus High School (math 34% / reading 51%, grade F, #264 of 667 statewide, top 41%, 1,503 students, 54% FRL) — zoned schools at 60% FRL track the district average.
- Market conditions: 210 active listings in the ZIP; 1 comparable units currently listed for rent nearby; 2,443 units permitted in Citrus County in 2024 (0 in 5+ unit buildings).
Forward outlook
- Local home prices are declining (-3.0%/yr); year-one equity from $1k of loan paydown is wiped out by about $5k of value loss. Plan a longer hold.
- Citrus County population projected to shrink 10% by 2050 — rents likely to lag national; underwrite the cash flow, not the appreciation.
- At projected returns (-3.0% appreciation + 3.0% rent growth), your $45k cash investment doubles in ~9 years — after that, you're playing with house money.
Negotiation context
- It's been on market 94 days — a 9% lower offer ($146k) is reasonable based on typical stale-listing flexibility.
- 11 sale attempts since 11y ago; this cycle's ask has dropped $39k (20%) from the opening price — seller is motivated, your offer sets the floor, not the list.
- Current owner paid $45k; list at $160k implies a 255% gain — meaningful room to come down on a strong offer.
Risks & watch-outs
- Watch-outs: built in 1930 — expect roof / HVAC / electrical / plumbing capex.
- Climate carrying-cost: severe wind risk, 99% chance of damaging wind over 30y; moderate wildfire risk; extreme-heat days projected 7→21/yr by 2055 (HVAC capex compounding) — expect insurance premiums to compound above CPI over the hold.
Questions for the listing agent
- It's been on market 94 days. Have you received any prior offers? Is the seller open to a 9% concession, seller financing, or rate buy-down credit?
- Built in 1930 — when were the roof, HVAC, electrical panel, plumbing, and water heater last replaced?
- Why hasn't it sold? Are there any deal-killer items the seller is aware of (foundation, flood, title, zoning, code violations)?
- Is there a deadline driving the sale (1031 exchange, divorce, estate, relocation)? That informs how much negotiation room exists.
- Schools are F-rated, which usually means shorter tenancies and higher turnover. Who's the typical renter profile here, and what's been the actual vacancy rate?
- What's the average days-on-market for RENTAL listings here right now (not sales)? A rising rental-DOM trend means longer vacancies and softer asking-rent achievability than the comps imply.
- What's the recent tenant-quality profile in this submarket — average credit score on applications, eviction rate, late-payment / NSF rate, and stable-employment percentage? A property-management company in the area should have these aggregated.
- How much new for-sale + rental construction is in the pipeline within 1–3 miles? Heavy new supply typically softens prices + rents 12–24 months out; constrained supply supports both.
Investment metrics
- 1% rule
- 1.25% ✓
- Cap rate
- 9.84%
- Cash-on-cash
- 12.68%
- DSCR
- 1.56
- GRM
- 6.7
CMA / ARV
No comps found within radius.
Projected returns pro-forma
-3.0% appreciation · 3.0% rent growth · sell at horizon
- IRR
- 2.5%
- Equity multiple
- 1.10×
- Total profit
- $4,258
- Equity at exit
- $23,842
- IRR
- 12.1%
- Equity multiple
- 1.95×
- Total profit
- $42,641
- Equity at exit
- $13,825
Cash invested: $44,772 (down + closing). Projections, not guarantees.
Landlord ↔ Tenant lean methodology
- Overall (STATE)
- 87 Strongly Landlord-Friendly
- State Florida
- 87 Strongly Landlord-Friendly · R+3
- County
- — inherits STATE
- City
- — inherits STATE
ZIP-level market 34450
- Home prices YoY
- -18.7%
- Active inventory
- 210
- Price-to-rent
- 6.7×
Monthly cashflow live
- Estimated rent
- $2,000 medium interval (Pro) →
- Mortgage (P&I)
- −$839
- Tax from tax record
- −$202 /mo · $2,420/yr
- Insurance
- −$67
- HOA
- −$0
- Vacancy / Maint / Mgmt
- −$420
- Net cashflow
- $473
Break-even live
Sensitivity live
| Price | -10% $564 | -5% $518 | +0% $473 | +5% $428 | +10% $383 |
|---|---|---|---|---|---|
| Rent | -10% $315 | -5% $394 | +0% $473 | +5% $552 | +10% $631 |
| Rate | -1.0pp $554 | -0.5pp $514 | base $473 | +0.5pp $432 | +1.0pp $390 |
UW: 25.0% down · 7.5% · 30yr · 1.5% tax · 5.0% vac · 8.0% maint · 8.0% mgmt
Financing live
Cash to close
- Down payment
- $39,975
- Closing costs
- $4,797
- Reserves months
- —
- Total cash needed
- —
Loan-product check · same deal, 3 products live
Conventional
25% down · 7.5% · 30yr
- Down + closing
- —
- Monthly P&I
- —
- Monthly cashflow
- —
- DSCR
- —
- Eligible?
- —
Personal DTI + credit; lowest rate.
DSCR
20% down · 8.5% · 30yr
- Down + closing
- —
- Monthly P&I
- —
- Monthly cashflow
- —
- DSCR
- —
- Eligible?
- —
No personal income docs; deal must DSCR.
Hard money
10% down · 12.0% · 12mo
- Down + closing
- —
- Monthly P&I
- —
- Monthly cashflow
- —
- DSCR
- —
- Eligible?
- —
Short-term bridge; refi at stabilization.
Rent comps 1 comps
| Address | Beds | Baths | Sqft | Rent | $/sqft | DOM | Units | Dist |
|---|---|---|---|---|---|---|---|---|
| 4419 S Dodge Pt Inverness, FL | 3.0 | 2.0 | 1600 | $2,000 | $1.25 | 22d | 1 | 1.03mi |
Listing history 45 events
-
2026-06-21days on market $159,900 Active 94 DOM
-
2026-06-19days on market $159,900 Active 92 DOM
-
2026-06-18days on market $159,900 Active 91 DOM
-
2026-06-17days on market $159,900 Active 90 DOM
-
2026-06-16days on market $159,900 Active 89 DOM
-
2026-06-15days on market $159,900 Active 88 DOM
-
2026-06-14days on market $159,900 Active 86 DOM
-
2026-06-13days on market $159,900 Active 85 DOM
-
2026-06-09days on market $159,900 Active 82 DOM
-
2026-06-08days on market $159,900 Active 81 DOM
-
2026-06-07days on market $159,900 Active 80 DOM
-
2026-06-03days on market $159,900 Active 76 DOM
-
2026-06-02days on market $159,900 Active 75 DOM
-
2026-06-01days on market $159,900 Active 74 DOM
-
2026-05-31days on market $159,900 Active 73 DOM
-
2026-05-30days on market $159,900 Active 72 DOM
-
2026-05-19price $159,900
-
2026-05-01price $169,900
-
2026-04-29status Active
-
2026-04-23status Pending
-
2026-04-09price $175,000
-
2026-03-13$199,000 Active
-
2025-03-10historical $1,695
-
2025-03-08$1,695
-
2025-03-07historical $1,695
-
2025-02-16price $1,695
-
2025-01-01$1,800
-
2024-12-13historical $1,800
-
2024-11-13$1,800
-
2024-11-08historical $1,800
-
2024-10-08$1,800
-
2024-09-28historical $1,800
-
2024-08-28$1,800
-
2024-01-11historical $1,850
-
2023-12-31historical
-
2023-11-11$1,850
-
2023-10-05status Active
-
2023-10-04status Pending
-
2023-09-19price $220,000
-
2023-09-09price $224,900
-
2023-08-28price $229,000
-
2023-07-28price $239,000
-
2023-06-24$259,000 Active
-
2015-12-11soldstatus $45,000 363-char remark
Show marketing remark (363 chars)
Don't Wait! This Custom 3 Bedroom 2 Bath Home boasts an Eat in Kitchen, Formal Dining Room, Quaint Living Room with Beamed Ceilings and a Large Screened Porch all situated on a Maintained Lot that is Fully Fenced, with Mature Tree's and Plenty of Shade. It Won't take Sherlock Holmes to Deduce, This is a Great Home. .. .After all, Its Elementary, my dear WATSON!
-
2015-06-24$45,000 363-char remark
Show marketing remark (363 chars)
Don't Wait! This Custom 3 Bedroom 2 Bath Home boasts an Eat in Kitchen, Formal Dining Room, Quaint Living Room with Beamed Ceilings and a Large Screened Porch all situated on a Maintained Lot that is Fully Fenced, with Mature Tree's and Plenty of Shade. It Won't take Sherlock Holmes to Deduce, This is a Great Home. .. .After all, Its Elementary, my dear WATSON!
ⓘ Source: listings_history table (triggers on properties + properties_extension) + one-shot
backfill from property_details.listing_events for pre-trigger history.
Tax reassessment forecast FL · Resets to sale price
- Current annual tax
- $2,420 · $202/mo
- Projected year-2 tax
- $2,420 · $202/mo
- Expected delta
- $0/yr ($0/mo · 0.0%)
ⓘ Screening estimate from a state-policy table — verify with the county assessor before closing.
Climate risk First Street
- Flood 1/10 Low FEMA zone X (unshaded) · 0% chance over 30 yrs
- Wildfire 5/10 Major
- Heat 8/10 Severe 7 d/yr ≥107°F today · 21 d/yr by 30 yrs out
- Wind 9/10 Extreme 99% chance of damaging wind over 30 yrs
- Air quality 1/10 Low 0 unhealthy d/yr today · 0 by 30 yrs out
Nearby sold comps map
Loading sold comps map…
Walkable amenities ~0.75 mi
Loading nearby amenities…
Taxation est. · year 1
- Rental income
- $24,000
- − Mortgage interest
- −$8,957
- − Property taxes
- −$2,420
- − Insurance
- −$800
- − Repairs & maintenance
- −$1,920
- − Management
- −$1,920
- − Depreciation
- −$4,652
- Taxable income
- $3,332
- Est. tax owed @ 24.0%
- −$800
- After-tax cash flow
- $4,878/yr
For passive investors: Depreciation is non-cash, so a rental often shows a tax loss while cash-flowing — sheltering income. Rental losses are passive: they offset passive income freely, and up to $25,000/yr can offset ordinary (W-2) income if you actively participate and your MAGI is under $100k (phasing out to $0 by $150k); unused losses carry forward. On sale, claimed depreciation is recaptured at up to 25%, and gains may owe capital-gains tax (a 1031 exchange can defer both). Figures are a year-1 estimate at your 24.0% rate — not tax advice; consult a CPA.
Schools (NCES district)
- District
- Citrus
- NCES district ID
- 1200270
- Math proficiency
- 49% ▼ -10.00%
- Reading proficiency
- 50% ▼ -6.00%
- Median HH income
- $38,618
- Composite
- 41.28/100
- National rank
- #3519
- State rank
- #44 of 73 in FL
Livability — Inverness Highlands South
- Score
- 68/100
- State rank
- #508
- US rank
- #9372
Category grades
Schools grade is shown separately in the Schools card above.
Census & demographics
- Population (ZIP)
- 10,408
Population outlook (Citrus County) Hauer SSP2
- Today (2025)
- 138,622 people
- By 2030
- 136,886 · -1.3%
- By 2040
- 132,009 · -4.8%
- By 2050
- 125,196 · -9.7%
- By 2075
- 108,570 · -21.7%
- By 2100
- 84,454 · -39.1%
Race, ethnicity, and origin ACS 2023
- Neighborhood character
- Predominantly White (81%)
- Race & ethnicity
- White 81% Two or more races 10% Hispanic / Latino 8% Asian 3% Black 1%
- Hispanic origin (detail)
- Mexican 3% Puerto Rican 3%
- Common ancestry
- Romanian 4% Slovak 3% Lithuanian 2%
- Foreign-born
- 8% · Canada
- Languages at home
- 90% English-only · Spanish 4% Other Indo-European 3% Tagalog/Filipino 1%
Political lean MEDSL · Citrus
- 2024 margin
- Solid R (+45.9) · D 26.8% · R 72.6%
- 2008→2024 swing
- -29.8pp toward R · 2008: -16.1pp · 2024: -45.9pp
- All cycles
- 2024: R+45.9 2020: R+41.0 2016: R+39.7 2012: R+21.9 2008: R+16.1
Not yet ingested
- Civics
- —
Market trends
- HPI YoY
- ▼ -72.56%
- Current HPI
- 315.9725
- Rent YoY
- —
- Metro
- —
- State GDP YoY
- ▲ 3.28%
- F500 in state
- 36
Industry mix (Fortune 500 HQ in FL)
| Industry | F500 HQs | Revenue |
|---|---|---|
| Industrial Technology | 2 | $29B |
|
||
| Insurance | 2 | $17B |
|
||
| Retail | 1 | $60B |
|
||
| Technology Distribution | 1 | $58B |
|
||
| Homebuilding | 1 | $35B |
|
||
| Technology Manufacturing | 1 | $35B |
|
||
Price history
+255.3% since first listed29 events — show timeline
- 2026-05-19 Price Changed $159,900 Stellar MLS as Distributed by MLS Grid
- 2026-05-01 Price Changed $169,900 Stellar MLS as Distributed by MLS Grid
- 2026-04-29 Relisted — Stellar MLS as Distributed by MLS Grid
- 2026-04-23 Pending — Stellar MLS as Distributed by MLS Grid
- 2026-04-09 Price Changed $175,000 Stellar MLS as Distributed by MLS Grid
- 2026-03-13 Listed $199,000 Stellar MLS as Distributed by MLS Grid
- 2025-03-10 Rental Removed $1,695 RENTALBEAST
- 2025-03-08 Listed for Rent $1,695 RENTALBEAST
- 2025-03-07 Rental Removed $1,695 TURBOTENANT
- 2025-02-16 Price Changed $1,695 TURBOTENANT
- 2025-01-01 Listed for Rent $1,800 TURBOTENANT
- 2024-12-13 Rental Removed $1,800 TURBOTENANT
- 2024-11-13 Listed for Rent $1,800 TURBOTENANT
- 2024-11-08 Rental Removed $1,800 TURBOTENANT
- 2024-10-08 Listed for Rent $1,800 TURBOTENANT
- 2024-09-28 Rental Removed $1,800 TURBOTENANT
- 2024-08-28 Listed for Rent $1,800 TURBOTENANT
- 2024-01-11 Rental Removed $1,850 STELLARMLS
- 2023-12-31 Listing Removed — Stellar MLS as Distributed by MLS Grid
- 2023-11-11 Listed for Rent $1,850 STELLARMLS
- 2023-10-05 Relisted — Stellar MLS as Distributed by MLS Grid
- 2023-10-04 Pending — Stellar MLS as Distributed by MLS Grid
- 2023-09-19 Price Changed $220,000 Stellar MLS as Distributed by MLS Grid
- 2023-09-09 Price Changed $224,900 Stellar MLS as Distributed by MLS Grid
- 2023-08-28 Price Changed $229,000 Stellar MLS as Distributed by MLS Grid
- 2023-07-28 Price Changed $239,000 Stellar MLS as Distributed by MLS Grid
- 2023-06-24 Listed $259,000 Stellar MLS as Distributed by MLS Grid
- 2015-12-11 Sold (MLS) $45,000 RACC
- 2015-06-24 Listed $45,000 RACC
Property tax history
+17.9%/yrLatest (2025): $2,420 · +1.1% YoY. Source: county tax records.
Cash-flow waterfall
monthlySold comps — $/sqft
last 12 mo · ≤1 miLoading sold comps…