1900 Danbrook #718 · Sacramento, CA
Flood risk 1/10 · Minimal
- FEMA flood zone
- A99
- Chance of flooding over 30 yrs
- 0.0%
- Est. flood insurance / yr
- $1,009 – $1,996
Fire risk 6/10 · Moderate
- Est. fire insurance / yr
- $659 – $1,223
Heat risk 7/10 · Major
- Hot days now (above 102°F)
- 7 days/yr
- Hot days in 30 yrs
- 14 days/yr
Wind risk 1/10 · Minimal
- Chance of severe wind over 30 yrs
- —
Air-quality risk 10/10 · Severe
- Unhealthy air days now
- 29 days/yr
- Unhealthy air days in 30 yrs
- 33 days/yr
Risk factors via First Street. Map © Google.
Why this score? — see what drove the D grade
The composite is a weighted blend of 9 inputs, each scored 0–100. Each bar is that input's sub-score; the figure is the points it added to the 100-point composite (weight × sub-score).
- ARV discount +13.3/15.0
- Appreciation +9.6/10.0
- Schools +4.1/10.0
- Cash flow +3.7/30.0
- Livability +3.6/5.0
- Rent growth +2.9/5.0
- 1% rule +2.8/10.0
- Condition / age +2.5/5.0
- DSCR +0.0/10.0
$253,000
🖨 Deal sheet (PDF) 📄 Offer letter ✓ Due diligence
Listing remarks
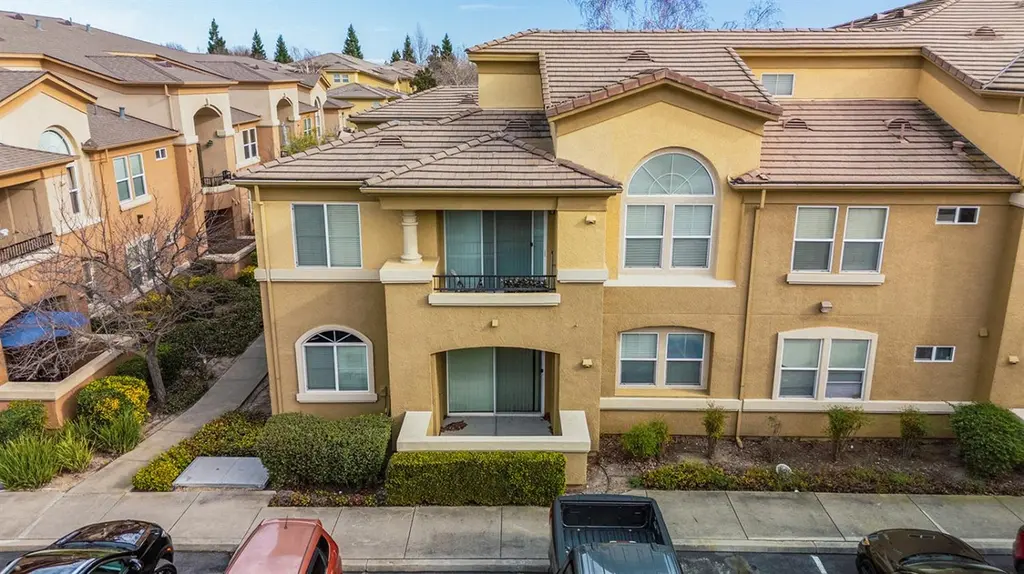
* * Price Reduction + $2,000.00 Buyer Credit * * Charming ground-level 1 bed / 1 bath condo, 763 sq ft in the gated Amara community at 1900 Danbrook Dr. Bright, open floor plan with living area, dining space, laundry in unit, and large windows that bring in natural light. The primary bedroom offers a peaceful retreat with a walk in closet and easy access to the full bathroom. Enjoy a private patio perfect for morning coffee or container gardening and convenient ground-floor access. Community amenities include gated entry, sparkling pool & spa, fitness center, clubhouse, and well-maintained common areas. Detached garage, assigned parking and additional visitor parking on-site. Idea
Key facts
- Gated community
- Fitness center
- Clubhouse
Tags
Neighborhood map
What this means for you Summary
Snapshot
- This is a 1-bed/1.0-bath condo listed at $253k.
Deal economics
- At list price, monthly cash flow is $-865 ($-10k/yr) — negative.
- To cash-flow at today's rent, offer at most $100k (60.4% below list).
- To meet the 1% rule (rent ≥ 1% of price), the offer needs to be $198k (21.8% below list).
- Recommended offer: $100k (60.4% below list) — sets the bar for cash-flow.
Location & tenants
- Location reads 71/100 on livability (#218 in CA) — a middle-class / working-renter tenant base. Strengths: amenities A+, commute A+, housing A; Watch: crime F, cost of living F.
- Natomas Unified (urban): math 33% / reading 60% proficiency, ranked #155 of 517 in CA (top 30%) — families likely to look elsewhere, expect single-tenant / working-renter base with shorter leases.
- Zoned schools: Natomas Park Elementary (690 students, 61% FRL); Natomas Middle (662 students, 65% FRL); Inderkum High (math 39% / reading 66%, grade C-, #289 of 1,170 statewide, top 25%, 2,266 students, 39% FRL).
- Market conditions: Rents rising (+1.4%/yr); 406 active listings in the ZIP; 8 comparable units currently listed for rent nearby; rentals leasing fast (median 1d on market — plan ~1-2 weeks tenant-placement turnaround); high-income renter base; 6,825 units permitted in Sacramento County in 2024 (1,752 in 5+ unit buildings).
Forward outlook
- In year one you build about $25k of equity ($2k loan paydown + $23k appreciation (9.2% local appreciation)).
- Sacramento County population projected at +17% by 2050 — long-run rental-demand tailwind backs the buy-and-hold thesis.
- By year 2, paydown + projected appreciation supports a ~$40k cash-out refi (75% LTV) — recoverable capital for the next deal without selling this one.
Negotiation context
- It's been on market 73 days — a 6% lower offer ($238k) is reasonable based on typical stale-listing flexibility.
Risks & watch-outs
- Watch-outs: flood insurance adds $125/mo; HOA is 27% of rent.
- Climate carrying-cost: in FEMA flood zone A99 (mandatory federal flood insurance); major wildfire risk; extreme-heat days projected 7→14/yr by 2055 (HVAC capex compounding) — expect insurance premiums to compound above CPI over the hold.
Questions for the listing agent
- What do current leases actually rent for vs. the listed asking? Can we see a recent rent roll and the last 12 months of T-12 income?
- It's been on market 73 days. Have you received any prior offers? Is the seller open to a 60% concession, seller financing, or rate buy-down credit?
- What's the actual annual flood-insurance premium (NFIP or private), and is the property in a SFHA with mandatory coverage?
- What does the HOA fee cover, when was the last increase, and are there any pending special assessments or reserve-fund shortfalls?
- Any open or pending special assessments — roof, HVAC, plumbing, elevator, façade? What's the per-unit balance and payoff schedule, and is the seller paying it off at close or rolling it to the buyer?
- Why hasn't it sold? Are there any deal-killer items the seller is aware of (foundation, flood, title, zoning, code violations)?
- Is there a deadline driving the sale (1031 exchange, divorce, estate, relocation)? That informs how much negotiation room exists.
- Schools are D-rated, which usually means shorter tenancies and higher turnover. Who's the typical renter profile here, and what's been the actual vacancy rate?
- Crime grade is F in this area — have there been break-ins, vandalism, or insurance claims at this property in the last 3 years? What carrier currently insures it and at what premium?
- The area grade is low — what's the realistic commute time and amenity access for the typical tenant pool here? Any planned neighborhood developments (good or bad) we should know about?
- What's the average days-on-market for RENTAL listings here right now (not sales)? A rising rental-DOM trend means longer vacancies and softer asking-rent achievability than the comps imply.
- What's the recent tenant-quality profile in this submarket — average credit score on applications, eviction rate, late-payment / NSF rate, and stable-employment percentage? A property-management company in the area should have these aggregated.
- How much new apartment / multifamily construction is in the pipeline within 1–3 miles? Heavy new supply (>2% of stock underway) typically softens rents 12–24 months out; light construction supports rent growth.
Investment metrics
- 1% rule
- 0.78% ✗
- Cap rate
- 2.78%
- Cash-on-cash
- -12.53%
- DSCR
- 0.44
- GRM
- 10.7
CMA / ARV
- ARV (median comp)
- $290,556
- List price
- $253,000
- Delta
- -12.93%
- Verdict
- UNDERPRICED
- Comps
- 20 within 1.0 mi
Projected returns pro-forma
9.18% appreciation · 1.43% rent growth · sell at horizon
- IRR
- 11.7%
- Equity multiple
- 1.93×
- Total profit
- $66,070
- Equity at exit
- $213,030
- IRR
- 12.0%
- Equity multiple
- 4.25×
- Total profit
- $229,881
- Equity at exit
- $444,432
Cash invested: $70,840 (down + closing). Projections, not guarantees.
Landlord ↔ Tenant lean methodology
- Overall (STATE)
- 18 Strongly Tenant-Friendly
- State California
- 18 Strongly Tenant-Friendly · D+13
- County
- — inherits STATE
- City
- — inherits STATE
ZIP-level market 95835
- Home prices YoY
- 3.5%
- Rents YoY
- 1.4%
- Active inventory
- 406
- Price-to-rent
- 10.7×
Monthly cashflow live
- Estimated rent
- $1,980 high interval (Pro) →
- Mortgage (P&I)
- −$1,327
- Tax from tax record
- −$341 /mo · $4,097/yr
- Insurance
- −$105
- Flood insurance flood zone
- −$125 /mo · $1,502/yr
- HOA
- −$530
- Vacancy / Maint / Mgmt
- −$416
- Net cashflow
- $-865
Break-even live
Sensitivity live
| Price | -10% $-722 | -5% $-793 | +0% $-865 | +5% $-937 | +10% $-1,008 |
|---|---|---|---|---|---|
| Rent | -10% $-1,021 | -5% $-943 | +0% $-865 | +5% $-787 | +10% $-709 |
| Rate | -1.0pp $-738 | -0.5pp $-801 | base $-865 | +0.5pp $-931 | +1.0pp $-997 |
UW: 25.0% down · 7.5% · 30yr · 1.5% tax · 5.0% vac · 8.0% maint · 8.0% mgmt
Financing live
Cash to close
- Down payment
- $63,250
- Closing costs
- $7,590
- Reserves months
- —
- Total cash needed
- —
Loan-product check · same deal, 3 products live
Conventional
25% down · 7.5% · 30yr
- Down + closing
- —
- Monthly P&I
- —
- Monthly cashflow
- —
- DSCR
- —
- Eligible?
- —
Personal DTI + credit; lowest rate.
DSCR
20% down · 8.5% · 30yr
- Down + closing
- —
- Monthly P&I
- —
- Monthly cashflow
- —
- DSCR
- —
- Eligible?
- —
No personal income docs; deal must DSCR.
Hard money
10% down · 12.0% · 12mo
- Down + closing
- —
- Monthly P&I
- —
- Monthly cashflow
- —
- DSCR
- —
- Eligible?
- —
Short-term bridge; refi at stabilization.
Rent comps 8 comps
| Address | Beds | Baths | Sqft | Rent | $/sqft | DOM | Units | Dist |
|---|---|---|---|---|---|---|---|---|
| 1900 Danbrook Dr Sacramento, CA | 1.0 | 1.0 | 873 | $1,772 | $2.03 | 45d | 2 | 0.04mi |
| 1900 Danbrook Dr Sacramento, CA | 1.0 | 1.0 | 1015 | $2,048 | $2.02 | 6d | 2 | 0.04mi |
| 1850 Club Center Dr Sacramento, CA | 1.0–3.0 | 1.0–2.0 | 985 | $1,750 | $1.78 | 0d | 8 | 0.19mi |
| 4850 Natomas Blvd Sacramento, CA | 1.0–2.0 | 1.0–2.0 | 837 | $1,800 | $2.15 | 0d | 17 | 0.57mi |
| 4601 Blackrock Dr Sacramento, CA | 1.0–2.0 | 1.0–2.0 | 940 | $1,983 | $2.11 | 0d | 8 | 0.94mi |
| 4500 Truxel Rd Sacramento, CA | 1.0–2.0 | 1.0–2.0 | 900 | $1,787 | $1.99 | 0d | 22 | 1.06mi |
| 4800 Kokomo Dr Sacramento, CA | 1.0–3.0 | 1.0–3.5 | 1229 | $2,024 | $1.65 | 0d | 24 | 1.18mi |
| 4400 Truxel Rd Sacramento, CA | 1.0–3.0 | 1.0–2.0 | 1003 | $1,785 | $1.78 | 0d | 1 | 1.36mi |
HOA detail condo
- Monthly dues
- $530 · $6,360/yr
- Likely covers
- poolgymsecurityparking
- Assessments
- None detected in remarks — confirm with the listing agent.
Listing history 22 events
-
2026-06-21days on market $253,000 Active 73 DOM
-
2026-06-18days on market $253,000 Active 70 DOM
-
2026-06-17days on market $253,000 Active 69 DOM
-
2026-06-16days on market $253,000 Active 68 DOM
-
2026-06-15days on market $253,000 Active 67 DOM
-
2026-06-13days on market $253,000 Active 65 DOM
-
2026-06-13days on market $253,000 Active 64 DOM
-
2026-06-09days on market $253,000 Active 61 DOM
-
2026-06-08days on market $253,000 Active 60 DOM
-
2026-06-07pricedays on market $253,000 Active 59 DOM
-
2026-06-05days on market $255,000 Active 56 DOM
-
2026-06-03days on market $255,000 Active 55 DOM
-
2026-06-02days on market $255,000 Active 54 DOM
-
2026-06-01days on market $255,000 Active 53 DOM
-
2026-05-31days on market $255,000 Active 52 DOM
-
2024-11-14historical $1,695
-
2024-10-24price $1,695
-
2024-10-12price $1,750
-
2024-10-11price $1,795
-
2024-09-26price $1,895
-
2024-09-19$1,995
-
2024-02-14soldstatus $295,000
ⓘ Source: listings_history table (triggers on properties + properties_extension) + one-shot
backfill from property_details.listing_events for pre-trigger history.
Tax reassessment forecast CA · Resets to sale price
- Current annual tax
- $4,097 · $341/mo
- Projected year-2 tax
- $4,097 · $341/mo
- Expected delta
- $0/yr ($0/mo · 0.0%)
ⓘ Screening estimate from a state-policy table — verify with the county assessor before closing.
Climate risk First Street
- Flood 1/10 Low FEMA zone A99 · 0% chance over 30 yrs
- Wildfire 6/10 Major
- Heat 7/10 Severe 7 d/yr ≥102°F today · 14 d/yr by 30 yrs out
- Wind 1/10 Low
- Air quality 10/10 Extreme 29 unhealthy d/yr today · 33 by 30 yrs out
Nearby sold comps map
Loading sold comps map…
Walkable amenities ~0.75 mi
Loading nearby amenities…
Taxation est. · year 1
- Rental income
- $23,755
- − Mortgage interest
- −$14,172
- − Property taxes
- −$4,097
- − Insurance
- −$2,768
- − Repairs & maintenance
- −$1,900
- − Management
- −$1,900
- − HOA
- −$6,360
- − Depreciation
- −$7,360
- Taxable loss
- −$14,803
- Est. tax savings @ 24.0%
- +$3,553
- After-tax cash flow
- $-6,827/yr
For passive investors: Depreciation is non-cash, so a rental often shows a tax loss while cash-flowing — sheltering income. Rental losses are passive: they offset passive income freely, and up to $25,000/yr can offset ordinary (W-2) income if you actively participate and your MAGI is under $100k (phasing out to $0 by $150k); unused losses carry forward. On sale, claimed depreciation is recaptured at up to 25%, and gains may owe capital-gains tax (a 1031 exchange can defer both). Figures are a year-1 estimate at your 24.0% rate — not tax advice; consult a CPA.
Schools (NCES district)
- District
- Natomas Unified
- NCES district ID
- 0600036
- Math proficiency
- 33% ▼ -1.00%
- Reading proficiency
- 60% ▲ 13.00%
- Median HH income
- $67,969
- Composite
- 41.49/100
- National rank
- #3457
- State rank
- #155 of 517 in CA
Livability — Sacramento
- Score
- 71/100
- State rank
- #218
- US rank
- #6957
Category grades
Schools grade is shown separately in the Schools card above.
Census & demographics
- Census place
- Sacramento, CA
- County
- Sacramento County · 1,539,646 people
- City population
- 761,410
- Metro
- Sacramento-Roseville-Folsom, CA
- Population (ZIP)
- 42,004
- Household income
- $114,468
- Rent vs Own
- Severe rent burden
- 1234.0
Population outlook (Sacramento County) Hauer SSP2
- Today (2025)
- 1,660,763 people
- By 2030
- 1,732,990 · +4.3%
- By 2040
- 1,855,755 · +11.7%
- By 2050
- 1,941,335 · +16.9%
- By 2075
- 2,046,162 · +23.2%
- By 2100
- 1,961,444 · +18.1%
Race, ethnicity, and origin ACS 2023
- Neighborhood character
- Highly diverse neighborhood (Simpson 0.78)
- Race & ethnicity
- Asian 30% White 29% Hispanic / Latino 19% Two or more races 15% Black 13%
- Hispanic origin (detail)
- Mexican 15%
- Common ancestry
- Scotch-Irish 2% Italian 1% Romanian 1%
- Foreign-born
- 25% · China, Canada, Vietnam
- Languages at home
- 66% English-only · Other Indo-European 10% Spanish 8% Other Asian/Pacific 4%
Political lean MEDSL · Sacramento
- 2024 margin
- D (+19.7) · D 58.1% · R 38.4% · Other 3.5%
- 2008→2024 swing
- +0.7pp no change · 2008: 19.0pp · 2024: 19.7pp
- All cycles
- 2024: D+19.7 2020: D+25.3 2016: D+23.7 2012: D+16.3 2008: D+19.0
Not yet ingested
- Civics
- —
Market trends
- HPI YoY
- ▲ 9.18%
- Current HPI
- 271.4823
- Rent YoY
- ▲ 1.43%
- Metro
- Sacramento-Roseville-Folsom, CA
- State GDP YoY
- ▲ 3.21%
- F500 in state
- 116
Industry mix (Fortune 500 HQ in CA)
| Industry | F500 HQs | Revenue |
|---|---|---|
| Technology | 27 | $1,492B |
|
||
| Financial Services | 3 | $174B |
|
||
| Retail | 3 | $44B |
|
||
| Insurance | 3 | $26B |
|
||
| Media / Entertainment | 2 | $115B |
|
||
| Pharmaceuticals / Biotech | 2 | $62B |
|
||
Price history
-99.4% since first listed7 events — show timeline
- 2024-11-14 Rental Removed $1,695 APPFOLIO
- 2024-10-24 Price Changed $1,695 APPFOLIO
- 2024-10-12 Price Changed $1,750 APPFOLIO
- 2024-10-11 Price Changed $1,795 APPFOLIO
- 2024-09-26 Price Changed $1,895 APPFOLIO
- 2024-09-19 Listed for Rent $1,995 APPFOLIO
- 2024-02-14 Sold (Public Records) $295,000 Public Records
Property tax history
+3.5%/yrLatest (2025): $4,097 · +147.0% YoY. Source: county tax records.
Cash-flow waterfall
monthlySold comps — $/sqft
last 12 mo · ≤1 miLoading sold comps…