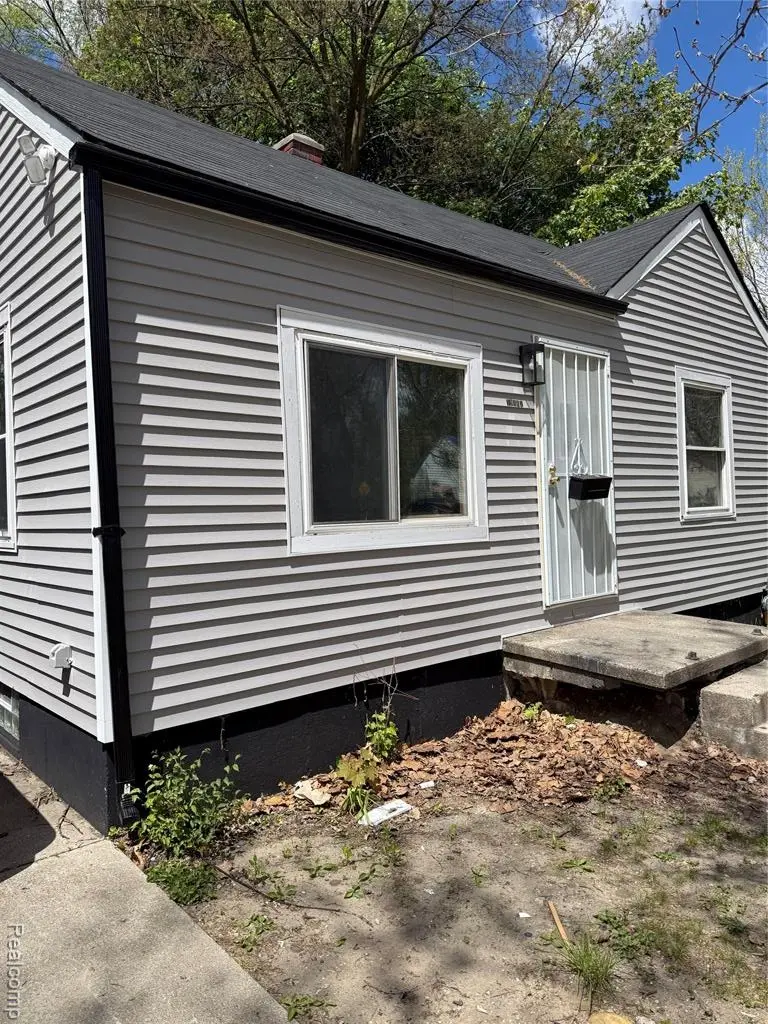
19161 Rosemont Ave · Detroit, MI
Flood risk 1/10 · Minimal
- FEMA flood zone
- X (unshaded)
- Chance of flooding over 30 yrs
- 0.0%
- Est. flood insurance / yr
- $473 – $860
Fire risk 1/10 · Minimal
- Est. fire insurance / yr
- $784 – $1,456
Heat risk 3/10 · Minor
- Hot days now (above 98°F)
- 7 days/yr
- Hot days in 30 yrs
- 15 days/yr
Wind risk 2/10 · Minimal
- Chance of severe wind over 30 yrs
- —
Air-quality risk 3/10 · Minor
- Unhealthy air days now
- 2 days/yr
- Unhealthy air days in 30 yrs
- 5 days/yr
Risk factors via First Street. Map © Google.
Why this score? — see what drove the B+ grade
The composite is a weighted blend of 9 inputs, each scored 0–100. Each bar is that input's sub-score; the figure is the points it added to the 100-point composite (weight × sub-score).
- Cash flow +30.0/30.0
- ARV discount +15.0/15.0
- 1% rule +10.0/10.0
- DSCR +10.0/10.0
- Rent growth +4.5/5.0
- Livability +3.7/5.0
- Condition / age +2.5/5.0
- Schools +1.3/10.0
- Appreciation +0.0/10.0
$54,900
🖨 Deal sheet 📄 Offer letter ✓ Due diligence
Listing remarks MLS
MOTIVATED SELLER regrets having to back out of this project after making significant improvements due to personal reasons. Recent Updates Include: Brand New Roof (2025); New Furnace (2025); Hot Water Tank (2025); New Windows and New Doors (2025); New Glass Block Windows (2025 Basement); Laminate Flooring (2026); Ceramic Flooring and new cabinets in Kitchen (2026); Remodeled Bathroom with beautiful tile and higher end fixtures (2025) and Recessed Lighting throughout. Seller also updated the plumbing and electricity (wiring and panel - 2025) and replaced drain/lines beneath basement flooring. Here are a few 2 bdrm/1 bath comps just a few blocks away: 19749 Rosemont sold for $90k @ $119.52 per sq ft; 19195 Fenmore sold for $79,500 @ $110,41 per sq ft; 19425 Fenmore sold for $79,000 @ $109.72 per sq ft. Property currently falls under a tax abatement scheduled through 2029. BATVAI (Buyer's Agent To Verify All Information). SELLER WILL LOOK AT ALL OFFERS.
Key facts
- Hot water tank
- New furnace
- New doors
Tags
Property features AI
Finance
- Other: Property listed as residential single family; Located in the Milldale subdivision; directions: off 7 Mile, a few blocks west of the Southfield Freeway
Exterior
- Parking: Driveway parking; No garage
- Utilities: Public water; Public sewer
- Home design: Single family residence; One story; Ground-level entry with steps; Vinyl siding
- Construction: Vinyl siding construction; Asphalt roof
- Exterior features: Asphalt roof; Paved road access; Lot approximately 0.14 acres (42 x 140); No pool
Interior
- Kitchen: No specific kitchen appliances listed
- Bedrooms: Total of 4 rooms (includes bedroom count and living spaces)
- Bathrooms: 1 full bathroom
- Heating & cooling: Forced air natural gas heating; Ceiling fan(s); No central air
- Interior features: Gas water heater; Unfinished basement; Basement present
- Laundry & utility: No specific laundry appliances listed
Neighborhood map
What this means for you Summary
Snapshot
- This is a 2-bed/1.0-bath single-family listed at $55k.
Deal economics
- At list price, monthly cash flow is $509 ($6k/yr) — positive.
- The deal already cash-flows at list — no discount required.
- Meets the 1% rule at list price ($1k rent vs $55k).
- Cap rate 17.4% vs local median 10.2% in Detroit — top-decile yield for the area; either an underpriced asset or a hidden risk that comps aren't pricing in. Stress-test before assuming the spread holds.
Location & tenants
- Location reads 73/100 on livability (#218 in MI) — a middle-class / working-renter tenant base. Strengths: amenities A+, commute A+, cost of living A+; Watch: schools F, crime F, employment F.
- Detroit Public Schools Community District (urban): math 10% / reading 24% proficiency, ranked #499 of 540 in MI (top 92%) — low school quality limits family demand, transient renter base, plan for 1-2y turnover; 90% free/reduced lunch — lower-income household profile, screen leases tightly.
- Market conditions: Rents rising fast (+8.0%/yr); 305 active listings in the ZIP; 7 comparable units currently listed for rent nearby; rentals at typical pace (median 15d on market — plan ~3-4 weeks tenant-placement turnaround); lower-income renter base — watch delinquency; 2,639 units permitted in Wayne County in 2024 (1,216 in 5+ unit buildings).
- This rent runs 31% of the median local income ($44k/yr) — at the standard rent-burdened threshold; future hikes will face affordability resistance.
Forward outlook
- Local home prices are declining (-3.0%/yr); year-one equity from $380 of loan paydown is wiped out by about $2k of value loss. Plan a longer hold.
- Wayne County population projected at -17% by 2050 — secular population decline; favor cash flow + early exit over multi-decade hold.
- At projected returns (-3.0% appreciation + 8.0% rent growth), your $15k cash investment doubles in ~3 years — after that, you're playing with house money.
Negotiation context
- Only 12 days on market — expect competitive offers; lowballing is unlikely to land.
- 5 sale attempts; this cycle's ask has dropped $4k (7%) from the opening price — seller is motivated, your offer sets the floor, not the list.
Risks & watch-outs
- Watch-outs: built in 1942 — expect roof / HVAC / electrical / plumbing capex.
Questions for the listing agent
- Built in 1942 — when were the roof, HVAC, electrical panel, plumbing, and water heater last replaced?
- Is there a deadline driving the sale (1031 exchange, divorce, estate, relocation)? That informs how much negotiation room exists.
- Schools are F-rated, which usually means shorter tenancies and higher turnover. Who's the typical renter profile here, and what's been the actual vacancy rate?
- Crime grade is F in this area — have there been break-ins, vandalism, or insurance claims at this property in the last 3 years? What carrier currently insures it and at what premium?
- What's the average days-on-market for RENTAL listings here right now (not sales)? A rising rental-DOM trend means longer vacancies and softer asking-rent achievability than the comps imply.
- What's the recent tenant-quality profile in this submarket — average credit score on applications, eviction rate, late-payment / NSF rate, and stable-employment percentage? A property-management company in the area should have these aggregated.
- How much new for-sale + rental construction is in the pipeline within 1–3 miles? Heavy new supply typically softens prices + rents 12–24 months out; constrained supply supports both.
Investment metrics
- 1% rule
- 2.05% ✓
- Cap rate
- 17.42%
- Cash-on-cash
- 39.75%
- DSCR
- 2.77
- GRM
- 4.1
CMA / ARV
- ARV (median comp)
- $67,892
- List price
- $54,900
- Delta
- -4.26%
- Verdict
- FAIR
- Comps
- 20 within 1.0 mi
Show comp detail 12 sales within ~0.75 mi
| Address | Dist | Beds/Ba | Sqft | Sold | Price | $/sf | Match |
|---|---|---|---|---|---|---|---|
| 19307 Fenmore St | 0.19mi | 2/1.0 | 725 (+10%) | 3mo | $72,500 | $100 | 72 |
| 19944 Faust Ave | 0.52mi | 2/1.0 | 665 (+1%) | 4mo | $30,400 | $46 | 70 |
| 19195 Fenmore St | 0.18mi | 2/1.0 | 720 (+9%) | 8mo | $79,500 | $110 | 70 |
| 19425 Fenmore St | 0.28mi | 2/1.0 | 720 (+9%) | 8mo | $79,000 | $110 | 65 |
| 18723 Warwick St | 0.44mi | 2/1.0 | 700 (+6%) | 8mo | $54,500 | $78 | 62 |
| 19751 Oakfield St | 0.50mi | 2/1.0 | 735 (+12%) | 1mo | $17,500 | $24 | 56 |
| 19749 Rosemont Ave | 0.36mi | 2/1.0 | 753 (+14%) | 7mo | $90,000 | $120 | 53 |
| 19510 Ferguson St | 0.67mi | 2/1.0 | 717 (+9%) | 3mo | $21,000 | $29 | 51 |
| 18247 Harlow St | 0.58mi | 2/1.0 | 728 (+11%) | 10mo | $90,000 | $124 | 47 |
| 19781 Oakfield St | 0.52mi | 2/1.0 | 752 (+14%) | 8mo | $65,000 | $86 | 46 |
| 17227 Curtis St | 0.74mi | 3/1.0 (+1) | 717 (+9%) | 2mo | $77,000 | $107 | 44 |
| 18262 Gilchrist St | 0.70mi | 2/1.0 | 728 (+11%) | 8mo | $55,000 | $76 | 43 |
Match score weights: distance 35% · size 25% · config 20% · recency 20%. Top-matched comps best support the ARV.
Projected returns pro-forma
-3.0% appreciation · 8.0% rent growth · sell at horizon
- IRR
- 41.7%
- Equity multiple
- 2.92×
- Total profit
- $29,500
- Equity at exit
- $8,186
- IRR
- 50.2%
- Equity multiple
- 7.15×
- Total profit
- $94,578
- Equity at exit
- $4,747
Cash invested: $15,372 (down + closing). Projections, not guarantees.
Landlord ↔ Tenant lean methodology
- Overall (STATE)
- 62 Landlord-Friendly
- State Michigan
- 62 Landlord-Friendly · EVEN
- County
- — inherits STATE
- City
- — inherits STATE
ZIP-level market 48219
- Home prices YoY
- -10.3%
- Rents YoY
- 8.0%
- Active inventory
- 305
- Price-to-rent
- 4.1×
Monthly cashflow live
- Estimated rent
- $1,125 high interval (Pro) →
- Mortgage (P&I)
- −$288
- Tax est. 1.5%
- −$69 /mo · $824/yr
- Insurance
- −$23
- HOA
- −$0
- Vacancy / Maint / Mgmt
- −$236
- Net cashflow
- $509
Break-even live
UW: 25.0% down · 7.5% · 30yr · 1.5% tax · 5.0% vac · 8.0% maint · 8.0% mgmt
Financing live
Cash to close
- Down payment
- $13,725
- Closing costs
- $1,647
- Reserves months
- —
- Total cash needed
- —
Loan-product check · same deal, 3 products live
Conventional
25% down · 7.5% · 30yr
- Down + closing
- —
- Monthly P&I
- —
- Monthly cashflow
- —
- DSCR
- —
- Eligible?
- —
Personal DTI + credit; lowest rate.
DSCR
20% down · 8.5% · 30yr
- Down + closing
- —
- Monthly P&I
- —
- Monthly cashflow
- —
- DSCR
- —
- Eligible?
- —
No personal income docs; deal must DSCR.
Hard money
10% down · 12.0% · 12mo
- Down + closing
- —
- Monthly P&I
- —
- Monthly cashflow
- —
- DSCR
- —
- Eligible?
- —
Short-term bridge; refi at stabilization.
Rent comps 7 comps
| Address | Beds | Baths | Sqft | Rent | $/sqft | DOM | Units | Dist |
|---|---|---|---|---|---|---|---|---|
| 19372 Grandville Ave Detroit, MI | 2.0 | 1.5 | 733 | $1,050 | $1.43 | 14d | 1 | 0.53mi |
| 19736 Gilchrist St Detroit, MI | 2.0 | 1.0 | 696 | $995 | $1.43 | 12d | 1 | 0.59mi |
| 18276 Oakfield St Detroit, MI | 2.0 | 1.0 | 726 | $1,175 | $1.62 | 43d | 1 | 0.61mi |
| 20068 Faust Ave Detroit, MI | 2.0 | 1.0 | 750 | $1,100 | $1.47 | 24d | 1 | 0.63mi |
| 20539 Southfield Rd Detroit, MI | 1.0 | 1.0 | 700 | $800 | $1.14 | 10d | 4 | 0.86mi |
| 18274 Fielding St Detroit, MI | 2.0 | 1.0 | 700 | $1,200 | $1.71 | 16d | 1 | 1.21mi |
| 20555 Motor Dr Detroit, MI | 1.0–2.0 | 1.0 | 750 | $1,222 | $1.63 | 14d | 5 | 1.30mi |
Listing history 17 events
-
2026-06-18days on market $54,900 Active 12 DOM
-
2026-06-17days on market $54,900 Active 11 DOM
-
2026-06-16days on market $54,900 Active 10 DOM
-
2026-06-15days on market $54,900 Active 9 DOM
-
2026-06-13days on market $54,900 Active 7 DOM
-
2026-06-13days on market $54,900 Active 6 DOM
-
2026-06-10price $54,900 Active 3 DOM
-
2026-06-09days on market $58,900 Active 3 DOM
Show marketing remark (963 chars)
MOTIVATED SELLER regrets having to back out of this project after making significant improvements due to personal reasons. Recent Updates Include: Brand New Roof (2025); New Furnace (2025); Hot Water Tank (2025); New Windows and New Doors (2025); New Glass Block Windows (2025 Basement); Laminate Flooring (2026); Ceramic Flooring and new cabinets in Kitchen (2026); Remodeled Bathroom with beautiful tile and higher end fixtures (2025) and Recessed Lighting throughout. Seller also updated the plumbing and electricity (wiring and panel - 2025) and replaced drain/lines beneath basement flooring. Here are a few 2 bdrm/1 bath comps just a few blocks away: 19749 Rosemont sold for $90k @ $119.52 per sq ft; 19195 Fenmore sold for $79,500 @ $110,41 per sq ft; 19425 Fenmore sold for $79,000 @ $109.72 per sq ft. Property currently falls under a tax abatement scheduled through 2029. BATVAI (Buyer's Agent To Verify All Information). SELLER WILL LOOK AT ALL OFFERS.
-
2026-06-08days on market $58,900 Active 2 DOM
-
2026-06-07pricedays on market $58,900 Active 1 DOM
-
2026-06-03days on market $64,999 Active 19 DOM
-
2026-06-02days on market $64,999 Active 18 DOM
-
2026-06-01days on market $64,999 Active 17 DOM
-
2026-05-31days on market $64,999 Active 16 DOM
-
2026-05-18historical
-
2026-05-14$64,999 Active
-
2026-05-14$64,999 Active 794-char remark
ⓘ Source: listings_history table (triggers on properties + properties_extension) + one-shot
backfill from property_details.listing_events for pre-trigger history.
Climate risk First Street
- Flood 1/10 Low FEMA zone X (unshaded) · 0% chance over 30 yrs
- Wildfire 1/10 Low
- Heat 3/10 Moderate 7 d/yr ≥98°F today · 15 d/yr by 30 yrs out
- Wind 2/10 Low
- Air quality 3/10 Moderate 2 unhealthy d/yr today · 5 by 30 yrs out
Nearby sold comps map
Loading sold comps map…
Walkable amenities ~0.75 mi
Loading nearby amenities…
Taxation est. · year 1
- Rental income
- $13,498
- − Mortgage interest
- −$3,075
- − Property taxes
- −$824
- − Insurance
- −$274
- − Repairs & maintenance
- −$1,080
- − Management
- −$1,080
- − Depreciation
- −$1,597
- Taxable income
- $5,568
- Est. tax owed @ 24.0%
- −$1,336
- After-tax cash flow
- $4,775/yr
For passive investors: Depreciation is non-cash, so a rental often shows a tax loss while cash-flowing — sheltering income. Rental losses are passive: they offset passive income freely, and up to $25,000/yr can offset ordinary (W-2) income if you actively participate and your MAGI is under $100k (phasing out to $0 by $150k); unused losses carry forward. On sale, claimed depreciation is recaptured at up to 25%, and gains may owe capital-gains tax (a 1031 exchange can defer both). Figures are a year-1 estimate at your 24.0% rate — not tax advice; consult a CPA.
Schools (NCES district)
- District
- Detroit Public Schools Community District
- NCES district ID
- 2601103
- Math proficiency
- 10% ▼ -2.00%
- Reading proficiency
- 24% ▲ 6.00%
- Median HH income
- $25,815
- Composite
- 13.06/100
- National rank
- #9564
- State rank
- #499 of 540 in MI
Livability — Detroit
- Score
- 73/100
- State rank
- #218
- US rank
- #5427
Category grades
Schools grade is shown separately in the Schools card above.
Census & demographics
- Census place
- Detroit, MI
- County
- Wayne County · 1,562,939 people
- City population
- 572,865
- Metro
- Detroit-Warren-Dearborn, MI
- Population (ZIP)
- 47,208
- Household income
- $43,655
- Rent vs Own
- Severe rent burden
- 3584.0
Population outlook (Wayne County) Hauer SSP2
- Today (2025)
- 1,675,273 people
- By 2030
- 1,620,300 · -3.3%
- By 2040
- 1,502,341 · -10.3%
- By 2050
- 1,384,039 · -17.4%
- By 2075
- 1,124,592 · -32.9%
- By 2100
- 881,193 · -47.4%
Race, ethnicity, and origin ACS 2023
- Neighborhood character
- Predominantly Black (88%)
- Race & ethnicity
- Black 88% White 5% Two or more races 4% Hispanic / Latino 1%
- Common ancestry
- Romanian 1% Lithuanian 1%
- Foreign-born
- 2% · Canada
- Languages at home
- 96% English-only · Spanish 1% French/Haitian/Cajun 1%
Political lean MEDSL · Wayne
- 2024 margin
- Strong D (+29.0) · D 62.7% · R 33.7% · Other 3.6%
- 2008→2024 swing
- -20.5pp toward R · 2008: 49.5pp · 2024: 29.0pp
- All cycles
- 2024: D+29.0 2020: D+38.1 2016: D+37.3 2012: D+46.9 2008: D+49.5
Not yet ingested
- Civics
- —
Market trends
- HPI YoY
- ▼ -65.06%
- Current HPI
- 563.3263
- Rent YoY
- ▲ 8.04%
- Metro
- Detroit-Warren-Dearborn, MI
- State GDP YoY
- ▲ 1.37%
- F500 in state
- 28
Industry mix (Fortune 500 HQ in MI)
| Industry | F500 HQs | Revenue |
|---|---|---|
| Automotive Parts | 3 | $48B |
|
||
| Automotive | 2 | $372B |
|
||
| Chemicals | 1 | $45B |
|
||
| Automotive Retail | 1 | $29B |
|
||
| Healthcare / Medical Devices | 1 | $23B |
|
||
| Automotive Technology | 1 | $20B |
|
||
Price history
-15.5% since first listed10 events — show timeline
- 2026-06-09 Price Changed $54,900 MiRealSource-MiMLS
- 2026-06-09 Price Changed $54,900 REALCOMP
- 2026-06-06 Listed $58,900 REALCOMP
- 2026-06-06 Listed $58,900 MiRealSource-MiMLS
- 2026-06-04 Listing Removed — MiRealSource-MiMLS
- 2026-06-04 Listing Removed — REALCOMP
- 2026-05-19 Relisted — REALCOMP
- 2026-05-18 Listing Removed — REALCOMP
- 2026-05-14 Listed $64,999 MiRealSource-MiMLS
- 2026-05-14 Listed $64,999 REALCOMP
Property tax history
+7.2%/yrLatest (2025): $2,812 · +243.4% YoY. Source: county tax records.
Cash-flow waterfall
monthlySold comps — $/sqft
last 12 mo · ≤1 miLoading sold comps…