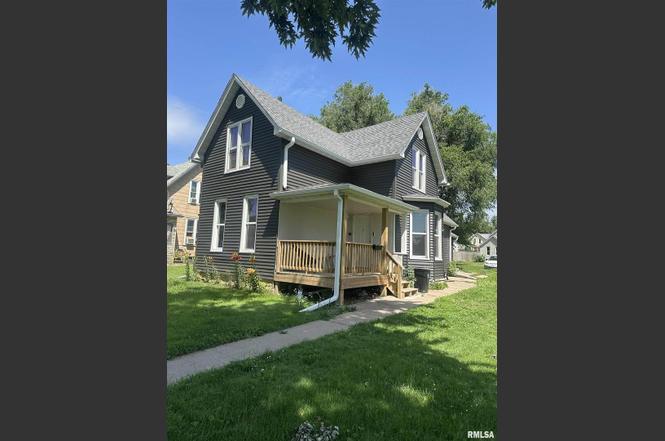
756 13th Ave S Ave S · Clinton, IA
Flood risk 1/10 · Minimal
- FEMA flood zone
- X (unshaded)
- Chance of flooding over 30 yrs
- 0.0%
- Est. flood insurance / yr
- $473 – $860
Fire risk 3/10 · Minor
- Est. fire insurance / yr
- $902 – $1,676
Heat risk 3/10 · Minor
- Hot days now (above 103°F)
- 7 days/yr
- Hot days in 30 yrs
- 16 days/yr
Wind risk 2/10 · Minimal
- Chance of severe wind over 30 yrs
- —
Air-quality risk 3/10 · Minor
- Unhealthy air days now
- 2 days/yr
- Unhealthy air days in 30 yrs
- 3 days/yr
Risk factors via First Street. Map © Google.
Why this score? — see what drove the B+ grade
The composite is a weighted blend of 9 inputs, each scored 0–100. Each bar is that input's sub-score; the figure is the points it added to the 100-point composite (weight × sub-score).
- Cash flow +30.0/30.0
- ARV discount +15.0/15.0
- 1% rule +10.0/10.0
- DSCR +10.0/10.0
- Schools +4.5/10.0
- Livability +3.8/5.0
- Rent growth +2.5/5.0
- Condition / age +2.5/5.0
- Appreciation +0.0/10.0
$57,400
🖨 Deal sheet (PDF) 📄 Offer letter ✓ Due diligence
Listing remarks
Three bedroom home with many updates! New roof in 2021, new siding, new gutters, new porch, new flooring, and newer windows! Both on street and off street parking with plenty of room in the back to build a garage!
Key facts
- New siding
- New flooring
- New gutters
Tags
Property features AI
Finance
- Other: Assessor reported living area; Built before 1978
- Financial info: No special service area
Exterior
- Parking: No garage; Alley access; Parking lot available
- Utilities: Public water; Public sewer; Electric with circuit breakers
- Home design: Detached single-family home; 1.5-story; Fee simple ownership; Property over 100 years old; Not rebuilt since original construction
- Construction: Vinyl siding; Block foundation
- Exterior features: Level lot; Lot dimensions approximately 60 x 140
Interior
- Bedrooms: 3 bedrooms
- Bathrooms: 1 full bathroom; 1 half bathroom
- Heating & cooling: Forced air heating (natural gas); Central air conditioning
- Interior features: Separate dining room; Partial basement with egress window
Neighborhood map
What this means for you Summary
Snapshot
- This is a 3-bed/1.5-bath single-family listed at $57k.
Deal economics
- At list price, monthly cash flow is $679 ($8k/yr) — positive.
- The deal already cash-flows at list — no discount required.
- Meets the 1% rule at list price ($1k rent vs $57k).
- Recommended offer: $57k (1.5% below list) — sets the bar for market timing.
- Cap rate 20.5% vs local median 6.7% in Clinton — top-decile yield for the area; either an underpriced asset or a hidden risk that comps aren't pricing in. Stress-test before assuming the spread holds.
Location & tenants
- Location reads 75/100 on livability (#222 in IA, #4,192 nationally) — a middle-class / working-renter tenant base. Strengths: cost of living A+, housing A+, health & safety A+; Watch: amenities C-, crime D, employment D.
- Clinton Community School District (town): math 52% / reading 56% proficiency, ranked #273 of 289 in IA (top 94%) — acceptable for families but not a draw, mixed tenant base, ~2y average lease.
- Zoned schools: Bluff Elementary School (math 52% / reading 47%, grade D, #514 of 616 statewide, top 85%, 385 students, 65% FRL); Clinton Middle School (math 49% / reading 53%, grade C, #210 of 246 statewide, top 87%, 749 students, 59% FRL); Clinton High School (math 43% / reading 57%, grade D+, #313 of 336 statewide, top 93%, 981 students, 49% FRL).
- Market conditions: 247 active listings in the ZIP; 6 comparable units currently listed for rent nearby; rentals lingering (median 46d on market — plan ~5-8 weeks vacancy on turnover, expect pricing pressure); 100% of comp listings sitting > 30 days — soft ceiling on asking rent; 116 units permitted in Clinton County in 2024 (50 in 5+ unit buildings).
Forward outlook
- Local home prices are declining (-3.0%/yr); year-one equity from $397 of loan paydown is wiped out by about $2k of value loss. Plan a longer hold.
- Clinton County population projected at -19% by 2050 — secular population decline; favor cash flow + early exit over multi-decade hold.
- At projected returns (-3.0% appreciation + 3.0% rent growth), your $16k cash investment doubles in ~3 years — after that, you're playing with house money.
Negotiation context
- It's been on market 29 days — a 2% lower offer ($57k) is reasonable based on typical stale-listing flexibility.
- 6 sale attempts with the ask held roughly flat each time — persistent listings suggest the price (not the market) is what's stuck; bring a comps-based counter.
Risks & watch-outs
- Watch-outs: built in 1900 — expect roof / HVAC / electrical / plumbing capex.
Questions for the listing agent
- Built in 1900 — when were the roof, HVAC, electrical panel, plumbing, and water heater last replaced?
- Is there a deadline driving the sale (1031 exchange, divorce, estate, relocation)? That informs how much negotiation room exists.
- Schools are B-rated — typically a magnet for longer-tenancy family renters. What's the average tenant stay here, and is there a school-zone premium baked into asking?
- Crime grade is D in this area — have there been break-ins, vandalism, or insurance claims at this property in the last 3 years? What carrier currently insures it and at what premium?
- What's the average days-on-market for RENTAL listings here right now (not sales)? A rising rental-DOM trend means longer vacancies and softer asking-rent achievability than the comps imply.
- What's the recent tenant-quality profile in this submarket — average credit score on applications, eviction rate, late-payment / NSF rate, and stable-employment percentage? A property-management company in the area should have these aggregated.
- How much new for-sale + rental construction is in the pipeline within 1–3 miles? Heavy new supply typically softens prices + rents 12–24 months out; constrained supply supports both.
Investment metrics
- 1% rule
- 2.36% ✓
- Cap rate
- 20.48%
- Cash-on-cash
- 50.67%
- DSCR
- 3.25
- GRM
- 3.5
CMA / ARV
- ARV (on-the-fly)
- $87,768
- Comps found
- 12
Show comp detail 12 sales within ~0.75 mi
| Address | Dist | Beds/Ba | Sqft | Sold | Price | $/sf | Match |
|---|---|---|---|---|---|---|---|
| 756 13th Ave S | 0.00mi | 3/1.5 | 1,219 (0%) | 4mo | $50,500 | $41 | 97 |
| 635 8th Ave S | 0.37mi | 2/1.0 (-1) | 1,210 (-1%) | 6mo | $36,525 | $30 | 70 |
| 1408 S 10th St | 0.35mi | 2/1.0 (-1) | 1,164 (-4%) | 1mo | $125,000 | $107 | 68 |
| 740 15th Ave S | 0.12mi | 2/1.0 (-1) | 1,086 (-11%) | 2mo | $40,000 | $37 | 67 |
| 1115 S 12th St | 0.56mi | 3/1.5 | 1,175 (-4%) | 2mo | $87,000 | $74 | 66 |
| 837 14th Ave S | 0.18mi | 2/1.0 (-1) | 1,098 (-10%) | 3mo | $79,500 | $72 | 65 |
| 935 10th Ave S | 0.41mi | 2/2.0 (-1) | 1,233 (+1%) | 10mo | $99,900 | $81 | 64 |
| 765 9th Ave S | 0.28mi | 2/1.0 (-1) | 1,353 (+11%) | 6mo | $102,500 | $76 | 57 |
| 912 13th Ave S | 0.25mi | 3/1.0 | 1,048 (-14%) | 11mo | $75,000 | $72 | 54 |
| 1148 Briarcliff Ln | 0.52mi | 3/1.0 | 1,332 (+9%) | 10mo | $85,000 | $64 | 50 |
| 1043 14th Ave S | 0.44mi | 2/2.0 (-1) | 1,359 (+12%) | 5mo | $130,000 | $96 | 49 |
| 1313 Harrison Dr | 0.75mi | 4/1.5 (+1) | 1,392 (+14%) | 7mo | $94,000 | $68 | 30 |
Match score weights: distance 35% · size 25% · config 20% · recency 20%. Top-matched comps best support the ARV.
Projected returns pro-forma
-3.0% appreciation · 3.0% rent growth · sell at horizon
- IRR
- 48.5%
- Equity multiple
- 3.11×
- Total profit
- $33,937
- Equity at exit
- $8,559
- IRR
- 54.1%
- Equity multiple
- 6.31×
- Total profit
- $85,276
- Equity at exit
- $4,963
Cash invested: $16,072 (down + closing). Projections, not guarantees.
Landlord ↔ Tenant lean methodology
- Overall (STATE)
- 83 Strongly Landlord-Friendly
- State Iowa
- 83 Strongly Landlord-Friendly · R+6
- County
- — inherits STATE
- City
- — inherits STATE
ZIP-level market 52732
- Home prices YoY
- -34.9%
- Active inventory
- 247
- Price-to-rent
- 3.5×
Monthly cashflow live
- Estimated rent
- $1,354 high interval (Pro) →
- Mortgage (P&I)
- −$301
- Tax from tax record
- −$66 /mo · $796/yr
- Insurance
- −$24
- HOA
- −$0
- Lot rent
- −$0
- Vacancy / Maint / Mgmt
- −$284
- Net cashflow
- $679
Break-even live
Sensitivity live
| Price | -10% $711 | -5% $695 | +0% $679 | +5% $662 | +10% $646 |
|---|---|---|---|---|---|
| Rent | -10% $572 | -5% $625 | +0% $679 | +5% $732 | +10% $786 |
| Rate | -1.0pp $708 | -0.5pp $693 | base $679 | +0.5pp $664 | +1.0pp $649 |
UW: 25.0% down · 7.5% · 30yr · 1.5% tax · 5.0% vac · 8.0% maint · 8.0% mgmt
Financing live
Cash to close
- Down payment
- $14,350
- Closing costs
- $1,722
- Reserves months
- —
- Total cash needed
- —
Loan-product check · same deal, 3 products live
Conventional
25% down · 7.5% · 30yr
- Down + closing
- —
- Monthly P&I
- —
- Monthly cashflow
- —
- DSCR
- —
- Eligible?
- —
Personal DTI + credit; lowest rate.
DSCR
20% down · 8.5% · 30yr
- Down + closing
- —
- Monthly P&I
- —
- Monthly cashflow
- —
- DSCR
- —
- Eligible?
- —
No personal income docs; deal must DSCR.
Hard money
10% down · 12.0% · 12mo
- Down + closing
- —
- Monthly P&I
- —
- Monthly cashflow
- —
- DSCR
- —
- Eligible?
- —
Short-term bridge; refi at stabilization.
Rent comps 6 comps
| Address | Beds | Baths | Sqft | Rent | $/sqft | DOM | Units | Dist |
|---|---|---|---|---|---|---|---|---|
| 1006 S 4th St Clinton, IA | 3.0 | 2.5 | 1467 | $1,700 | $1.16 | 46d | 1 | 0.53mi |
| 1004 S 4th St Clinton, IA | 3.0 | 2.5 | 1467 | $1,700 | $1.16 | 46d | 1 | 0.53mi |
| 1008 S 4th St Clinton, IA | 3.0 | 2.5 | 1467 | $1,750 | $1.19 | 46d | 1 | 0.54mi |
| 1002 S 4th St Clinton, IA | 3.0 | 2.5 | 1467 | $1,750 | $1.19 | 46d | 1 | 0.54mi |
| 1216 9th Ave S Clinton, IA | 2.0 | 1.0 | 804 | $1,000 | $1.24 | 46d | 1 | 0.68mi |
| 516 2nd Ave S Unit 2 Clinton, IA | 2.0 | 1.0 | 1082 | $750 | $0.69 | 46d | 1 | 0.94mi |
Listing history 18 events
-
2026-05-22$57,400 Active
-
2026-03-10soldstatus $50,500
-
2026-02-26soldstatus Closed
-
2026-01-17status Pending
-
2026-01-15status Active
-
2026-01-14historical
-
2026-01-08status Active
-
2026-01-06historical
-
2026-01-05status Active
-
2026-01-05price $57,400
-
2026-01-05historical
-
2025-12-04price
-
2025-12-02status Active
-
2025-12-02historical
-
2025-08-13status Pending
-
2025-08-08price
-
2025-07-18price
-
2025-06-24Active
ⓘ Source: listings_history table (triggers on properties + properties_extension) + one-shot
backfill from property_details.listing_events for pre-trigger history.
Tax reassessment forecast IA · Partial reset (capped growth)
- Current annual tax
- $796 · $66/mo
- Projected year-2 tax
- $849 · $71/mo
- Expected delta
- +$53/yr (+$4/mo · 6.6%)
ⓘ Screening estimate from a state-policy table — verify with the county assessor before closing.
Climate risk First Street
- Flood 1/10 Low FEMA zone X (unshaded) · 0% chance over 30 yrs
- Wildfire 3/10 Moderate
- Heat 3/10 Moderate 7 d/yr ≥103°F today · 16 d/yr by 30 yrs out
- Wind 2/10 Low
- Air quality 3/10 Moderate 2 unhealthy d/yr today · 3 by 30 yrs out
Nearby sold comps map
Loading sold comps map…
Walkable amenities ~0.75 mi
Loading nearby amenities…
Taxation est. · year 1
- Rental income
- $16,251
- − Mortgage interest
- −$3,215
- − Property taxes
- −$796
- − Insurance
- −$287
- − Repairs & maintenance
- −$1,300
- − Management
- −$1,300
- − Depreciation
- −$1,670
- Taxable income
- $7,683
- Est. tax owed @ 24.0%
- −$1,844
- After-tax cash flow
- $6,300/yr
For passive investors: Depreciation is non-cash, so a rental often shows a tax loss while cash-flowing — sheltering income. Rental losses are passive: they offset passive income freely, and up to $25,000/yr can offset ordinary (W-2) income if you actively participate and your MAGI is under $100k (phasing out to $0 by $150k); unused losses carry forward. On sale, claimed depreciation is recaptured at up to 25%, and gains may owe capital-gains tax (a 1031 exchange can defer both). Figures are a year-1 estimate at your 24.0% rate — not tax advice; consult a CPA.
Schools (NCES district)
- District
- Clinton Community School District
- NCES district ID
- 1907710
- Math proficiency
- 52% ▼ -13.00%
- Reading proficiency
- 56% ▼ -8.00%
- Median HH income
- $40,900
- Composite
- 45.22/100
- National rank
- #2666
- State rank
- #273 of 289 in IA
Livability — Clinton
- Score
- 75/100
- State rank
- #222
- US rank
- #4192
Category grades
Schools grade is shown separately in the Schools card above.
Census & demographics
- Census place
- Clinton, IA
- County
- Clinton County · 25,880 people
- City population
- 25,880
- Metro
- Clinton, IA
- Population (ZIP)
- 25,880
- Household income
- $61,105
- Rent vs Own
- Severe rent burden
- 889.0
Population outlook (Clinton County) Hauer SSP2
- Today (2025)
- 44,817 people
- By 2030
- 43,090 · -3.9%
- By 2040
- 39,513 · -11.8%
- By 2050
- 36,209 · -19.2%
- By 2075
- 31,888 · -28.8%
- By 2100
- 30,382 · -32.2%
Race, ethnicity, and origin ACS 2023
- Neighborhood character
- Predominantly White (86%)
- Race & ethnicity
- White 86% Two or more races 7% Hispanic / Latino 5% Black 4%
- Common ancestry
- Iranian 4% Portuguese 2% Lithuanian 2%
- Foreign-born
- 2% · Canada
- Languages at home
- 97% English-only · Spanish 2% Arabic 1%
Political lean MEDSL · Clinton
- 2024 margin
- R (+18.9) · D 39.8% · R 58.6% · Other 1.6%
- 2008→2024 swing
- -41.9pp toward R · 2008: 23.0pp · 2024: -18.9pp
- All cycles
- 2024: R+18.9 2020: R+10.3 2016: R+5.1 2012: D+22.9 2008: D+23.0
Not yet ingested
- Civics
- —
Market trends
- HPI YoY
- ▼ -83.23%
- Current HPI
- 155.3426
- Rent YoY
- —
- Metro
- Clinton, IA
- State GDP YoY
- ▲ 2.48%
- F500 in state
- 4
Industry mix (Fortune 500 HQ in IA)
| Industry | F500 HQs | Revenue |
|---|---|---|
| Financial Services | 1 | $16B |
|
||
| Retail / Convenience | 1 | $15B |
|
||
Price history
+0.0% since first listed18 events — show timeline
- 2026-05-22 Listed $57,400 MRED as Distributed by MLS Grid
- 2026-03-10 Sold (Public Records) $50,500 Public Records
- 2026-02-26 Sold (MLS) — MRED as Distributed by MLS Grid
- 2026-01-17 Pending — MRED as Distributed by MLS Grid
- 2026-01-15 Relisted — MRED as Distributed by MLS Grid
- 2026-01-14 Listing Removed — MRED as Distributed by MLS Grid
- 2026-01-08 Relisted — MRED as Distributed by MLS Grid
- 2026-01-06 Listing Removed — MRED as Distributed by MLS Grid
- 2026-01-05 Relisted — MRED as Distributed by MLS Grid
- 2026-01-05 Price Changed $57,400 MRED as Distributed by MLS Grid
- 2026-01-05 Listing Removed — MRED as Distributed by MLS Grid
- 2025-12-04 Price Changed — RMLSA as Distributed by MLS Grid
- 2025-12-02 Relisted — RMLSA as Distributed by MLS Grid
- 2025-12-02 Listing Removed — RMLSA as Distributed by MLS Grid
- 2025-08-13 Pending — RMLSA as Distributed by MLS Grid
- 2025-08-08 Price Changed — RMLSA as Distributed by MLS Grid
- 2025-07-18 Price Changed — RMLSA as Distributed by MLS Grid
- 2025-06-24 Listed — RMLSA as Distributed by MLS Grid
Property tax history
+0.7%/yrLatest (2025): $796 · -30.1% YoY. Source: county tax records.
Cash-flow waterfall
monthlySold comps — $/sqft
last 12 mo · ≤1 miLoading sold comps…