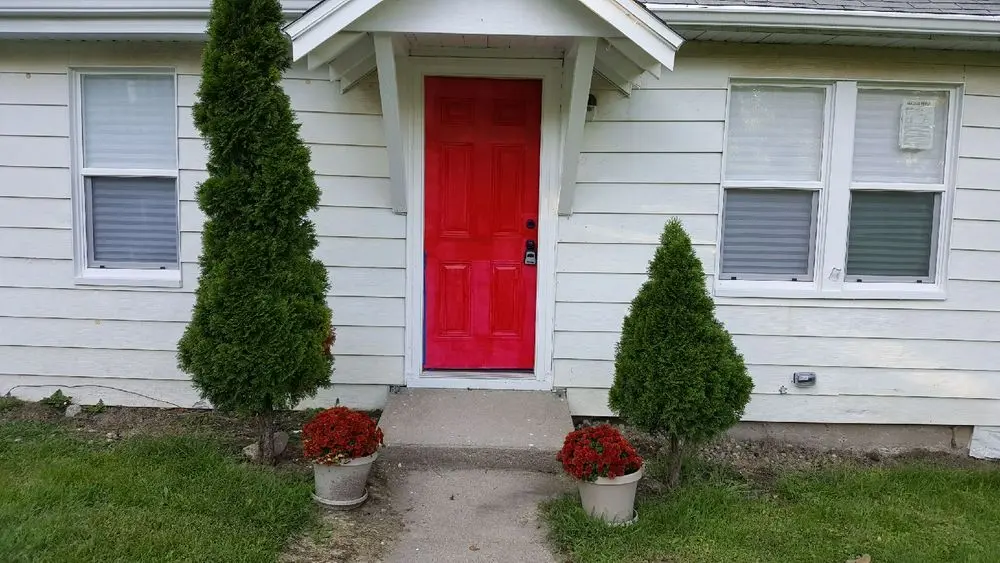
3518 Easton Blvd · Des Moines, IA
Flood risk 1/10 · Minimal
- FEMA flood zone
- X (unshaded)
- Chance of flooding over 30 yrs
- 0.0%
- Est. flood insurance / yr
- $473 – $860
Fire risk 1/10 · Minimal
- Est. fire insurance / yr
- $902 – $1,676
Heat risk 3/10 · Minor
- Hot days now (above 103°F)
- 7 days/yr
- Hot days in 30 yrs
- 15 days/yr
Wind risk 2/10 · Minimal
- Chance of severe wind over 30 yrs
- —
Air-quality risk 1/10 · Minimal
- Unhealthy air days now
- 0 days/yr
- Unhealthy air days in 30 yrs
- 0 days/yr
Risk factors via First Street. Map © Google.
Why this score? — see what drove the C+ grade
The composite is a weighted blend of 9 inputs, each scored 0–100. Each bar is that input's sub-score; the figure is the points it added to the 100-point composite (weight × sub-score).
- Cash flow +21.1/30.0
- ARV discount +15.0/15.0
- DSCR +6.7/10.0
- 1% rule +5.7/10.0
- Livability +4.0/5.0
- Schools +3.8/10.0
- Rent growth +3.1/5.0
- Condition / age +2.5/5.0
- Appreciation +0.0/10.0
$93,500
🖨 Deal sheet 📄 Offer letter ✓ Due diligence
Listing remarks MLS
INVESTOR SPECIAL - FIXER - MUST SELL 2 bedroom, 1 bathroom single family resident. Property needs repairs and updates and is being sold AS-IS. Perfect opportunity for a fix & flip, rental, or buy-and-hold investor. - Strong rental area - Value-add potential - Solid footprint - Quick closing available This is not a move-in ready home!!! Bring your contractor and your vision. Price: $93,500 Cash, hard money, FHA/203K or private money preferred Fast, clean close ________________________________________ Terms: Sold AS-IS No repairs will be made Buyer pays closing costs Proof of funds required ________________________________________ Interested? Reply to this post with your name, phone number, and buying timeframe to schedule a walkthrough or get more details. Call me (515) 303-2593 or setup some time with me at. .. www. calendly.com/jamesmooresr. Serious buyers only. First come, first served.
Key facts
- 0.3 acre lot
- Built 1910
- Listed 178 days
Neighborhood map
What this means for you Summary
Snapshot
- This is a 2-bed/1.0-bath single-family listed at $94k.
Deal economics
- At list price, monthly cash flow is $134 ($2k/yr) — positive.
- The deal already cash-flows at list — no discount required.
- Meets the 1% rule at list price ($1k rent vs $94k).
- Recommended offer: $82k (12.0% below list) — sets the bar for market timing.
- Cap rate 8.0% vs local median 3.1% in Des Moines — top-decile yield for the area; either an underpriced asset or a hidden risk that comps aren't pricing in. Stress-test before assuming the spread holds.
Location & tenants
- Location reads 81/100 on livability (#63 in IA, #1,432 nationally) — a professional / high-income tenant draw. Strengths: commute A+, cost of living A+, housing A+; Watch: employment C-, schools D+, crime F.
- Des Moines Independent Community School District (urban): math 43% / reading 46% proficiency, ranked #289 of 289 in IA (top 100%) — families likely to look elsewhere, expect single-tenant / working-renter base with shorter leases; 63% free/reduced lunch — lower-income household profile, screen leases tightly.
- Market conditions: Rents rising (+2.3%/yr); 357 active listings in the ZIP; 6 comparable units currently listed for rent nearby; rentals at typical pace (median 15d on market — plan ~3-4 weeks tenant-placement turnaround); 2,953 units permitted in Polk County in 2024 (540 in 5+ unit buildings).
Forward outlook
- Local home prices are declining (-3.0%/yr); year-one equity from $646 of loan paydown is wiped out by about $3k of value loss. Plan a longer hold.
- Polk County population projected at +37% by 2050 — long-run rental-demand tailwind backs the buy-and-hold thesis.
Negotiation context
- It's been on market 178 days — a 12% lower offer ($82k) is reasonable based on typical stale-listing flexibility.
- 7 sale attempts since 12y ago with the ask held roughly flat each time — persistent listings suggest the price (not the market) is what's stuck; bring a comps-based counter.
- Current owner paid $80k; 17% above their basis — modest negotiation headroom, anchor on the comps not their cost.
Risks & watch-outs
- Watch-outs: built in 1910 — expect roof / HVAC / electrical / plumbing capex.
Questions for the listing agent
- It's been on market 178 days. Have you received any prior offers? Is the seller open to a 12% concession, seller financing, or rate buy-down credit?
- Built in 1910 — when were the roof, HVAC, electrical panel, plumbing, and water heater last replaced?
- Why hasn't it sold? Are there any deal-killer items the seller is aware of (foundation, flood, title, zoning, code violations)?
- Is there a deadline driving the sale (1031 exchange, divorce, estate, relocation)? That informs how much negotiation room exists.
- Schools are D-rated, which usually means shorter tenancies and higher turnover. Who's the typical renter profile here, and what's been the actual vacancy rate?
- Crime grade is F in this area — have there been break-ins, vandalism, or insurance claims at this property in the last 3 years? What carrier currently insures it and at what premium?
- What's the average days-on-market for RENTAL listings here right now (not sales)? A rising rental-DOM trend means longer vacancies and softer asking-rent achievability than the comps imply.
- What's the recent tenant-quality profile in this submarket — average credit score on applications, eviction rate, late-payment / NSF rate, and stable-employment percentage? A property-management company in the area should have these aggregated.
- How much new for-sale + rental construction is in the pipeline within 1–3 miles? Heavy new supply typically softens prices + rents 12–24 months out; constrained supply supports both.
Investment metrics
- 1% rule
- 1.07% ✓
- Cap rate
- 8.01%
- Cash-on-cash
- 6.14%
- DSCR
- 1.27
- GRM
- 7.8
CMA / ARV
- ARV (median comp)
- $168,253
- List price
- $93,500
- Delta
- -44.43%
- Verdict
- UNDERPRICED
- Comps
- 20 within 1.0 mi
Show comp detail 12 sales within ~0.75 mi
| Address | Dist | Beds/Ba | Sqft | Sold | Price | $/sf | Match |
|---|---|---|---|---|---|---|---|
| 3504 Easton Blvd | 0.03mi | 2/1.0 | 604 (-1%) | 3mo | $20,000 | $33 | 94 |
| 2345 E 37th Ct | 0.30mi | 2/1.0 | 661 (+8%) | 2mo | $124,000 | $188 | 71 |
| 2311 Williams St | 0.74mi | 2/1.0 | 616 (+1%) | 6mo | $160,000 | $260 | 59 |
| 2347 E 38th Ct | 0.40mi | 2/1.0 | 672 (+10%) | 15mo | $125,000 | $186 | 52 |
| 2508 E 41st St | 0.65mi | 2/1.0 | 624 (+2%) | 17mo | $165,000 | $264 | 52 |
| 1309 E 34th St | 0.69mi | 2/1.0 | 600 (-2%) | 16mo | $104,900 | $175 | 51 |
| 1916 E 40th Ct | 0.55mi | 2/2.0 | 572 (-6%) | 12mo | $163,000 | $285 | 49 |
| 2528 E 38th Ct | 0.44mi | 2/1.0 | 694 (+13%) | 13mo | $136,900 | $197 | 46 |
| 3108 Kinsey Ave | 0.67mi | 3/1.0 (+1) | 672 (+10%) | 6mo | $152,500 | $227 | 42 |
| 3253 Kinsey Ave | 0.57mi | 2/1.5 | 685 (+12%) | 15mo | $150,000 | $219 | 39 |
| 1315 E 33rd Ct | 0.70mi | 3/1.0 (+1) | 696 (+14%) | 4mo | $172,000 | $247 | 36 |
| 3004 E Washington Ave | 0.72mi | 1/1.0 (-1) | 540 (-12%) | 18mo | $122,000 | $226 | 27 |
Match score weights: distance 35% · size 25% · config 20% · recency 20%. Top-matched comps best support the ARV.
Projected returns pro-forma
-3.0% appreciation · 2.29% rent growth · sell at horizon
- IRR
- -7.6%
- Equity multiple
- 0.72×
- Total profit
- $-7,310
- Equity at exit
- $13,941
- IRR
- 1.0%
- Equity multiple
- 1.07×
- Total profit
- $1,833
- Equity at exit
- $8,084
Cash invested: $26,180 (down + closing). Projections, not guarantees.
Landlord ↔ Tenant lean methodology
- Overall (STATE)
- 83 Strongly Landlord-Friendly
- State Iowa
- 83 Strongly Landlord-Friendly · R+6
- County
- — inherits STATE
- City
- — inherits STATE
ZIP-level market 50317
- Rents YoY
- 2.3%
- Active inventory
- 357
- Price-to-rent
- 7.8×
Monthly cashflow live
- Estimated rent
- $1,002 high interval (Pro) →
- Mortgage (P&I)
- −$490
- Tax from tax record
- −$129 /mo · $1,544/yr
- Insurance
- −$39
- HOA
- −$0
- Vacancy / Maint / Mgmt
- −$210
- Net cashflow
- $134
Break-even live
UW: 25.0% down · 7.5% · 30yr · 1.5% tax · 5.0% vac · 8.0% maint · 8.0% mgmt
Financing live
Cash to close
- Down payment
- $23,375
- Closing costs
- $2,805
- Reserves months
- —
- Total cash needed
- —
Loan-product check · same deal, 3 products live
Conventional
25% down · 7.5% · 30yr
- Down + closing
- —
- Monthly P&I
- —
- Monthly cashflow
- —
- DSCR
- —
- Eligible?
- —
Personal DTI + credit; lowest rate.
DSCR
20% down · 8.5% · 30yr
- Down + closing
- —
- Monthly P&I
- —
- Monthly cashflow
- —
- DSCR
- —
- Eligible?
- —
No personal income docs; deal must DSCR.
Hard money
10% down · 12.0% · 12mo
- Down + closing
- —
- Monthly P&I
- —
- Monthly cashflow
- —
- DSCR
- —
- Eligible?
- —
Short-term bridge; refi at stabilization.
Rent comps 6 comps
| Address | Beds | Baths | Sqft | Rent | $/sqft | DOM | Units | Dist |
|---|---|---|---|---|---|---|---|---|
| 1220 E 37th Ct Des Moines, IA | 2.0 | 1.0 | 560 | $950 | $1.70 | 23d | 1 | 0.90mi |
| 3722 Hubbell Ave Des Moines, IA | 1.0–2.0 | 1.0–2.0 | 766 | $975 | $1.27 | 14d | 2 | 1.13mi |
| 2938 E Euclid Ave Unit 2 Des Moines, IA | 2.0 | 1.0 | 575 | $650 | $1.13 | 14d | 1 | 1.16mi |
| 3560 E Douglas Ave Des Moines, IA | 1.0–3.0 | 1.0–2.0 | 870 | $985 | $1.13 | 14d | 14 | 1.31mi |
| 2555 Wedgewood Rd Des Moines, IA | 1.0 | 1.0 | 650 | $750 | $1.15 | 14d | 1 | 1.41mi |
| 4014 Hubbell Ave Des Moines, IA | 1.0–2.0 | 1.0 | 750 | $1,200 | $1.60 | 14d | 13 | 1.44mi |
Listing history 32 events
-
2026-06-18days on market $93,500 Active 178 DOM
-
2026-06-17days on market $93,500 Active 177 DOM
-
2026-06-16days on market $93,500 Active 176 DOM
-
2026-06-15days on market $93,500 Active 175 DOM
-
2026-06-14days on market $93,500 Active 173 DOM
-
2026-06-13days on market $93,500 Active 172 DOM
-
2026-06-10days on market $93,500 Active 170 DOM
-
2026-06-09days on market $93,500 Active 169 DOM
-
2026-06-08days on market $93,500 Active 168 DOM
-
2026-06-07days on market $93,500 Active 167 DOM
-
2026-06-05days on market $93,500 Active 164 DOM
-
2026-06-03days on market $93,500 Active 163 DOM
-
2026-06-02days on market $93,500 Active 162 DOM
-
2026-06-01days on market $93,500 Active 161 DOM
-
2026-05-31days on market $93,500 Active 160 DOM
-
2026-05-31days on market $93,500 Active 159 DOM
-
2025-12-22$93,500 Active 920-char remark
Show marketing remark (920 chars)
INVESTOR SPECIAL - FIXER - MUST SELL 2 bedroom, 1 bathroom single family resident. Property needs repairs and updates and is being sold AS-IS. Perfect opportunity for a fix & flip, rental, or buy-and-hold investor. - Strong rental area - Value-add potential - Solid footprint - Quick closing available This is not a move-in ready home!!! Bring your contractor and your vision. Price: $93,500 Cash, hard money, FHA/203K or private money preferred Fast, clean close ________________________________________ Terms: Sold AS-IS No repairs will be made Buyer pays closing costs Proof of funds required ________________________________________ Interested? Reply to this post with your name, phone number, and buying timeframe to schedule a walkthrough or get more details. Call me (515) 303-2593 or setup some time with me at. .. www. calendly.com/jamesmooresr. Serious buyers only. First come, first served.
-
2025-12-21historical
-
2025-11-14price $99,900
-
2025-06-04$117,900 Active
-
2023-11-06historical $1,025
-
2023-11-04$1,025
-
2023-09-23historical $1,025
-
2023-09-22$1,025
-
2023-04-06soldstatus $79,875
-
2017-12-14soldstatus $20,000
-
2017-11-02$20,000
-
2014-11-03historical
-
2014-03-25$13,500
-
2014-03-24historical
-
2014-01-24$18,000
-
2008-12-09soldstatus $47,000
ⓘ Source: listings_history table (triggers on properties + properties_extension) + one-shot
backfill from property_details.listing_events for pre-trigger history.
Tax reassessment forecast IA · Partial reset (capped growth)
- Current annual tax
- $1,544 · $129/mo
- Projected year-2 tax
- $1,544 · $129/mo
- Expected delta
- $0/yr ($0/mo · 0.0%)
ⓘ Screening estimate from a state-policy table — verify with the county assessor before closing.
Climate risk First Street
- Flood 1/10 Low FEMA zone X (unshaded) · 0% chance over 30 yrs
- Wildfire 1/10 Low
- Heat 3/10 Moderate 7 d/yr ≥103°F today · 15 d/yr by 30 yrs out
- Wind 2/10 Low
- Air quality 1/10 Low 0 unhealthy d/yr today · 0 by 30 yrs out
Nearby sold comps map
Loading sold comps map…
Walkable amenities ~0.75 mi
Loading nearby amenities…
Taxation est. · year 1
- Rental income
- $12,029
- − Mortgage interest
- −$5,237
- − Property taxes
- −$1,544
- − Insurance
- −$468
- − Repairs & maintenance
- −$962
- − Management
- −$962
- − Depreciation
- −$2,720
- Taxable income
- $135
- Est. tax owed @ 24.0%
- −$32
- After-tax cash flow
- $1,575/yr
For passive investors: Depreciation is non-cash, so a rental often shows a tax loss while cash-flowing — sheltering income. Rental losses are passive: they offset passive income freely, and up to $25,000/yr can offset ordinary (W-2) income if you actively participate and your MAGI is under $100k (phasing out to $0 by $150k); unused losses carry forward. On sale, claimed depreciation is recaptured at up to 25%, and gains may owe capital-gains tax (a 1031 exchange can defer both). Figures are a year-1 estimate at your 24.0% rate — not tax advice; consult a CPA.
Schools (NCES district)
- District
- Des Moines Independent Community School District
- NCES district ID
- 1908970
- Math proficiency
- 43% ▼ -6.00%
- Reading proficiency
- 46% ▼ -1.00%
- Median HH income
- $45,905
- Composite
- 37.83/100
- National rank
- #4331
- State rank
- #289 of 289 in IA
Livability — Des Moines
- Score
- 81/100
- State rank
- #63
- US rank
- #1432
Category grades
Schools grade is shown separately in the Schools card above.
Census & demographics
- Census place
- Des Moines, IA
- County
- Polk County · 453,298 people
- City population
- 203,612
- Metro
- Des Moines-West Des Moines, IA
- Population (ZIP)
- 36,548
- Household income
- $65,617
- Rent vs Own
- Severe rent burden
- 716.0
Population outlook (Polk County) Hauer SSP2
- Today (2025)
- 548,042 people
- By 2030
- 588,557 · +7.4%
- By 2040
- 670,629 · +22.4%
- By 2050
- 752,830 · +37.4%
- By 2075
- 955,069 · +74.3%
- By 2100
- 1,115,436 · +103.5%
Race, ethnicity, and origin ACS 2023
- Neighborhood character
- Majority White (65%)
- Race & ethnicity
- White 65% Hispanic / Latino 19% Two or more races 10% Black 10% Asian 3%
- Hispanic origin (detail)
- Mexican 15% Puerto Rican 1%
- Common ancestry
- Portuguese 3% Iranian 2% Swiss 1%
- Foreign-born
- 12% · Canada
- Languages at home
- 80% English-only · Spanish 13% Other Asian/Pacific 2%
Political lean MEDSL · Polk
- 2024 margin
- D (+10.9) · D 54.8% · R 43.9% · Other 1.3%
- 2008→2024 swing
- -3.7pp toward R · 2008: 14.6pp · 2024: 10.9pp
- All cycles
- 2024: D+10.9 2020: D+15.2 2016: D+11.5 2012: D+14.2 2008: D+14.6
Not yet ingested
- Civics
- —
Market trends
- HPI YoY
- ▼ -235.00%
- Current HPI
- 281.7409
- Rent YoY
- ▲ 2.29%
- Metro
- Des Moines-West Des Moines, IA
- State GDP YoY
- ▲ 2.48%
- F500 in state
- 4
Industry mix (Fortune 500 HQ in IA)
| Industry | F500 HQs | Revenue |
|---|---|---|
| Financial Services | 1 | $16B |
|
||
| Retail / Convenience | 1 | $15B |
|
||
Price history
+98.9% since first listed16 events — show timeline
- 2025-12-22 Listed $93,500 ForSaleByOwner.com
- 2025-12-21 Listing Removed — DMMLS
- 2025-11-14 Price Changed $99,900 DMMLS
- 2025-06-04 Listed $117,900 DMMLS
- 2023-11-06 Rental Removed $1,025 TURBOTENANT
- 2023-11-04 Listed for Rent $1,025 TURBOTENANT
- 2023-09-23 Rental Removed $1,025 TURBOTENANT
- 2023-09-22 Listed for Rent $1,025 TURBOTENANT
- 2023-04-06 Sold (Public Records) $79,875 Public Records
- 2017-12-14 Sold (MLS) $20,000 DMMLS
- 2017-11-02 Listed $20,000 DMMLS
- 2014-11-03 Listing Removed — DMMLS
- 2014-03-25 Listed $13,500 DMMLS
- 2014-03-24 Listing Removed — DMMLS
- 2014-01-24 Listed $18,000 DMMLS
- 2008-12-09 Sold (Public Records) $47,000 Public Records
Property tax history
+4.1%/yrLatest (2025): $1,544 · +2.1% YoY. Source: county tax records.
Cash-flow waterfall
monthlySold comps — $/sqft
last 12 mo · ≤1 miLoading sold comps…