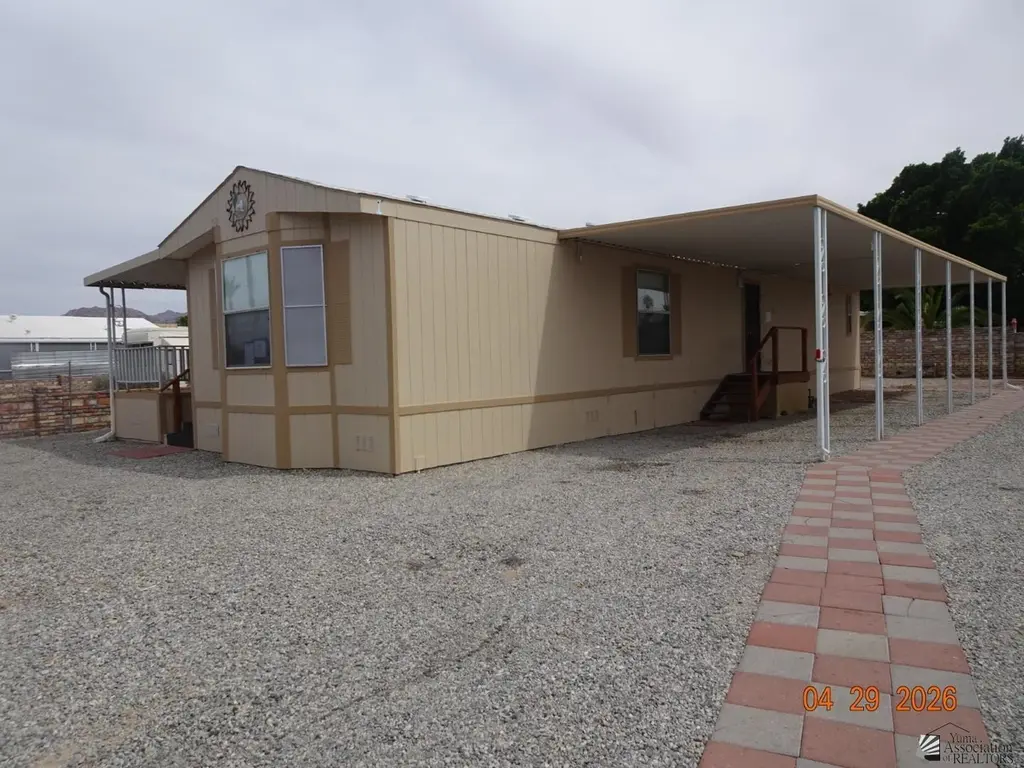
13209 E 47 St · Fortuna Foothills, AZ
Flood risk 1/10 · Minimal
- FEMA flood zone
- X (shaded)
- Chance of flooding over 30 yrs
- 0.0%
- Est. flood insurance / yr
- $507 – $1,088
Fire risk 4/10 · Minor
- Est. fire insurance / yr
- $610 – $1,132
Heat risk 9/10 · Severe
- Hot days now (above 113°F)
- 5 days/yr
- Hot days in 30 yrs
- 14 days/yr
Wind risk 1/10 · Minimal
- Chance of severe wind over 30 yrs
- —
Air-quality risk 2/10 · Minimal
- Unhealthy air days now
- 1 days/yr
- Unhealthy air days in 30 yrs
- 2 days/yr
Risk factors via First Street. Map © Google.
Why this score? — see what drove the C+ grade
The composite is a weighted blend of 9 inputs, each scored 0–100. Each bar is that input's sub-score; the figure is the points it added to the 100-point composite (weight × sub-score).
- Cash flow +24.2/30.0
- ARV discount +15.0/15.0
- DSCR +7.8/10.0
- 1% rule +5.1/10.0
- Rent growth +3.6/5.0
- Livability +3.0/5.0
- Condition / age +2.5/5.0
- Schools +1.3/10.0
- Appreciation +0.0/10.0
$136,000
🖨 Deal sheet 📄 Offer letter ✓ Due diligence
Listing remarks
3209 E. 47th Street offers a unique opportunity for buyers looking for space, views, and potential. The elevated covered deck provides fantastic views of the surrounding area and is the perfect spot to relax and enjoy the outdoors. Features a large lot with plenty of room for RVs, a detached workshop adds even more versatility and could potentially be converted into a bathroom, laundry room or Kitchen area for RV guest unit, depending on your needs and vision. This property is full of possibilities and is waiting for the right owner. Whether you're looking for a spacious retreat, a project with great upside, or room to expand, this is one you won't want to miss. Come take a look and imagin
Key facts
- Large lot
- Detached workshop
- 7,051 sq ft lot
Tags
Property features AI
Exterior
- Parking: 1 total parking space; 1 covered space; Attached carport
- Utilities: Public water; Public sewer
- Home design: Manufactured home (Residential); Located in Foothills Mobile Est #16
- Exterior features: Paved road access; Workshop on the property; Curbs in the community
Interior
- Kitchen: Electric range
- Flooring: Laminate flooring
- Bathrooms: 2 full bathrooms
- Heating & cooling: Has heating; Has cooling
- Interior features: Electric range; No fireplace
Neighborhood map
What this means for you Summary
Snapshot
- This is a 2-bed/2.0-bath manufactured listed at $136k.
Deal economics
- At list price, monthly cash flow is $271 ($3k/yr) — positive.
- The deal already cash-flows at list — no discount required.
- Meets the 1% rule at list price ($1k rent vs $136k).
- Recommended offer: $134k (1.5% below list) — sets the bar for market timing.
- Cap rate 8.7% vs local median 4.2% in Fortuna Foothills — top-decile yield for the area; either an underpriced asset or a hidden risk that comps aren't pricing in. Stress-test before assuming the spread holds.
Location & tenants
- Location reads 60/100 on livability (#174 in AZ) — a middle-class / working-renter tenant base. Strengths: cost of living A+, housing A+; Watch: employment C-, schools F, crime F.
- Yuma Union High School District (4507) (urban): math 14% / reading 16% proficiency, ranked #212 of 249 in AZ (top 85%) — low school quality limits family demand, transient renter base, plan for 1-2y turnover.
- Market conditions: Rents rising fast (+4.5%/yr); 413 active listings in the ZIP; 7 comparable units currently listed for rent nearby; rentals leasing fast (median 13d on market — plan ~1-2 weeks tenant-placement turnaround); 1,399 units permitted in Yuma County in 2024 (180 in 5+ unit buildings).
Forward outlook
- Local home prices are declining (-3.0%/yr); year-one equity from $940 of loan paydown is wiped out by about $4k of value loss. Plan a longer hold.
- Yuma County population projected at +4% by 2050 — modest demand growth; plan on rents tracking national, not racing it.
- At projected returns (-3.0% appreciation + 4.5% rent growth), your $38k cash investment doubles in ~10 years — after that, you're playing with house money.
Negotiation context
- It's been on market 18 days — a 2% lower offer ($134k) is reasonable based on typical stale-listing flexibility.
Risks & watch-outs
- Climate carrying-cost: extreme-heat days projected 5→14/yr by 2055 (HVAC capex compounding) — expect insurance premiums to compound above CPI over the hold.
Questions for the listing agent
- Is there a deadline driving the sale (1031 exchange, divorce, estate, relocation)? That informs how much negotiation room exists.
- Schools are F-rated, which usually means shorter tenancies and higher turnover. Who's the typical renter profile here, and what's been the actual vacancy rate?
- Crime grade is F in this area — have there been break-ins, vandalism, or insurance claims at this property in the last 3 years? What carrier currently insures it and at what premium?
- What's the average days-on-market for RENTAL listings here right now (not sales)? A rising rental-DOM trend means longer vacancies and softer asking-rent achievability than the comps imply.
- What's the recent tenant-quality profile in this submarket — average credit score on applications, eviction rate, late-payment / NSF rate, and stable-employment percentage? A property-management company in the area should have these aggregated.
- How much new for-sale + rental construction is in the pipeline within 1–3 miles? Heavy new supply typically softens prices + rents 12–24 months out; constrained supply supports both.
Investment metrics
- 1% rule
- 1.01% ✓
- Cap rate
- 8.68%
- Cash-on-cash
- 8.53%
- DSCR
- 1.38
- GRM
- 8.3
CMA / ARV
- ARV (on-the-fly)
- $194,622
- Comps found
- 12
Show comp detail 12 sales within ~0.75 mi
| Address | Dist | Beds/Ba | Sqft | Sold | Price | $/sf | Match |
|---|---|---|---|---|---|---|---|
| 13345 E 46 Dr | 0.18mi | 2/1.0 | 955 (-2%) | 3mo | $165,000 | $173 | 82 |
| 13239 E 48 Dr | 0.21mi | 2/2.0 | 1,056 (+8%) | 0mo | $219,000 | $207 | 76 |
| 12599 S El Camino Del Diablo | 0.46mi | 2/2.0 | 960 (-2%) | 3mo | $165,000 | $172 | 73 |
| 12754 S Joleane Ave | 0.25mi | 2/2.0 | 1,056 (+8%) | 3mo | $185,000 | $175 | 73 |
| 13138 E 49 Dr | 0.29mi | 2/2.0 | 879 (-10%) | 2mo | $166,000 | $189 | 68 |
| 13555 E 47 Dr | 0.43mi | 2/3.0 | 938 (-4%) | 2mo | $215,000 | $229 | 68 |
| 13208 E 48 St | 0.12mi | 2/1.0 | 848 (-13%) | 1mo | $168,800 | $199 | 67 |
| 13309 E 52 Dr | 0.72mi | 2/2.0 | 968 (-1%) | 2mo | $175,000 | $181 | 64 |
| 12576 E 44 Dr | 0.64mi | 2/2.0 | 1,077 (+10%) | 3mo | $245,000 | $227 | 51 |
| 13714 E 47 Ln | 0.64mi | 3/2.0 (+1) | 1,056 (+8%) | 1mo | $220,000 | $208 | 51 |
| 13209 E 42 Dr | 0.55mi | 2/2.0 | 839 (-14%) | 3mo | $167,000 | $199 | 48 |
| 12478 S Ironwood Dr | 0.65mi | 3/2.0 (+1) | 1,064 (+9%) | 3mo | $210,000 | $197 | 47 |
Match score weights: distance 35% · size 25% · config 20% · recency 20%. Top-matched comps best support the ARV.
Projected returns pro-forma
-3.0% appreciation · 4.46% rent growth · sell at horizon
- IRR
- -1.9%
- Equity multiple
- 0.93×
- Total profit
- $-2,810
- Equity at exit
- $20,278
- IRR
- 9.1%
- Equity multiple
- 1.74×
- Total profit
- $28,174
- Equity at exit
- $11,759
Cash invested: $38,080 (down + closing). Projections, not guarantees.
Landlord ↔ Tenant lean methodology
- Overall (STATE)
- 87 Strongly Landlord-Friendly
- State Arizona
- 87 Strongly Landlord-Friendly · R+3
- County
- — inherits STATE
- City
- — inherits STATE
ZIP-level market 85367
- Home prices YoY
- -26.2%
- Rents YoY
- 4.5%
- Active inventory
- 413
- Price-to-rent
- 8.3×
Monthly cashflow live
- Estimated rent
- $1,373 high interval (Pro) →
- Mortgage (P&I)
- −$713
- Tax from tax record
- −$45 /mo · $534/yr
- Insurance
- −$57
- HOA
- −$0
- Vacancy / Maint / Mgmt
- −$288
- Net cashflow
- $271
Break-even live
UW: 25.0% down · 7.5% · 30yr · 1.5% tax · 5.0% vac · 8.0% maint · 8.0% mgmt
Financing live
Cash to close
- Down payment
- $34,000
- Closing costs
- $4,080
- Reserves months
- —
- Total cash needed
- —
Loan-product check · same deal, 3 products live
Conventional
25% down · 7.5% · 30yr
- Down + closing
- —
- Monthly P&I
- —
- Monthly cashflow
- —
- DSCR
- —
- Eligible?
- —
Personal DTI + credit; lowest rate.
DSCR
20% down · 8.5% · 30yr
- Down + closing
- —
- Monthly P&I
- —
- Monthly cashflow
- —
- DSCR
- —
- Eligible?
- —
No personal income docs; deal must DSCR.
Hard money
10% down · 12.0% · 12mo
- Down + closing
- —
- Monthly P&I
- —
- Monthly cashflow
- —
- DSCR
- —
- Eligible?
- —
Short-term bridge; refi at stabilization.
Rent comps 7 comps
| Address | Beds | Baths | Sqft | Rent | $/sqft | DOM | Units | Dist |
|---|---|---|---|---|---|---|---|---|
| 13595 E 51st St Yuma, AZ | 1.0 | 1.0 | 900 | $900 | $1.00 | 13d | 1 | 0.66mi |
| 13244 E 41st Ln Yuma, AZ | 2.0 | 1.0 | 948 | $1,200 | $1.27 | 13d | 1 | 0.71mi |
| 13117 E 41st St Yuma, AZ | 2.0 | 2.0 | 1091 | $1,400 | $1.28 | 13d | 1 | 0.78mi |
| 13388 E 41st Dr Yuma, AZ | 2.0 | 1.0 | 832 | $1,200 | $1.44 | 13d | 1 | 0.79mi |
| 13292 E 41st St Yuma, AZ | 1.0 | 1.0 | 700 | $1,195 | $1.71 | 13d | 1 | 0.80mi |
| 13818 E 52nd Dr Yuma, AZ | 2.0 | 1.0 | 864 | $1,300 | $1.50 | 13d | 1 | 0.98mi |
| 13289 S Onammi Ave Yuma, AZ | 2.0 | 2.0 | 950 | $1,600 | $1.68 | 13d | 1 | 1.27mi |
Listing history 14 events
-
2026-06-19days on market $136,000 Active 18 DOM
-
2026-06-18days on market $136,000 Active 17 DOM
-
2026-06-17days on market $136,000 Active 16 DOM
-
2026-06-16days on market $136,000 Active 15 DOM
-
2026-06-15days on market $136,000 Active 14 DOM
-
2026-06-14days on market $136,000 Active 12 DOM
-
2026-06-13days on market $136,000 Active 11 DOM
-
2026-06-10days on market $136,000 Active 9 DOM
-
2026-06-09days on market $136,000 Active 8 DOM
-
2026-06-08days on market $136,000 Active 7 DOM
-
2026-06-07days on market $136,000 Active 6 DOM
-
2026-06-05days on market $136,000 Active 3 DOM
-
2026-06-02remarks 699-char remark
-
2026-06-02$136,000 Active 1 DOM
ⓘ Source: listings_history table (triggers on properties + properties_extension) + one-shot
backfill from property_details.listing_events for pre-trigger history.
Tax reassessment forecast AZ · Resets to sale price
- Current annual tax
- $534 · $45/mo
- Projected year-2 tax
- $898 · $75/mo
- Expected delta
- +$363/yr (+$30/mo · 68.0%)
ⓘ Screening estimate from a state-policy table — verify with the county assessor before closing.
Climate risk First Street
- Flood 1/10 Low FEMA zone X (shaded) · 0% chance over 30 yrs
- Wildfire 4/10 Moderate
- Heat 9/10 Extreme 5 d/yr ≥113°F today · 14 d/yr by 30 yrs out
- Wind 1/10 Low
- Air quality 2/10 Low 1 unhealthy d/yr today · 2 by 30 yrs out
Nearby sold comps map
Loading sold comps map…
Walkable amenities ~0.75 mi
Loading nearby amenities…
Taxation est. · year 1
- Rental income
- $16,482
- − Mortgage interest
- −$7,618
- − Property taxes
- −$534
- − Insurance
- −$680
- − Repairs & maintenance
- −$1,319
- − Management
- −$1,319
- − Depreciation
- −$3,956
- Taxable income
- $1,056
- Est. tax owed @ 24.0%
- −$253
- After-tax cash flow
- $2,994/yr
For passive investors: Depreciation is non-cash, so a rental often shows a tax loss while cash-flowing — sheltering income. Rental losses are passive: they offset passive income freely, and up to $25,000/yr can offset ordinary (W-2) income if you actively participate and your MAGI is under $100k (phasing out to $0 by $150k); unused losses carry forward. On sale, claimed depreciation is recaptured at up to 25%, and gains may owe capital-gains tax (a 1031 exchange can defer both). Figures are a year-1 estimate at your 24.0% rate — not tax advice; consult a CPA.
Schools (NCES district)
- District
- Yuma Union High School District (4507)
- NCES district ID
- 0409630
- Math proficiency
- 14% ▼ -12.00%
- Reading proficiency
- 16% ▼ -10.00%
- Median HH income
- $40,512
- Composite
- 12.86/100
- National rank
- #9592
- State rank
- #212 of 249 in AZ
Livability — Fortuna Foothills
- Score
- 60/100
- State rank
- #174
- US rank
- #18663
Category grades
Schools grade is shown separately in the Schools card above.
Census & demographics
- Census place
- Fortuna Foothills, AZ
- County
- Yuma County · 149,809 people
- City population
- 21,356
- Metro
- Yuma, AZ
- Population (ZIP)
- 22,074
- Household income
- $58,469
- Rent vs Own
- Severe rent burden
- 408.0
Population outlook (Yuma County) Hauer SSP2
- Today (2025)
- 211,633 people
- By 2030
- 214,114 · +1.2%
- By 2040
- 217,856 · +2.9%
- By 2050
- 220,276 · +4.1%
- By 2075
- 222,359 · +5.1%
- By 2100
- 198,880 · -6.0%
Race, ethnicity, and origin ACS 2023
- Neighborhood character
- Predominantly White (71%)
- Race & ethnicity
- White 71% Hispanic / Latino 22% Two or more races 11% Black 3%
- Hispanic origin (detail)
- Mexican 20%
- Common ancestry
- Portuguese 4% Lithuanian 2% Italian 2%
- Foreign-born
- 10% · Canada
- Languages at home
- 81% English-only · Spanish 16% French/Haitian/Cajun 1% German/W. Germanic 1%
Political lean MEDSL · Yuma
- 2024 margin
- Strong R (+20.4) · D 39.3% · R 59.8%
- 2008→2024 swing
- -6.6pp toward R · 2008: -13.8pp · 2024: -20.4pp
- All cycles
- 2024: R+20.4 2020: R+6.2 2016: R+5.5 2012: R+16.1 2008: R+13.8
Not yet ingested
- Civics
- —
Market trends
- HPI YoY
- ▼ -80.81%
- Current HPI
- 227.2692
- Rent YoY
- ▲ 4.46%
- Metro
- Yuma, AZ
- State GDP YoY
- ▲ 4.54%
- F500 in state
- 20
Industry mix (Fortune 500 HQ in AZ)
| Industry | F500 HQs | Revenue |
|---|---|---|
| Technology | 2 | $13B |
|
||
| Mining / Metals | 1 | $23B |
|
||
| Environmental Services | 1 | $16B |
|
||
| Metals / Steel | 1 | $14B |
|
||
| Technology Distribution | 1 | $9B |
|
||
| Homebuilding | 1 | $8B |
|
||
Price history
+597.4% since first listed4 events — show timeline
- 2026-06-01 Listed $136,000 YAR
- 2023-04-21 Sold (Public Records) $165,000 Public Records
- 2018-01-05 Sold (Public Records) $59,000 Public Records
- 1994-04-01 Sold (Public Records) $19,500 Public Records
Property tax history
-3.7%/yrLatest (2025): $534 · +3.2% YoY. Source: county tax records.
Cash-flow waterfall
monthlySold comps — $/sqft
last 12 mo · ≤1 miLoading sold comps…