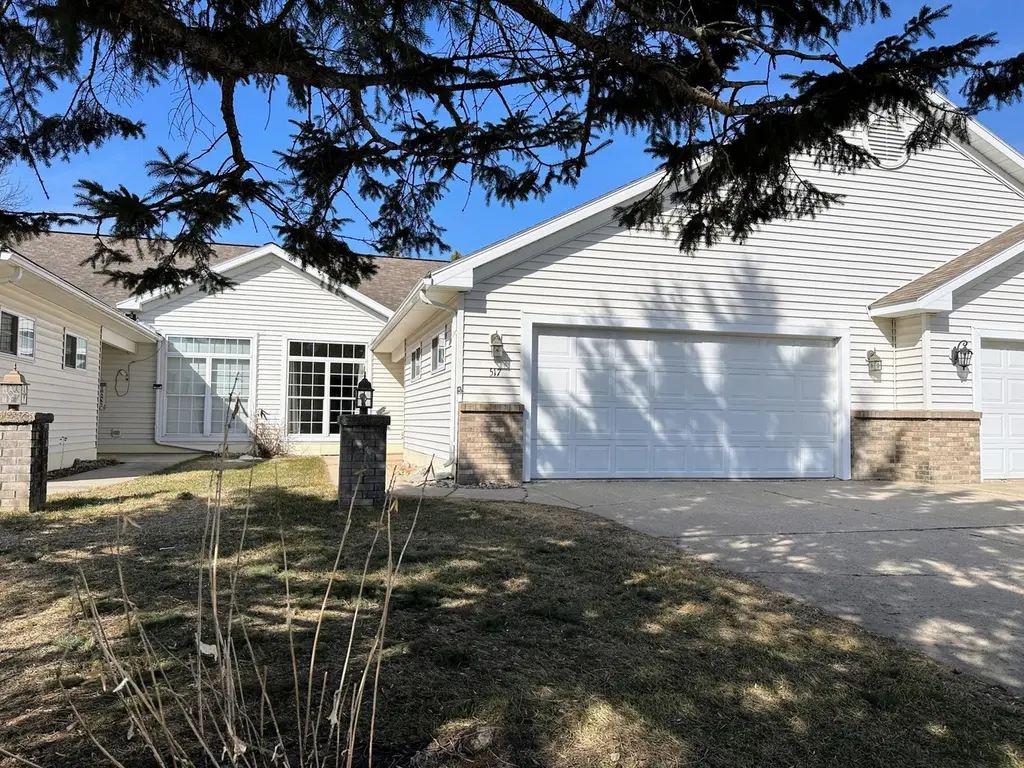
517 Pine Cone Dr · Perham, MN
Flood risk 1/10 · Minimal
- FEMA flood zone
- —
- Chance of flooding over 30 yrs
- 0.0%
- Est. flood insurance / yr
- —
Fire risk 3/10 · Minor
- Est. fire insurance / yr
- $888 – $1,650
Heat risk 1/10 · Minimal
- Hot days now (above 97°F)
- 7 days/yr
- Hot days in 30 yrs
- 12 days/yr
Wind risk 2/10 · Minimal
- Chance of severe wind over 30 yrs
- —
Air-quality risk 3/10 · Minor
- Unhealthy air days now
- 2 days/yr
- Unhealthy air days in 30 yrs
- 3 days/yr
Risk factors via First Street. Map © Google.
Why this score? — see what drove the D grade
The composite is a weighted blend of 9 inputs, each scored 0–100. Each bar is that input's sub-score; the figure is the points it added to the 100-point composite (weight × sub-score).
- Cash flow +13.2/30.0
- ARV discount +7.5/15.0
- 1% rule +4.6/10.0
- Schools +4.4/10.0
- DSCR +4.0/10.0
- Livability +3.5/5.0
- Rent growth +2.5/5.0
- Condition / age +2.5/5.0
- Appreciation +0.0/10.0
$239,000
🖨 Deal sheet 📄 Offer letter ✓ Due diligence
Listing remarks MLS
''FOR COMPS ONLY''Perham City 3 bedroom 2 bathroom condo offers private living with hassle free lawn care, snow removal, and exterior maintenance. Featuring an open floor plan, master suite, sun room with access to your own private patio. Cozy gas fireplace. Main floor laundry room and plenty of storage with spacious double garage.
Key facts
- Turn-key living
- Vaulted ceiling
- Sunroom
Tags
Neighborhood map
What this means for you Summary
Snapshot
- This is a 3-bed/2.0-bath single-family listed at $239k.
Deal economics
- At list price, monthly cash flow is $-3 ($-35/yr) — negative.
- To cash-flow at today's rent, offer at most $238k (0.2% below list).
- To meet the 1% rule (rent ≥ 1% of price), the offer needs to be $230k (3.8% below list).
- Recommended offer: $230k (3.8% below list) — sets the bar for 1% rule.
Location & tenants
- Location reads 70/100 on livability (#328 in MN) — a middle-class / working-renter tenant base. Strengths: crime A+, cost of living A+, health & safety A+; Watch: amenities F, commute F, employment F.
- Perham-Dent Public School District (town): math 45% / reading 57% proficiency, ranked #110 of 301 in MN (top 36%) — acceptable for families but not a draw, mixed tenant base, ~2y average lease.
- Market conditions: 92 active listings in the ZIP; 140 units permitted in Otter Tail County in 2024 (48 in 5+ unit buildings).
Forward outlook
- Local home prices are declining (-3.0%/yr); year-one equity from $2k of loan paydown is wiped out by about $7k of value loss. Plan a longer hold.
Negotiation context
- It's been on market 15 days — a 2% lower offer ($235k) is reasonable based on typical stale-listing flexibility.
- 2 sale attempts since 10y ago with the ask held roughly flat each time — persistent listings suggest the price (not the market) is what's stuck; bring a comps-based counter.
- Current owner paid $135k; list at $239k implies a 77% gain — meaningful room to come down on a strong offer.
Questions for the listing agent
- What do current leases actually rent for vs. the listed asking? Can we see a recent rent roll and the last 12 months of T-12 income?
- What does the HOA fee cover, when was the last increase, and are there any pending special assessments or reserve-fund shortfalls?
- Is there a deadline driving the sale (1031 exchange, divorce, estate, relocation)? That informs how much negotiation room exists.
- Schools are B-rated — typically a magnet for longer-tenancy family renters. What's the average tenant stay here, and is there a school-zone premium baked into asking?
- The area grade is low — what's the realistic commute time and amenity access for the typical tenant pool here? Any planned neighborhood developments (good or bad) we should know about?
- What's the average days-on-market for RENTAL listings here right now (not sales)? A rising rental-DOM trend means longer vacancies and softer asking-rent achievability than the comps imply.
- What's the recent tenant-quality profile in this submarket — average credit score on applications, eviction rate, late-payment / NSF rate, and stable-employment percentage? A property-management company in the area should have these aggregated.
- How much new for-sale + rental construction is in the pipeline within 1–3 miles? Heavy new supply typically softens prices + rents 12–24 months out; constrained supply supports both.
Investment metrics
- 1% rule
- 0.96% ✗
- Cap rate
- 6.28%
- Cash-on-cash
- -0.05%
- DSCR
- 1.00
- GRM
- 8.7
CMA / ARV
No comps found within radius.
Projected returns pro-forma
-3.0% appreciation · 3.0% rent growth · sell at horizon
- IRR
- -16.3%
- Equity multiple
- 0.42×
- Total profit
- $-38,778
- Equity at exit
- $35,636
- IRR
- -7.9%
- Equity multiple
- 0.50×
- Total profit
- $-33,447
- Equity at exit
- $20,664
Cash invested: $66,920 (down + closing). Projections, not guarantees.
Landlord ↔ Tenant lean methodology
- Overall (STATE)
- 46 Balanced
- State Minnesota
- 46 Balanced · D+2
- County
- — inherits STATE
- City
- — inherits STATE
ZIP-level market 56573
- Home prices YoY
- -15.8%
- Active inventory
- 92
- Price-to-rent
- 8.7×
Monthly cashflow live
- Estimated rent
- $2,300 medium interval (Pro) →
- Mortgage (P&I)
- −$1,253
- Tax from tax record
- −$167 /mo · $2,002/yr
- Insurance
- −$100
- HOA
- −$300
- Vacancy / Maint / Mgmt
- −$483
- Net cashflow
- $-3
Break-even live
UW: 25.0% down · 7.5% · 30yr · 1.5% tax · 5.0% vac · 8.0% maint · 8.0% mgmt
Financing live
Cash to close
- Down payment
- $59,750
- Closing costs
- $7,170
- Reserves months
- —
- Total cash needed
- —
Loan-product check · same deal, 3 products live
Conventional
25% down · 7.5% · 30yr
- Down + closing
- —
- Monthly P&I
- —
- Monthly cashflow
- —
- DSCR
- —
- Eligible?
- —
Personal DTI + credit; lowest rate.
DSCR
20% down · 8.5% · 30yr
- Down + closing
- —
- Monthly P&I
- —
- Monthly cashflow
- —
- DSCR
- —
- Eligible?
- —
No personal income docs; deal must DSCR.
Hard money
10% down · 12.0% · 12mo
- Down + closing
- —
- Monthly P&I
- —
- Monthly cashflow
- —
- DSCR
- —
- Eligible?
- —
Short-term bridge; refi at stabilization.
HOA detail
- Monthly dues
- $300 · $3,600/yr
- Likely covers
- gaslandscapingsnow removalexterior maint.
Listing history 8 events
-
2026-04-15status Pending
-
2026-04-13historical Contingent - Inspection
-
2026-03-31$239,000 Active
-
2016-11-15soldstatus $135,000 337-char remark
Show marketing remark (337 chars)
''FOR COMPS ONLY''Perham City 3 bedroom 2 bathroom condo offers private living with hassle free lawn care, snow removal, and exterior maintenance. Featuring an open floor plan, master suite, sun room with access to your own private patio. Cozy gas fireplace. Main floor laundry room and plenty of storage with spacious double garage.
-
2016-11-15$135,000 337-char remark
Show marketing remark (337 chars)
''FOR COMPS ONLY''Perham City 3 bedroom 2 bathroom condo offers private living with hassle free lawn care, snow removal, and exterior maintenance. Featuring an open floor plan, master suite, sun room with access to your own private patio. Cozy gas fireplace. Main floor laundry room and plenty of storage with spacious double garage.
-
2016-07-19soldstatus $135,000
-
2011-03-22soldstatus $128,600
-
1998-10-28soldstatus $87,974
ⓘ Source: listings_history table (triggers on properties + properties_extension) + one-shot
backfill from property_details.listing_events for pre-trigger history.
Tax reassessment forecast MN · Partial reset (capped growth)
- Current annual tax
- $2,002 · $167/mo
- Projected year-2 tax
- $2,339 · $195/mo
- Expected delta
- +$337/yr (+$28/mo · 16.9%)
ⓘ Screening estimate from a state-policy table — verify with the county assessor before closing.
Climate risk First Street
- Flood 1/10 Low 0% chance over 30 yrs
- Wildfire 3/10 Moderate
- Heat 1/10 Low 7 d/yr ≥97°F today · 12 d/yr by 30 yrs out
- Wind 2/10 Low
- Air quality 3/10 Moderate 2 unhealthy d/yr today · 3 by 30 yrs out
Nearby sold comps map
Loading sold comps map…
Walkable amenities ~0.75 mi
Loading nearby amenities…
Taxation est. · year 1
- Rental income
- $27,597
- − Mortgage interest
- −$13,388
- − Property taxes
- −$2,002
- − Insurance
- −$1,195
- − Repairs & maintenance
- −$2,208
- − Management
- −$2,208
- − HOA
- −$3,600
- − Depreciation
- −$6,953
- Taxable loss
- −$3,956
- Est. tax savings @ 24.0%
- +$949
- After-tax cash flow
- $914/yr
For passive investors: Depreciation is non-cash, so a rental often shows a tax loss while cash-flowing — sheltering income. Rental losses are passive: they offset passive income freely, and up to $25,000/yr can offset ordinary (W-2) income if you actively participate and your MAGI is under $100k (phasing out to $0 by $150k); unused losses carry forward. On sale, claimed depreciation is recaptured at up to 25%, and gains may owe capital-gains tax (a 1031 exchange can defer both). Figures are a year-1 estimate at your 24.0% rate — not tax advice; consult a CPA.
Schools (NCES district)
- District
- Perham-Dent Public School District
- NCES district ID
- 2728230
- Math proficiency
- 45% ▼ -14.00%
- Reading proficiency
- 57% ▼ -5.00%
- Median HH income
- $50,712
- Composite
- 43.64/100
- National rank
- #2966
- State rank
- #110 of 301 in MN
Livability — Perham
- Score
- 70/100
- State rank
- #328
- US rank
- #7425
Category grades
Schools grade is shown separately in the Schools card above.
Census & demographics
- Census place
- Perham, MN
- Population (ZIP)
- 6,868
Population outlook (Otter Tail County) Hauer SSP2
- Today (2025)
- 58,183 people
- By 2030
- 58,267 · +0.1%
- By 2040
- 57,999 · -0.3%
- By 2050
- 57,183 · -1.7%
- By 2075
- 57,638 · -0.9%
- By 2100
- 54,697 · -6.0%
Race, ethnicity, and origin ACS 2023
- Neighborhood character
- Predominantly White (86%)
- Race & ethnicity
- White 86% Hispanic / Latino 9% Two or more races 6% Black 1%
- Hispanic origin (detail)
- Mexican 2% Dominican 1%
- Common ancestry
- Portuguese 18% Romanian 6% Lithuanian 3%
- Foreign-born
- 5% · Canada
- Languages at home
- 92% English-only · Spanish 7%
Political lean MEDSL · Otter Tail
- 2024 margin
- Solid R (+34.2) · D 32.1% · R 66.3% · Other 1.6%
- 2008→2024 swing
- -21.3pp toward R · 2008: -12.9pp · 2024: -34.2pp
- All cycles
- 2024: R+34.2 2020: R+32.5 2016: R+35.9 2012: R+21.2 2008: R+12.9
Not yet ingested
- Civics
- —
Market trends
- HPI YoY
- ▼ -42.48%
- Current HPI
- 225.7071
- Rent YoY
- —
- Metro
- —
- State GDP YoY
- ▲ 2.41%
- F500 in state
- 34
Industry mix (Fortune 500 HQ in MN)
| Industry | F500 HQs | Revenue |
|---|---|---|
| Healthcare | 2 | $407B |
|
||
| Retail | 2 | $150B |
|
||
| Consumer Goods | 2 | $32B |
|
||
| Industrial Machinery | 2 | $6B |
|
||
| Agriculture | 1 | $40B |
|
||
| Healthcare / Medical Devices | 1 | $32B |
|
||
Price history
+171.7% since first listed8 events — show timeline
- 2026-04-15 Pending — NORTHSTARMLS as Distributed by MLS Grid
- 2026-04-13 Contingent — NORTHSTARMLS as Distributed by MLS Grid
- 2026-03-31 Listed $239,000 NORTHSTARMLS as Distributed by MLS Grid
- 2016-11-15 Listed $135,000 NORTHSTARMLS as Distributed by MLS Grid
- 2016-11-15 Sold (MLS) $135,000 NORTHSTARMLS as Distributed by MLS Grid
- 2016-07-19 Sold (Public Records) $135,000 Public Records
- 2011-03-22 Sold (Public Records) $128,600 Public Records
- 1998-10-28 Sold (Public Records) $87,974 Public Records
Property tax history
+6.2%/yrLatest (2025): $2,002 · -2.0% YoY. Source: county tax records.
Cash-flow waterfall
monthlySold comps — $/sqft
last 12 mo · ≤1 miLoading sold comps…