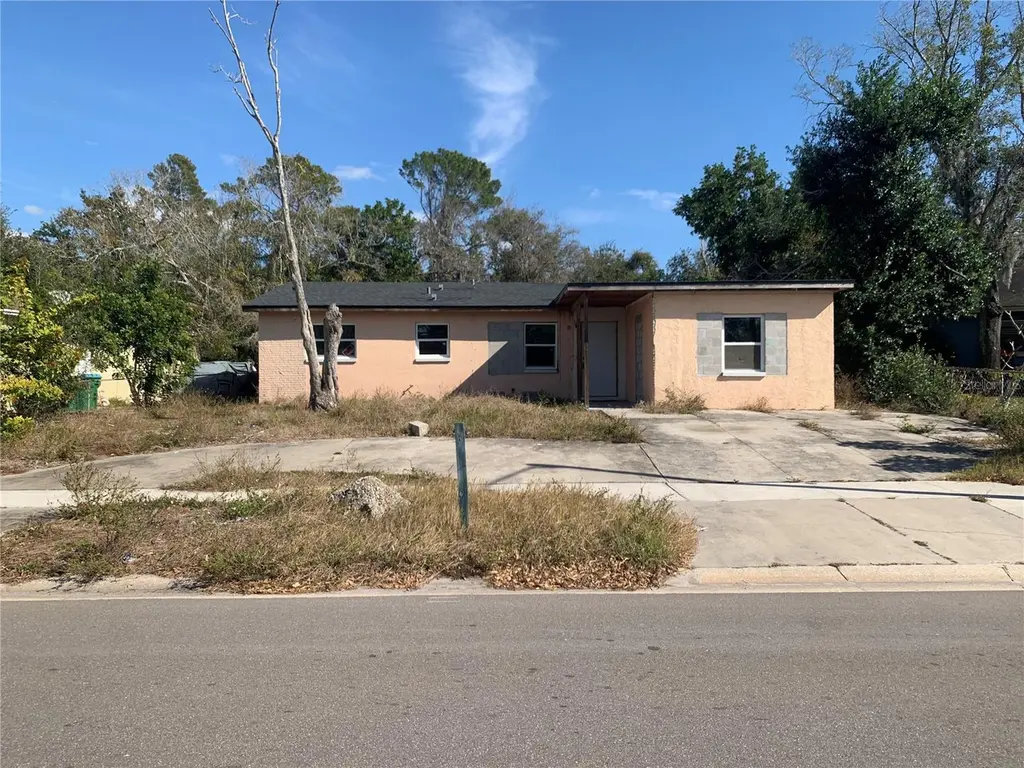
2181 22nd Way SW · Ridgecrest, FL
Flood risk 1/10 · Minimal
- FEMA flood zone
- X (unshaded)
- Chance of flooding over 30 yrs
- 0.0%
- Est. flood insurance / yr
- $507 – $1,088
Fire risk 1/10 · Minimal
- Est. fire insurance / yr
- $947 – $1,759
Heat risk 10/10 · Severe
- Hot days now (above 107°F)
- 7 days/yr
- Hot days in 30 yrs
- 23 days/yr
Wind risk 10/10 · Severe
- Chance of severe wind over 30 yrs
- 99.0%
Air-quality risk 3/10 · Minor
- Unhealthy air days now
- 2 days/yr
- Unhealthy air days in 30 yrs
- 3 days/yr
Risk factors via First Street. Map © Google.
Why this score? — see what drove the B grade
The composite is a weighted blend of 9 inputs, each scored 0–100. Each bar is that input's sub-score; the figure is the points it added to the 100-point composite (weight × sub-score).
- Cash flow +30.0/30.0
- 1% rule +10.0/10.0
- DSCR +10.0/10.0
- ARV discount +7.5/15.0
- Schools +4.3/10.0
- Livability +3.6/5.0
- Rent growth +3.0/5.0
- Condition / age +2.5/5.0
- Appreciation +0.0/10.0
$129,900
🖨 Deal sheet (PDF) 📄 Offer letter ✓ Due diligence
Listing remarks
Short Sale. Property had storm damage. Remediated. Incomplete rehab. Will need to be completed, etc.
Key facts
- 6,922 sq ft lot
- Built 1972
Neighborhood map
What this means for you Summary
Snapshot
- This is a 3-bed/2.0-bath single-family listed at $130k.
Deal economics
- At list price, monthly cash flow is $915 ($11k/yr) — positive.
- The deal already cash-flows at list — no discount required.
- Meets the 1% rule at list price ($2k rent vs $130k).
Location & tenants
- Location reads 72/100 on livability (#323 in FL) — a middle-class / working-renter tenant base. Strengths: crime A+, health & safety A+, commute A-; Watch: schools D-, amenities F, employment F.
- Pinellas (suburban): math 51% / reading 51% proficiency, ranked #31 of 73 in FL (top 42%) — acceptable for families but not a draw, mixed tenant base, ~2y average lease.
- Market conditions: Rents rising (+2.0%/yr); 209 active listings in the ZIP; 40 comparable units currently listed for rent nearby; rentals at typical pace (median 18d on market — plan ~3-4 weeks tenant-placement turnaround); solid renter incomes; 2,676 units permitted in Pinellas County in 2024 (1,422 in 5+ unit buildings).
- This rent runs 36% of the median local income ($79k/yr) — at the standard rent-burdened threshold; future hikes will face affordability resistance.
Forward outlook
- Local home prices are declining (-3.0%/yr); year-one equity from $898 of loan paydown is wiped out by about $4k of value loss. Plan a longer hold.
- Pinellas County population projected at +14% by 2050 — modest demand growth; plan on rents tracking national, not racing it.
- At projected returns (-3.0% appreciation + 2.0% rent growth), your $36k cash investment doubles in ~5 years — after that, you're playing with house money.
Negotiation context
- Only 1 days on market — expect competitive offers; lowballing is unlikely to land.
- 3 sale attempts with the ask held roughly flat each time — persistent listings suggest the price (not the market) is what's stuck; bring a comps-based counter.
Risks & watch-outs
- Climate carrying-cost: severe wind risk, 99% chance of damaging wind over 30y; extreme-heat days projected 7→23/yr by 2055 (HVAC capex compounding) — expect insurance premiums to compound above CPI over the hold.
Questions for the listing agent
- Built in 1972 — when were the roof, HVAC, electrical panel, plumbing, and water heater last replaced?
- Is there a deadline driving the sale (1031 exchange, divorce, estate, relocation)? That informs how much negotiation room exists.
- Schools are D-rated, which usually means shorter tenancies and higher turnover. Who's the typical renter profile here, and what's been the actual vacancy rate?
- What's the average days-on-market for RENTAL listings here right now (not sales)? A rising rental-DOM trend means longer vacancies and softer asking-rent achievability than the comps imply.
- What's the recent tenant-quality profile in this submarket — average credit score on applications, eviction rate, late-payment / NSF rate, and stable-employment percentage? A property-management company in the area should have these aggregated.
- How much new for-sale + rental construction is in the pipeline within 1–3 miles? Heavy new supply typically softens prices + rents 12–24 months out; constrained supply supports both.
Investment metrics
- 1% rule
- 1.85% ✓
- Cap rate
- 14.75%
- Cash-on-cash
- 30.20%
- DSCR
- 2.34
- GRM
- 4.5
CMA / ARV
- ARV (on-the-fly)
- $393,653
- Comps found
- 12
Show comp detail 12 sales within ~0.75 mi
| Address | Dist | Beds/Ba | Sqft | Sold | Price | $/sf | Match |
|---|---|---|---|---|---|---|---|
| 2225 Nellie St | 0.50mi | 3/2.0 | 1,353 (-3%) | 1mo | $400,000 | $296 | 71 |
| 2542 Wilson Ave | 0.49mi | 3/1.5 | 1,410 (+1%) | 5mo | $225,100 | $160 | 69 |
| 2213 Gladys St | 0.61mi | 3/2.0 | 1,402 (+1%) | 2mo | $370,000 | $264 | 69 |
| 2809 Fulton St SW | 0.56mi | 3/2.0 | 1,401 (+1%) | 6mo | $475,000 | $339 | 68 |
| 12832 Campbell Ln | 0.57mi | 4/2.0 (+1) | 1,424 (+2%) | 1mo | $322,000 | $226 | 63 |
| 1630 Trotter Rd | 0.31mi | 2/1.0 (-1) | 1,298 (-7%) | 3mo | $315,000 | $243 | 63 |
| 2592 14th Ave SW | 0.53mi | 3/2.0 | 1,450 (+4%) | 6mo | $470,000 | $324 | 63 |
| 1361 Oakbrook Dr | 0.61mi | 2/2.0 (-1) | 1,363 (-2%) | 3mo | $402,500 | $295 | 61 |
| 13097 120th St | 0.51mi | 3/2.0 | 1,296 (-7%) | 5mo | $345,000 | $266 | 61 |
| 12041 134th Pl | 0.32mi | 3/2.0 | 1,587 (+14%) | 6mo | $238,229 | $150 | 56 |
| 12815 129th Ter | 0.68mi | 3/2.0 | 1,235 (-11%) | 3mo | $350,000 | $283 | 47 |
| 11780 129th Ter | 0.69mi | 3/2.0 | 1,224 (-12%) | 3mo | $375,000 | $306 | 45 |
Match score weights: distance 35% · size 25% · config 20% · recency 20%. Top-matched comps best support the ARV.
Projected returns pro-forma
-3.0% appreciation · 2.01% rent growth · sell at horizon
- IRR
- 23.7%
- Equity multiple
- 1.96×
- Total profit
- $34,974
- Equity at exit
- $19,369
- IRR
- 30.9%
- Equity multiple
- 3.65×
- Total profit
- $96,351
- Equity at exit
- $11,231
Cash invested: $36,372 (down + closing). Projections, not guarantees.
Landlord ↔ Tenant lean methodology
- Overall (STATE)
- 87 Strongly Landlord-Friendly
- State Florida
- 87 Strongly Landlord-Friendly · R+3
- County
- — inherits STATE
- City
- — inherits STATE
ZIP-level market 33774
- Rents YoY
- 2.0%
- Active inventory
- 209
- Price-to-rent
- 4.5×
Monthly cashflow live
- Estimated rent
- $2,407 high interval (Pro) →
- Mortgage (P&I)
- −$681
- Tax from tax record
- −$251 /mo · $3,009/yr
- Insurance
- −$54
- HOA
- −$0
- Vacancy / Maint / Mgmt
- −$505
- Net cashflow
- $915
Break-even live
Sensitivity live
| Price | -10% $989 | -5% $952 | +0% $915 | +5% $879 | +10% $842 |
|---|---|---|---|---|---|
| Rent | -10% $725 | -5% $820 | +0% $915 | +5% $1,011 | +10% $1,106 |
| Rate | -1.0pp $981 | -0.5pp $949 | base $915 | +0.5pp $882 | +1.0pp $848 |
UW: 25.0% down · 7.5% · 30yr · 1.5% tax · 5.0% vac · 8.0% maint · 8.0% mgmt
Financing live
Cash to close
- Down payment
- $32,475
- Closing costs
- $3,897
- Reserves months
- —
- Total cash needed
- —
Loan-product check · same deal, 3 products live
Conventional
25% down · 7.5% · 30yr
- Down + closing
- —
- Monthly P&I
- —
- Monthly cashflow
- —
- DSCR
- —
- Eligible?
- —
Personal DTI + credit; lowest rate.
DSCR
20% down · 8.5% · 30yr
- Down + closing
- —
- Monthly P&I
- —
- Monthly cashflow
- —
- DSCR
- —
- Eligible?
- —
No personal income docs; deal must DSCR.
Hard money
10% down · 12.0% · 12mo
- Down + closing
- —
- Monthly P&I
- —
- Monthly cashflow
- —
- DSCR
- —
- Eligible?
- —
Short-term bridge; refi at stabilization.
Rent comps 40 comps
| Address | Beds | Baths | Sqft | Rent | $/sqft | DOM | Units | Dist |
|---|---|---|---|---|---|---|---|---|
| 1825 134th Ave Largo, FL | 3.0 | 2.0 | 1005 | $2,200 | $2.19 | 25d | 1 | 0.29mi |
| 2272 16th Ave SW Unit C Largo, FL | 2.0 | 1.0 | 1031 | $2,600 | $2.52 | 25d | 1 | 0.34mi |
| 13264 120th Ln Largo, FL | 4.0 | 1.0 | 1050 | $2,700 | $2.57 | 25d | 1 | 0.35mi |
| 13264 120th Ln Largo, FL | 4.0 | 1.0 | 1050 | $2,300 | $2.19 | 8d | 1 | 0.35mi |
| 2402 Dryer Ave Largo, FL | 3.0 | 2.0 | 1872 | $3,000 | $1.60 | 25d | 1 | 0.37mi |
| 11980 133rd Ave Apt 4 Largo, FL | 3.0 | 1.0 | 1200 | $2,150 | $1.79 | 25d | 1 | 0.37mi |
| 11980 133rd Ave Largo, FL | 3.0 | 1.0 | 1200 | $2,150 | $1.79 | 17d | 3 | 0.37mi |
| 11960 133rd Ave Unit 4 Largo, FL | 3.0 | 1.0 | 1200 | $2,150 | $1.79 | 25d | 1 | 0.39mi |
| 11960 133rd Ave Largo, FL | 3.0 | 1.0 | 936 | $2,150 | $2.30 | 8d | 1 | 0.39mi |
| 11938 133rd Ave Largo, FL | 3.0 | 1.0 | 1200 | $2,150 | $1.79 | 17d | 1 | 0.40mi |
| 11938 133rd Ave Apt 4 Largo, FL | 3.0 | 1.0 | 1200 | $2,150 | $1.79 | 25d | 1 | 0.40mi |
| 1884 Pine St Largo, FL | 3.0 | 1.5 | 1012 | $2,499 | $2.47 | 22d | 1 | 0.43mi |
| 2316 Fulton Way Largo, FL | 3.0 | 2.0 | 1209 | $2,699 | $2.23 | 4d | 1 | 0.44mi |
| 1448 Oak St Largo, FL | 2.0 | 2.0 | 1070 | $2,300 | $2.15 | 4d | 1 | 0.48mi |
| 2503 Mary Sue St SW Largo, FL | 3.0 | 2.0 | 1260 | $2,211 | $1.75 | 14d | 1 | 0.48mi |
| 3000 Karen Ave Largo, FL | 2.0 | 1.0 | 888 | $2,450 | $2.76 | 22d | 1 | 0.48mi |
| 3000 Karen Ave Largo, FL | 2.0 | 1.0 | 888 | $2,800 | $3.15 | 25d | 1 | 0.48mi |
| 13001 120th St Largo, FL | 3.0 | 1.0 | 1044 | $1,950 | $1.87 | 8d | 1 | 0.53mi |
| 3054 Adrian Ave Largo, FL | 2.0 | 1.0 | 1059 | $3,500 | $3.31 | 4d | 1 | 0.58mi |
| 1830 30th Ln SW Largo, FL | 3.0 | 2.0 | 1400 | $2,725 | $1.95 | 14d | 1 | 0.58mi |
| 2317 13th Ave SW Largo, FL | 3.0 | 1.0 | 1189 | $2,309 | $1.94 | 17d | 1 | 0.60mi |
| 1635 Gladys St Unit 2 Largo, FL | 3.0 | 1.0 | 1200 | $2,000 | $1.67 | 17d | 1 | 0.68mi |
| 1635 Gladys St Unit 2 Largo, FL | 3.0 | 1.0 | 1194 | $1,900 | $1.59 | 8d | 1 | 0.68mi |
| 2200 Gladys St Largo, FL | 1.0–2.0 | 1.0–1.5 | 677 | $1,595 | $2.35 | 25d | 1 | 0.71mi |
| 3223 Dryer Ave Largo, FL | 2.0 | 1.0 | 1000 | $1,800 | $1.80 | 25d | 1 | 0.73mi |
| 1767 10th St SW Largo, FL | 4.0 | 2.0 | 1374 | $2,995 | $2.18 | 4d | 1 | 0.74mi |
| 3381 19th Pl SW Largo, FL | 3.0 | 2.0 | 1770 | $2,950 | $1.67 | 25d | 1 | 0.75mi |
| 13125 Wilcox Rd Largo, FL | 1.0–2.0 | 1.0–2.0 | 840 | $1,830 | $2.18 | 2d | 8 | 0.76mi |
| 13250 Ridge Rd Unit 3B1 Largo, FL | 3.0 | 2.0 | 1225 | $1,975 | $1.61 | 18d | 1 | 0.76mi |
| 11786 126th Ter Largo, FL | 4.0 | 2.0 | 1242 | $2,650 | $2.13 | 21d | 1 | 0.81mi |
| 11704 127th Ave Largo, FL | 3.0 | 2.0 | 1311 | $2,345 | $1.79 | 5d | 1 | 0.81mi |
| 13333 Ridge Rd Largo, FL | 1.0–2.0 | 1.0–1.5 | 860 | $1,765 | $2.05 | 8d | 1 | 0.86mi |
| 1031 Honeysuckle Rd Largo, FL | 3.0 | 2.0 | 1382 | $2,675 | $1.94 | 18d | 1 | 0.87mi |
| 11666 126th Ter Largo, FL | 3.0 | 1.0 | 1056 | $2,183 | $2.07 | 25d | 1 | 0.87mi |
| 13200 Wilcox Rd Largo, FL | 2.0 | 2.0 | 932 | $1,755 | $1.88 | 4d | 2 | 0.88mi |
| 740 16th Ave SW Largo, FL | 4.0 | 2.0 | 1346 | $2,695 | $2.00 | 17d | 1 | 0.91mi |
| 12800 Vonn Rd Largo, FL | 1.0–2.0 | 1.0 | 810 | $1,458 | $1.80 | 3d | 16 | 0.93mi |
| 11557 124th Ter Largo, FL | 3.0 | 2.0 | 1601 | $3,495 | $2.18 | 18d | 1 | 1.02mi |
| 910 9th Ave SW Largo, FL | 3.0 | 2.0 | 1120 | $2,100 | $1.88 | 4d | 1 | 1.07mi |
| 775 Royal Palm Cir Largo, FL | 2.0 | 2.0 | 1008 | $1,700 | $1.69 | 4d | 1 | 1.07mi |
Listing history 7 events
-
2026-03-31status Pending
-
2026-03-30$129,900 Active
-
2025-11-28historical
-
2025-10-27price $229,900
-
2025-08-15status Active
-
2025-08-14$249,900 Active
-
2025-08-14historical
ⓘ Source: listings_history table (triggers on properties + properties_extension) + one-shot
backfill from property_details.listing_events for pre-trigger history.
Tax reassessment forecast FL · Resets to sale price
- Current annual tax
- $3,009 · $251/mo
- Projected year-2 tax
- $3,009 · $251/mo
- Expected delta
- $0/yr ($0/mo · 0.0%)
ⓘ Screening estimate from a state-policy table — verify with the county assessor before closing.
Climate risk First Street
- Flood 1/10 Low FEMA zone X (unshaded) · 0% chance over 30 yrs
- Wildfire 1/10 Low
- Heat 10/10 Extreme 7 d/yr ≥107°F today · 23 d/yr by 30 yrs out
- Wind 10/10 Extreme 99% chance of damaging wind over 30 yrs
- Air quality 3/10 Moderate 2 unhealthy d/yr today · 3 by 30 yrs out
Nearby sold comps map
Loading sold comps map…
Walkable amenities ~0.75 mi
Loading nearby amenities…
Taxation est. · year 1
- Rental income
- $28,884
- − Mortgage interest
- −$7,276
- − Property taxes
- −$3,009
- − Insurance
- −$650
- − Repairs & maintenance
- −$2,311
- − Management
- −$2,311
- − Depreciation
- −$3,779
- Taxable income
- $9,549
- Est. tax owed @ 24.0%
- −$2,292
- After-tax cash flow
- $8,694/yr
For passive investors: Depreciation is non-cash, so a rental often shows a tax loss while cash-flowing — sheltering income. Rental losses are passive: they offset passive income freely, and up to $25,000/yr can offset ordinary (W-2) income if you actively participate and your MAGI is under $100k (phasing out to $0 by $150k); unused losses carry forward. On sale, claimed depreciation is recaptured at up to 25%, and gains may owe capital-gains tax (a 1031 exchange can defer both). Figures are a year-1 estimate at your 24.0% rate — not tax advice; consult a CPA.
Schools (NCES district)
- District
- Pinellas
- NCES district ID
- 1201560
- Math proficiency
- 51% ▼ -5.00%
- Reading proficiency
- 51% ▼ -3.00%
- Median HH income
- $46,270
- Composite
- 43.27/100
- National rank
- #3046
- State rank
- #31 of 73 in FL
Livability — Ridgecrest
- Score
- 72/100
- State rank
- #323
- US rank
- #5732
Category grades
Schools grade is shown separately in the Schools card above.
Census & demographics
- Census place
- Ridgecrest, FL
- County
- Pinellas County · 939,478 people
- Metro
- Tampa-St. Petersburg-Clearwater, FL
- Population (ZIP)
- 19,799
- Household income
- $79,139
- Rent vs Own
- Severe rent burden
- 546.0
Population outlook (Pinellas County) Hauer SSP2
- Today (2025)
- 1,027,532 people
- By 2030
- 1,063,586 · +3.5%
- By 2040
- 1,125,020 · +9.5%
- By 2050
- 1,168,637 · +13.7%
- By 2075
- 1,265,188 · +23.1%
- By 2100
- 1,260,357 · +22.7%
Race, ethnicity, and origin ACS 2023
- Neighborhood character
- Predominantly White (74%)
- Race & ethnicity
- White 74% Black 11% Hispanic / Latino 9% Two or more races 7%
- Hispanic origin (detail)
- Mexican 2% Puerto Rican 3% Cuban 2%
- Common ancestry
- Romanian 7% Lithuanian 4% Hispanic 2%
- Foreign-born
- 8% · Canada
- Languages at home
- 91% English-only · Spanish 4% French/Haitian/Cajun 2% Russian/Polish/Slavic 1%
Political lean MEDSL · Pinellas
- 2024 margin
- Lean R (+5.2) · D 46.9% · R 52.1%
- 2008→2024 swing
- -13.5pp toward R · 2008: 8.3pp · 2024: -5.2pp
- All cycles
- 2024: R+5.2 2020: D+0.2 2016: R+1.1 2012: D+5.6 2008: D+8.3
Not yet ingested
- Civics
- —
Market trends
- HPI YoY
- ▼ -383.61%
- Current HPI
- 336.629
- Rent YoY
- ▲ 2.01%
- Metro
- Tampa-St. Petersburg-Clearwater, FL
- State GDP YoY
- ▲ 3.28%
- F500 in state
- 36
Industry mix (Fortune 500 HQ in FL)
| Industry | F500 HQs | Revenue |
|---|---|---|
| Industrial Technology | 2 | $29B |
|
||
| Insurance | 2 | $17B |
|
||
| Retail | 1 | $60B |
|
||
| Technology Distribution | 1 | $58B |
|
||
| Homebuilding | 1 | $35B |
|
||
| Technology Manufacturing | 1 | $35B |
|
||
Price history
-48.0% since first listed7 events — show timeline
- 2026-03-31 Pending — Stellar MLS as Distributed by MLS Grid
- 2026-03-30 Listed $129,900 Stellar MLS as Distributed by MLS Grid
- 2025-11-28 Listing Removed — Stellar MLS as Distributed by MLS Grid
- 2025-10-27 Price Changed $229,900 Stellar MLS as Distributed by MLS Grid
- 2025-08-15 Relisted — Stellar MLS as Distributed by MLS Grid
- 2025-08-14 Listing Removed — Stellar MLS as Distributed by MLS Grid
- 2025-08-14 Listed $249,900 Stellar MLS as Distributed by MLS Grid
Property tax history
+4.8%/yrLatest (2025): $3,009 · -27.8% YoY. Source: county tax records.
Cash-flow waterfall
monthlySold comps — $/sqft
last 12 mo · ≤1 miLoading sold comps…