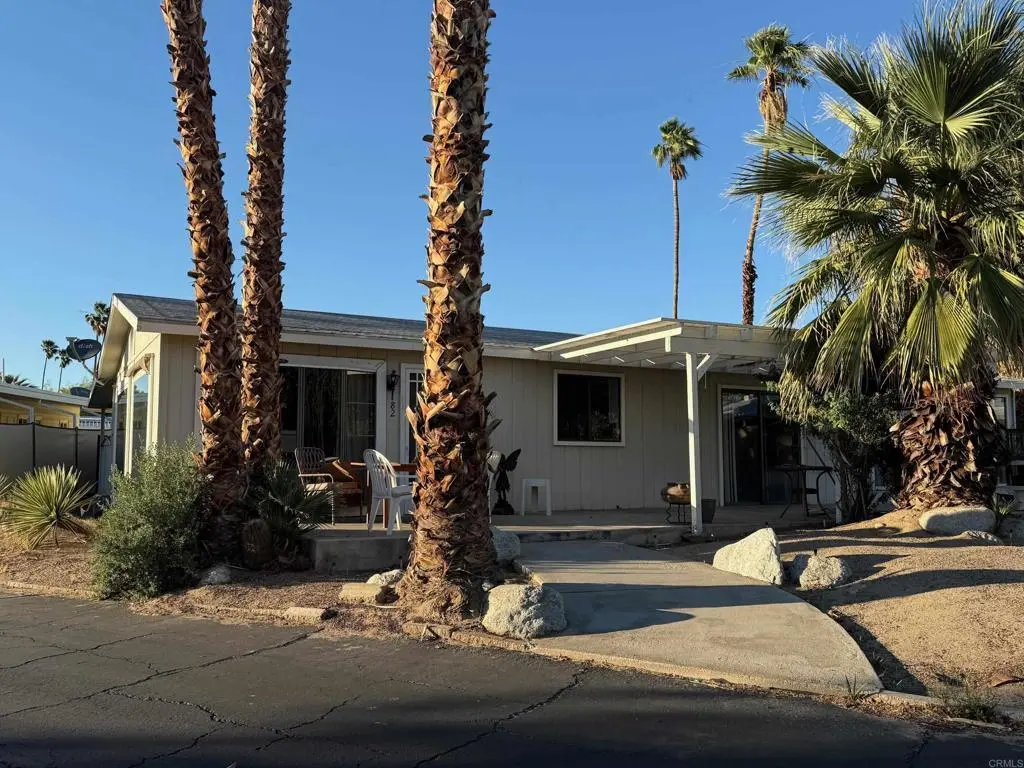
1010 Palm Canyon Dr #82 · Borrego Springs, CA
Flood risk No data
- FEMA flood zone
- —
- Chance of flooding over 30 yrs
- —
- Est. flood insurance / yr
- —
Fire risk No data
- Est. fire insurance / yr
- —
Heat risk No data
- Hot days now (above threshold)
- —
- Hot days in 30 yrs
- —
Wind risk No data
- Chance of severe wind over 30 yrs
- —
Air-quality risk No data
- Unhealthy air days now
- —
- Unhealthy air days in 30 yrs
- —
Risk factors via First Street. Map © Google.
Why this score? — see what drove the B- grade
The composite is a weighted blend of 9 inputs, each scored 0–100. Each bar is that input's sub-score; the figure is the points it added to the 100-point composite (weight × sub-score).
- Cash flow +30.0/30.0
- 1% rule +10.0/10.0
- DSCR +10.0/10.0
- ARV discount +7.5/15.0
- Livability +2.9/5.0
- Schools +2.6/10.0
- Rent growth +2.5/5.0
- Condition / age +2.5/5.0
- Appreciation +0.0/10.0
$137,000
🖨 Deal sheet 📄 Offer letter ✓ Due diligence
Listing remarks MLS
This spacious home has cathedral ceilings and is light & bright, with 2 newer, large, dual-pane windows that look out to the 1st fairway & green of the exclusive 55+ Roadrunner Golf & Country Club. Enjoy beautiful & lush views which include many palm trees, a pond & fountain on the fairway, and the iconic San Ysidro Mountains to the West. There is carpeting throughout and ceramic tile in the kitchen, both bathrooms & large laundry room. The main bath has a large oval tub and separate shower stall. This home has central forced heating and air conditioning along with a large fan in the living room. A nice sitting "wrap around" bar allows for entertaining and lots of counter space. You can enjoy the sunsets right from your living room or even better, on the front patio. This is on leased land with space rent. Don't miss this opportunity, call me today!
Key facts
- Lush views
- Front patio
- Dual-pane windows
Tags
Neighborhood map
What this means for you Summary
Snapshot
- This is a 3-bed/2.0-bath manufactured listed at $137k.
Deal economics
- At list price, monthly cash flow is $1k ($15k/yr) — positive.
- The deal already cash-flows at list — no discount required.
- Meets the 1% rule at list price ($3k rent vs $137k).
- Recommended offer: $129k (6.0% below list) — sets the bar for market timing.
- Cap rate 17.3% vs local median 6.0% in Borrego Springs — top-decile yield for the area; either an underpriced asset or a hidden risk that comps aren't pricing in. Stress-test before assuming the spread holds.
Location & tenants
- Location reads 58/100 on livability (#712 in CA) — a working-class tenant base; expect higher turnover. Strengths: crime A+, employment A+, housing A+; Watch: schools F, amenities F, commute F.
- Borrego Springs Unified (rural): math 20% / reading 35% proficiency, ranked #1,120 of 1,400 in CA (top 80%) — low school quality limits family demand, transient renter base, plan for 1-2y turnover; 72% free/reduced lunch — lower-income household profile, screen leases tightly.
- Market conditions: 174 active listings in the ZIP; 11,759 units permitted in San Diego County in 2024 (7,244 in 5+ unit buildings).
Forward outlook
- Local home prices are declining (-3.0%/yr); year-one equity from $947 of loan paydown is wiped out by about $4k of value loss. Plan a longer hold.
- San Diego County population projected at +20% by 2050 — long-run rental-demand tailwind backs the buy-and-hold thesis.
- At projected returns (-3.0% appreciation + 3.0% rent growth), your $38k cash investment doubles in ~3 years — after that, you're playing with house money.
Negotiation context
- It's been on market 67 days — a 6% lower offer ($129k) is reasonable based on typical stale-listing flexibility.
Questions for the listing agent
- It's been on market 67 days. Have you received any prior offers? Is the seller open to a 6% concession, seller financing, or rate buy-down credit?
- Why hasn't it sold? Are there any deal-killer items the seller is aware of (foundation, flood, title, zoning, code violations)?
- Is there a deadline driving the sale (1031 exchange, divorce, estate, relocation)? That informs how much negotiation room exists.
- Schools are F-rated, which usually means shorter tenancies and higher turnover. Who's the typical renter profile here, and what's been the actual vacancy rate?
- What's the average days-on-market for RENTAL listings here right now (not sales)? A rising rental-DOM trend means longer vacancies and softer asking-rent achievability than the comps imply.
- What's the recent tenant-quality profile in this submarket — average credit score on applications, eviction rate, late-payment / NSF rate, and stable-employment percentage? A property-management company in the area should have these aggregated.
- How much new for-sale + rental construction is in the pipeline within 1–3 miles? Heavy new supply typically softens prices + rents 12–24 months out; constrained supply supports both.
Investment metrics
- 1% rule
- 1.91% ✓
- Cap rate
- 17.31%
- Cash-on-cash
- 39.35%
- DSCR
- 2.75
- GRM
- 4.4
CMA / ARV
- ARV (median comp)
- $85,010
- List price
- $137,000
- Delta
- 61.16%
- Verdict
- OVERPRICED
- Comps
- 13 within 1.0 mi
Show comp detail 12 sales within ~0.75 mi
| Address | Dist | Beds/Ba | Sqft | Sold | Price | $/sf | Match |
|---|---|---|---|---|---|---|---|
| 1010 Palm Canyon Dr #45 | 0.00mi | 2/2.0 (-1) | 1,296 (-4%) | 0mo | $46,000 | $35 | 89 |
| 1010 Palm Canyon Dr #159 | 0.00mi | 2/2.0 (-1) | 1,392 (+4%) | 2mo | $69,000 | $50 | 88 |
| 1010 Palm Canyon Dr #167 | 0.00mi | 2/2.0 (-1) | 1,440 (+7%) | 2mo | $70,000 | $49 | 82 |
| 1010 Palm Canyon Dr #240 | 0.00mi | 2/2.0 (-1) | 1,440 (+7%) | 3mo | $190,000 | $132 | 81 |
| 1010 Palm Canyon Dr #139 | 0.00mi | 2/2.0 (-1) | 1,440 (+7%) | 4mo | $65,000 | $45 | 79 |
| 1010 Palm Canyon Dr #35 | 0.28mi | 2/2.0 (-1) | 1,344 (0%) | 6mo | $86,250 | $64 | 77 |
| 1010 Palm Canyon Dr #89 | 0.00mi | 2/2.0 (-1) | 1,440 (+7%) | 8mo | $113,500 | $79 | 76 |
| 1010 Palm Cyn #305 | 0.00mi | 2/2.0 (-1) | 1,248 (-7%) | 8mo | $115,000 | $92 | 76 |
| 1010 Palm Canyon Dr #319 | 0.00mi | 2/2.0 (-1) | 1,440 (+7%) | 10mo | $108,000 | $75 | 75 |
| 1010 Palm Canyon Dr #310 | 0.00mi | 2/2.0 (-1) | 1,440 (+7%) | 11mo | $99,500 | $69 | 74 |
| 1010 Palm Canyon Dr #339 | 0.28mi | 2/2.0 (-1) | 1,248 (-7%) | 6mo | $140,000 | $112 | 65 |
| 1010 Palm Canyon Dr #59 | 0.28mi | 2/2.0 (-1) | 1,152 (-14%) | 8mo | $75,000 | $65 | 52 |
Match score weights: distance 35% · size 25% · config 20% · recency 20%. Top-matched comps best support the ARV.
Projected returns pro-forma
-3.0% appreciation · 3.0% rent growth · sell at horizon
- IRR
- 35.6%
- Equity multiple
- 2.51×
- Total profit
- $57,875
- Equity at exit
- $20,427
- IRR
- 42.3%
- Equity multiple
- 5.00×
- Total profit
- $153,386
- Equity at exit
- $11,845
Cash invested: $38,360 (down + closing). Projections, not guarantees.
Landlord ↔ Tenant lean methodology
- Overall (STATE)
- 18 Strongly Tenant-Friendly
- State California
- 18 Strongly Tenant-Friendly · D+13
- County
- — inherits STATE
- City
- — inherits STATE
ZIP-level market 92004
- Home prices YoY
- -18.4%
- Active inventory
- 174
- Price-to-rent
- 4.4×
Monthly cashflow live
- Estimated rent
- $2,620 medium interval (Pro) →
- Mortgage (P&I)
- −$718
- Tax from tax record
- −$36 /mo · $437/yr
- Insurance
- −$57
- HOA
- −$0
- Vacancy / Maint / Mgmt
- −$550
- Net cashflow
- $1,258
Break-even live
UW: 25.0% down · 7.5% · 30yr · 1.5% tax · 5.0% vac · 8.0% maint · 8.0% mgmt
Financing live
Cash to close
- Down payment
- $34,250
- Closing costs
- $4,110
- Reserves months
- —
- Total cash needed
- —
Loan-product check · same deal, 3 products live
Conventional
25% down · 7.5% · 30yr
- Down + closing
- —
- Monthly P&I
- —
- Monthly cashflow
- —
- DSCR
- —
- Eligible?
- —
Personal DTI + credit; lowest rate.
DSCR
20% down · 8.5% · 30yr
- Down + closing
- —
- Monthly P&I
- —
- Monthly cashflow
- —
- DSCR
- —
- Eligible?
- —
No personal income docs; deal must DSCR.
Hard money
10% down · 12.0% · 12mo
- Down + closing
- —
- Monthly P&I
- —
- Monthly cashflow
- —
- DSCR
- —
- Eligible?
- —
Short-term bridge; refi at stabilization.
Listing history 17 events
-
2026-06-19days on market $137,000 Active 67 DOM
-
2026-06-18days on market $137,000 Active 66 DOM
-
2026-06-17days on market $137,000 Active 65 DOM
-
2026-06-16days on market $137,000 Active 64 DOM
-
2026-06-15days on market $137,000 Active 63 DOM
-
2026-06-14days on market $137,000 Active 61 DOM
-
2026-06-12days on market $137,000 Active 60 DOM
-
2026-06-09days on market $137,000 Active 57 DOM
-
2026-06-08days on market $137,000 Active 56 DOM
-
2026-06-07days on market $137,000 Active 55 DOM
-
2026-06-07days on market $137,000 Active 54 DOM
-
2026-06-04days on market $137,000 Active 51 DOM
-
2026-06-02days on market $137,000 Active 50 DOM
-
2026-06-01days on market $137,000 Active 49 DOM
-
2026-05-31days on market $137,000 Active 48 DOM
-
2026-05-31days on market $137,000 Active 47 DOM
-
2026-04-11$137,000 Active 907-char remark
Show marketing remark (907 chars)
This spacious home has cathedral ceilings and is light & bright, with 2 newer, large, dual-pane windows that look out to the 1st fairway & green of the exclusive 55+ Roadrunner Golf & Country Club. Enjoy beautiful & lush views which include many palm trees, a pond & fountain on the fairway, and the iconic San Ysidro Mountains to the West. There is carpeting throughout and ceramic tile in the kitchen, both bathrooms & large laundry room. The main bath has a large oval tub and separate shower stall. This home has central forced heating and air conditioning along with a large fan in the living room. A nice sitting "wrap around" bar allows for entertaining and lots of counter space. You can enjoy the sunsets right from your living room or even better, on the front patio. This is on leased land with space rent. Don't miss this opportunity, call me today!
ⓘ Source: listings_history table (triggers on properties + properties_extension) + one-shot
backfill from property_details.listing_events for pre-trigger history.
Tax reassessment forecast CA · Resets to sale price
- Current annual tax
- $437 · $36/mo
- Projected year-2 tax
- $1,041 · $87/mo
- Expected delta
- +$604/yr (+$50/mo · 138.3%)
ⓘ Screening estimate from a state-policy table — verify with the county assessor before closing.
Nearby sold comps map
Loading sold comps map…
Walkable amenities ~0.75 mi
Loading nearby amenities…
Taxation est. · year 1
- Rental income
- $31,441
- − Mortgage interest
- −$7,674
- − Property taxes
- −$437
- − Insurance
- −$685
- − Repairs & maintenance
- −$2,515
- − Management
- −$2,515
- − Depreciation
- −$3,985
- Taxable income
- $13,629
- Est. tax owed @ 24.0%
- −$3,271
- After-tax cash flow
- $11,824/yr
For passive investors: Depreciation is non-cash, so a rental often shows a tax loss while cash-flowing — sheltering income. Rental losses are passive: they offset passive income freely, and up to $25,000/yr can offset ordinary (W-2) income if you actively participate and your MAGI is under $100k (phasing out to $0 by $150k); unused losses carry forward. On sale, claimed depreciation is recaptured at up to 25%, and gains may owe capital-gains tax (a 1031 exchange can defer both). Figures are a year-1 estimate at your 24.0% rate — not tax advice; consult a CPA.
Schools (NCES district)
- District
- Borrego Springs Unified
- NCES district ID
- 0605700
- Math proficiency
- 20% ▼ -6.00%
- Reading proficiency
- 35% ▼ -6.00%
- Median HH income
- $42,330
- Composite
- 26.31/100
- National rank
- #12684
- State rank
- #1120 of 1400 in CA
Livability — Borrego Springs
- Score
- 58/100
- State rank
- #712
- US rank
- #21334
Category grades
Schools grade is shown separately in the Schools card above.
Census & demographics
- Census place
- Borrego Springs, CA
- Population (ZIP)
- 3,030
Population outlook (San Diego County) Hauer SSP2
- Today (2025)
- 3,678,185 people
- By 2030
- 3,856,546 · +4.8%
- By 2040
- 4,171,407 · +13.4%
- By 2050
- 4,421,607 · +20.2%
- By 2075
- 4,831,599 · +31.4%
- By 2100
- 4,832,502 · +31.4%
Race, ethnicity, and origin ACS 2023
- Neighborhood character
- Predominantly White (66%)
- Race & ethnicity
- White 66% Hispanic / Latino 33% Two or more races 24%
- Hispanic origin (detail)
- Mexican 29%
- Common ancestry
- Lithuanian 10% Slovak 5% Scotch-Irish 1%
- Foreign-born
- 27% · Canada
- Languages at home
- 70% English-only · Spanish 30%
Political lean MEDSL · San Diego
- 2024 margin
- D (+16.8) · D 56.9% · R 40.1% · Other 2.9%
- 2008→2024 swing
- +6.6pp toward D · 2008: 10.2pp · 2024: 16.8pp
- All cycles
- 2024: D+16.8 2020: D+22.8 2016: D+17.8 2012: D+5.1 2008: D+10.2
Not yet ingested
- Civics
- —
Market trends
- HPI YoY
- ▼ -50.39%
- Current HPI
- 222.8196
- Rent YoY
- —
- Metro
- —
- State GDP YoY
- ▲ 3.21%
- F500 in state
- 116
Industry mix (Fortune 500 HQ in CA)
| Industry | F500 HQs | Revenue |
|---|---|---|
| Technology | 27 | $1,492B |
|
||
| Financial Services | 3 | $174B |
|
||
| Retail | 3 | $44B |
|
||
| Insurance | 3 | $26B |
|
||
| Media / Entertainment | 2 | $115B |
|
||
| Pharmaceuticals / Biotech | 2 | $62B |
|
||
Price history
1 event — show timeline
- 2026-04-11 Listed $137,000 CRMLS
Property tax history
+1.5%/yrLatest (2013): $437 · +2.0% YoY. Source: county tax records.
Cash-flow waterfall
monthlySold comps — $/sqft
last 12 mo · ≤1 miLoading sold comps…