5220 Clay Lane Highway 43 · Northport, AL
Flood risk 1/10 · Minimal
- FEMA flood zone
- X (unshaded)
- Chance of flooding over 30 yrs
- 0.0%
- Est. flood insurance / yr
- $507 – $1,088
Fire risk 5/10 · Moderate
- Est. fire insurance / yr
- $916 – $1,700
Heat risk 6/10 · Moderate
- Hot days now (above 108°F)
- 6 days/yr
- Hot days in 30 yrs
- 17 days/yr
Wind risk 6/10 · Moderate
- Chance of severe wind over 30 yrs
- 46.0%
Air-quality risk 2/10 · Minimal
- Unhealthy air days now
- 2 days/yr
- Unhealthy air days in 30 yrs
- 2 days/yr
Risk factors via First Street. Map © Google.
Why this score? — see what drove the D+ grade
The composite is a weighted blend of 9 inputs, each scored 0–100. Each bar is that input's sub-score; the figure is the points it added to the 100-point composite (weight × sub-score).
- ARV discount +15.0/15.0
- Cash flow +12.5/30.0
- Livability +3.9/5.0
- DSCR +3.7/10.0
- 1% rule +3.6/10.0
- Schools +2.9/10.0
- Rent growth +2.5/5.0
- Condition / age +2.5/5.0
- Appreciation +0.0/10.0
$225,000
🖨 Deal sheet (PDF) 📄 Offer letter ✓ Due diligence
Listing remarks MLS
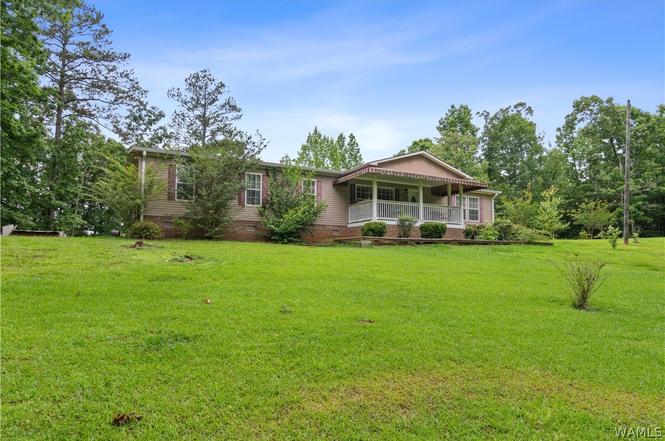
Experience the epitome of country living at 5220 Clay Lane. Boasting a huge fruit tree in the front yard, this home offers the perfect opportunity to savor a fresh snack while exploring the 3.45-acre property. The four bedrooms also provide ample room for guest. Enjoy privacy and proximity to shops and restaurants.
Key facts
- Huge fruit tree
- 3.45-acre property
- 3.45 acre lot
Tags
Neighborhood map
What this means for you Summary
Snapshot
- This is a 4-bed/2.0-bath single-family listed at $225k.
Deal economics
- At list price, monthly cash flow is $-31 ($-371/yr) — negative.
- To cash-flow at today's rent, offer at most $221k (2.0% below list).
- To meet the 1% rule (rent ≥ 1% of price), the offer needs to be $193k (14.3% below list).
- Recommended offer: $193k (14.3% below list) — sets the bar for 1% rule.
- Cap rate 6.1% vs local median 4.2% in Northport — top-decile yield for the area; either an underpriced asset or a hidden risk that comps aren't pricing in. Stress-test before assuming the spread holds.
Location & tenants
- Location reads 78/100 on livability (#8 in AL, #2,686 nationally) — a middle-class / working-renter tenant base. Strengths: cost of living A+, housing A+, health & safety A+; Watch: commute F.
- Tuscaloosa County (suburban): math 21% / reading 45% proficiency, ranked #47 of 129 in AL (top 36%) — families likely to look elsewhere, expect single-tenant / working-renter base with shorter leases.
- Zoned schools: Crestmont Elementary School (math 22% / reading 42%, grade F, #331 of 627 statewide, top 57%, 270 students, 79% FRL); Tuscaloosa County High School (math 26% / reading 30%, grade F, #87 of 305 statewide, top 29%, 1,545 students, 55% FRL) — zoned schools average 67% FRL vs 45% district-wide (22 pts higher); higher-poverty schools than district average — tighter screening recommended.
- Market conditions: 111 active listings in the ZIP; 622 units permitted in Tuscaloosa County in 2024 (69 in 5+ unit buildings).
- This rent runs 33% of the median local income ($70k/yr) — at the standard rent-burdened threshold; future hikes will face affordability resistance.
Forward outlook
- Local home prices are declining (-3.0%/yr); year-one equity from $2k of loan paydown is wiped out by about $7k of value loss. Plan a longer hold.
- Tuscaloosa County population projected at +26% by 2050 — long-run rental-demand tailwind backs the buy-and-hold thesis.
Negotiation context
- Only 12 days on market — expect competitive offers; lowballing is unlikely to land.
- 2 sale attempts since 2y ago with the ask held roughly flat each time — persistent listings suggest the price (not the market) is what's stuck; bring a comps-based counter.
Risks & watch-outs
- Climate carrying-cost: major wind risk, 46% chance of damaging wind over 30y; moderate wildfire risk; extreme-heat days projected 6→17/yr by 2055 (HVAC capex compounding) — expect insurance premiums to compound above CPI over the hold.
Questions for the listing agent
- What do current leases actually rent for vs. the listed asking? Can we see a recent rent roll and the last 12 months of T-12 income?
- Is there a deadline driving the sale (1031 exchange, divorce, estate, relocation)? That informs how much negotiation room exists.
- The area grade is low — what's the realistic commute time and amenity access for the typical tenant pool here? Any planned neighborhood developments (good or bad) we should know about?
- What's the average days-on-market for RENTAL listings here right now (not sales)? A rising rental-DOM trend means longer vacancies and softer asking-rent achievability than the comps imply.
- What's the recent tenant-quality profile in this submarket — average credit score on applications, eviction rate, late-payment / NSF rate, and stable-employment percentage? A property-management company in the area should have these aggregated.
- How much new for-sale + rental construction is in the pipeline within 1–3 miles? Heavy new supply typically softens prices + rents 12–24 months out; constrained supply supports both.
Investment metrics
- 1% rule
- 0.86% ✗
- Cap rate
- 6.13%
- Cash-on-cash
- -0.59%
- DSCR
- 0.97
- GRM
- 9.7
CMA / ARV
- ARV (on-the-fly)
- $346,752
- Comps found
- 6
Show comp detail 6 sales within ~0.75 mi
| Address | Dist | Beds/Ba | Sqft | Sold | Price | $/sf | Match |
|---|---|---|---|---|---|---|---|
| 7908 Lake Sherwood Cir | 0.24mi | 3/2.0 (-1) | 2,076 (+3%) | 2mo | $364,000 | $175 | 77 |
| 7801 Lake Sherwood Cir | 0.16mi | 3/2.0 (-1) | 2,077 (+3%) | 18mo | $280,000 | $135 | 67 |
| 7904 Lake Sherwood Cir | 0.23mi | 3/2.0 (-1) | 1,951 (-3%) | 23mo | $328,000 | $168 | 60 |
| 4010 93rd St | 0.57mi | 3/2.0 (-1) | 1,958 (-3%) | 9mo | $290,000 | $148 | 56 |
| 13193 Autumnwood Pkwy | 0.61mi | 4/2.0 | 2,144 (+6%) | 6mo | $374,900 | $175 | 56 |
| 12151 Autumn Leaves Trl | 0.61mi | 4/2.5 | 2,168 (+8%) | 16mo | $373,400 | $172 | 43 |
Match score weights: distance 35% · size 25% · config 20% · recency 20%. Top-matched comps best support the ARV.
Projected returns pro-forma
-3.0% appreciation · 3.0% rent growth · sell at horizon
- IRR
- -17.3%
- Equity multiple
- 0.39×
- Total profit
- $-38,399
- Equity at exit
- $33,548
- IRR
- -9.2%
- Equity multiple
- 0.43×
- Total profit
- $-35,853
- Equity at exit
- $19,454
Cash invested: $63,000 (down + closing). Projections, not guarantees.
Landlord ↔ Tenant lean methodology
- Overall (STATE)
- 90 Strongly Landlord-Friendly
- State Alabama
- 90 Strongly Landlord-Friendly · R+15
- County
- — inherits STATE
- City
- — inherits STATE
ZIP-level market 35473
- Home prices YoY
- -14.6%
- Active inventory
- 111
- Price-to-rent
- 9.7×
Monthly cashflow live
- Estimated rent
- $1,929 medium interval (Pro) →
- Mortgage (P&I)
- −$1,180
- Tax est. 1.5%
- −$281 /mo · $3,375/yr
- Insurance
- −$94
- HOA
- −$0
- Vacancy / Maint / Mgmt
- −$405
- Net cashflow
- $-31
Break-even live
Sensitivity live
| Price | -10% $125 | -5% $47 | +0% $-31 | +5% $-109 | +10% $-186 |
|---|---|---|---|---|---|
| Rent | -10% $-183 | -5% $-107 | +0% $-31 | +5% $45 | +10% $121 |
| Rate | -1.0pp $82 | -0.5pp $26 | base $-31 | +0.5pp $-89 | +1.0pp $-149 |
UW: 25.0% down · 7.5% · 30yr · 1.5% tax · 5.0% vac · 8.0% maint · 8.0% mgmt
Financing live
Cash to close
- Down payment
- $56,250
- Closing costs
- $6,750
- Reserves months
- —
- Total cash needed
- —
Loan-product check · same deal, 3 products live
Conventional
25% down · 7.5% · 30yr
- Down + closing
- —
- Monthly P&I
- —
- Monthly cashflow
- —
- DSCR
- —
- Eligible?
- —
Personal DTI + credit; lowest rate.
DSCR
20% down · 8.5% · 30yr
- Down + closing
- —
- Monthly P&I
- —
- Monthly cashflow
- —
- DSCR
- —
- Eligible?
- —
No personal income docs; deal must DSCR.
Hard money
10% down · 12.0% · 12mo
- Down + closing
- —
- Monthly P&I
- —
- Monthly cashflow
- —
- DSCR
- —
- Eligible?
- —
Short-term bridge; refi at stabilization.
Listing history 5 events
-
2024-08-09soldstatus $225,000 Closed 316-char remark
Show marketing remark (316 chars)
Experience the epitome of country living at 5220 Clay Lane. Boasting a huge fruit tree in the front yard, this home offers the perfect opportunity to savor a fresh snack while exploring the 3.45-acre property. The four bedrooms also provide ample room for guest. Enjoy privacy and proximity to shops and restaurants.
-
2024-06-02status Pending
-
2024-05-30status Pending 316-char remark
Show marketing remark (316 chars)
Experience the epitome of country living at 5220 Clay Lane. Boasting a huge fruit tree in the front yard, this home offers the perfect opportunity to savor a fresh snack while exploring the 3.45-acre property. The four bedrooms also provide ample room for guest. Enjoy privacy and proximity to shops and restaurants.
-
2024-05-20$225,000 Active 316-char remark
Show marketing remark (316 chars)
Experience the epitome of country living at 5220 Clay Lane. Boasting a huge fruit tree in the front yard, this home offers the perfect opportunity to savor a fresh snack while exploring the 3.45-acre property. The four bedrooms also provide ample room for guest. Enjoy privacy and proximity to shops and restaurants.
-
2024-05-20$225,000 Active
Show marketing remark (316 chars)
Experience the epitome of country living at 5220 Clay Lane. Boasting a huge fruit tree in the front yard, this home offers the perfect opportunity to savor a fresh snack while exploring the 3.45-acre property. The four bedrooms also provide ample room for guest. Enjoy privacy and proximity to shops and restaurants.
ⓘ Source: listings_history table (triggers on properties + properties_extension) + one-shot
backfill from property_details.listing_events for pre-trigger history.
Climate risk First Street
- Flood 1/10 Low FEMA zone X (unshaded) · 0% chance over 30 yrs
- Wildfire 5/10 Major
- Heat 6/10 Major 6 d/yr ≥108°F today · 17 d/yr by 30 yrs out
- Wind 6/10 Major 46% chance of damaging wind over 30 yrs
- Air quality 2/10 Low 2 unhealthy d/yr today · 2 by 30 yrs out
Nearby sold comps map
Loading sold comps map…
Walkable amenities ~0.75 mi
Loading nearby amenities…
Taxation est. · year 1
- Rental income
- $23,150
- − Mortgage interest
- −$12,603
- − Property taxes
- −$3,375
- − Insurance
- −$1,125
- − Repairs & maintenance
- −$1,852
- − Management
- −$1,852
- − Depreciation
- −$6,545
- Taxable loss
- −$4,203
- Est. tax savings @ 24.0%
- +$1,009
- After-tax cash flow
- $638/yr
For passive investors: Depreciation is non-cash, so a rental often shows a tax loss while cash-flowing — sheltering income. Rental losses are passive: they offset passive income freely, and up to $25,000/yr can offset ordinary (W-2) income if you actively participate and your MAGI is under $100k (phasing out to $0 by $150k); unused losses carry forward. On sale, claimed depreciation is recaptured at up to 25%, and gains may owe capital-gains tax (a 1031 exchange can defer both). Figures are a year-1 estimate at your 24.0% rate — not tax advice; consult a CPA.
Schools (NCES district)
- District
- Tuscaloosa County
- NCES district ID
- 0103390
- Math proficiency
- 21% ▼ -24.00%
- Reading proficiency
- 45% ▲ 2.00%
- Median HH income
- $53,000
- Composite
- 28.88/100
- National rank
- #6641
- State rank
- #47 of 129 in AL
Livability — Northport
- Score
- 78/100
- State rank
- #8
- US rank
- #2686
Category grades
Schools grade is shown separately in the Schools card above.
Census & demographics
- County
- Tuscaloosa County · 206,491 people
- City population
- 47,464
- Metro
- Tuscaloosa, AL
- Population (ZIP)
- 18,198
- Household income
- $69,657
- Rent vs Own
- Severe rent burden
- 740.0
Population outlook (Tuscaloosa County) Hauer SSP2
- Today (2025)
- 228,293 people
- By 2030
- 240,551 · +5.4%
- By 2040
- 263,856 · +15.6%
- By 2050
- 286,491 · +25.5%
- By 2075
- 335,783 · +47.1%
- By 2100
- 370,520 · +62.3%
Race, ethnicity, and origin ACS 2023
- Neighborhood character
- Predominantly White (69%)
- Race & ethnicity
- White 69% Black 20% Hispanic / Latino 9% Two or more races 6%
- Hispanic origin (detail)
- Mexican 4%
- Common ancestry
- Serbian 3% Slovak 1% Italian 1%
- Foreign-born
- 6% · Canada
- Languages at home
- 91% English-only · Spanish 6% German/W. Germanic 1%
Political lean MEDSL · Tuscaloosa
- 2024 margin
- Strong R (+20.4) · D 39.4% · R 59.8%
- 2008→2024 swing
- -4.4pp toward R · 2008: -16.0pp · 2024: -20.4pp
- All cycles
- 2024: R+20.4 2020: R+14.8 2016: R+19.5 2012: R+17.4 2008: R+16.0
Not yet ingested
- Civics
- —
Market trends
- HPI YoY
- ▼ -37.92%
- Current HPI
- 222.5458
- Rent YoY
- —
- Metro
- Tuscaloosa, AL
- State GDP YoY
- ▲ 2.94%
- F500 in state
- 4
Industry mix (Fortune 500 HQ in AL)
| Industry | F500 HQs | Revenue |
|---|---|---|
| Financial Services | 1 | $8B |
|
||
| Healthcare | 1 | $5B |
|
||
Price history
+0.0% since first listed5 events — show timeline
- 2024-08-09 Sold (MLS) $225,000 WAMLS
- 2024-06-02 Pending — Greater Alabama MLS
- 2024-05-30 Pending — WAMLS
- 2024-05-20 Listed $225,000 WAMLS
- 2024-05-20 Listed $225,000 Greater Alabama MLS
Cash-flow waterfall
monthlySold comps — $/sqft
last 12 mo · ≤1 miLoading sold comps…