 Duplex
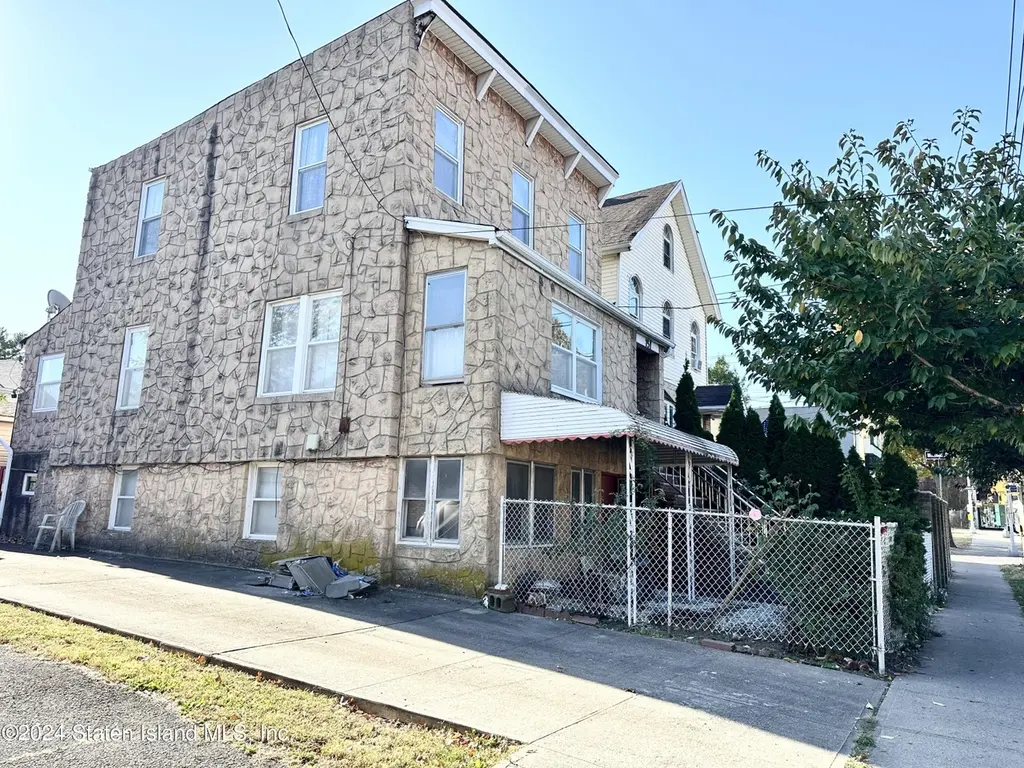
751 Targee St · New York, NY
Flood risk 1/10 · Minimal
- FEMA flood zone
- X (unshaded)
- Chance of flooding over 30 yrs
- 0.0%
- Est. flood insurance / yr
- $507 – $1,088
Fire risk 2/10 · Minimal
- Est. fire insurance / yr
- $691 – $1,283
Heat risk 7/10 · Major
- Hot days now (above 98°F)
- 7 days/yr
- Hot days in 30 yrs
- 16 days/yr
Wind risk 6/10 · Moderate
- Chance of severe wind over 30 yrs
- 61.0%
Air-quality risk 4/10 · Minor
- Unhealthy air days now
- 5 days/yr
- Unhealthy air days in 30 yrs
- 7 days/yr
Risk factors via First Street. Map © Google.
Why this score? — see what drove the D grade
The composite is a weighted blend of 9 inputs, each scored 0–100. Each bar is that input's sub-score; the figure is the points it added to the 100-point composite (weight × sub-score).
- Cash flow +11.4/30.0
- ARV discount +10.9/15.0
- Schools +5.0/10.0
- Livability +3.8/5.0
- DSCR +3.3/10.0
- Rent growth +3.0/5.0
- Condition / age +2.5/5.0
- 1% rule +2.3/10.0
- Appreciation +0.0/10.0
$699,999
🖨 Deal sheet (PDF) 📄 Offer letter ✓ Due diligence
Multi-family units
County records classify this as Multi-Family (2-4 Unit). Listing-text estimate: 2 units. confirmed
Listing remarks
Welcome to this charming two-family detached home located in the Clifton area of Staten Island. Built in 1915, this historic property includes a beautifully renovated first-floor kitchen completed in 2022, featuring sleek granite countertops and chandelier in dining area. The main unit offers 3 bedrooms, 3 bathrooms (1 full and 2 three-quarter), providing ample space for comfortable living. The second unit includes 1 bedroom, a cozy living room, a kitchen/dining combo, and a full bathroom, making it ideal for rental income. Conveniently situated near a new shopping plaza, this home is priced reasonably, offering both charm and practicality in a prime Staten Island location.
Key facts
- Cozy living room
- Granite countertops
- Kitchen dining combo
Tags
Property features AI
Exterior
- Parking: Off-street parking available; On-street parking available; No attached garage
- Utilities: 220 volt electric service
- Home design: Multifamily property with 2 units; 3 stories
- Construction: Brick construction; Year built listed as approximate
- Exterior features: Brick exterior; Lot approximately 0.07 acres (38 x 78); Zoned R3A
Interior
- Bedrooms: Unit 1 has 3 bedrooms; Unit 2 has 1 bedroom on level 2
- Bathrooms: Total of 3 bathrooms (1 full, 2 three-quarter)
- Heating & cooling: Natural gas heating; Hot water heating
- Interior features: Good overall condition; Three-story building
Neighborhood map
What this means for you Summary
Snapshot
- This is a 1×3bd/3.0ba + 1×1bd/1.0ba units multifamily listed at $700k.
Deal economics
- At list price, monthly cash flow is $-240 ($-3k/yr) — negative. Per door: $-120/mo.
- To cash-flow at today's rent, offer at most $658k (6.1% below list).
- To meet the 1% rule (rent ≥ 1% of price), the offer needs to be $514k (26.6% below list).
- Recommended offer: $514k (26.6% below list) — sets the bar for 1% rule.
- Cap rate 5.9% vs local median 2.6% in New York — top-decile yield for the area; either an underpriced asset or a hidden risk that comps aren't pricing in. Stress-test before assuming the spread holds.
Location & tenants
- Location reads 75/100 on livability (#268 in NY, #4,188 nationally) — a middle-class / working-renter tenant base. Strengths: amenities A+, commute A+, health & safety A; Watch: crime F, cost of living F.
- Zoned schools: Elm Tree Elementary School (math 27% / reading 52%, grade F, #1,444 of 2,108 statewide, top 71%, 806 students, 94% FRL); Jhs 383 Philippa Schuyler (math 32% / reading 67%, grade C, #280 of 729 statewide, top 40%, 822 students, 85% FRL); Midwood High School (math 94% / reading 96%, grade A+, #83 of 1,100 statewide, top 8%, 4,062 students, 73% FRL).
- Market conditions: Rents rising (+2.0%/yr); 204 active listings in the ZIP; 480 units permitted in Richmond County in 2024 (22 in 5+ unit buildings).
- At $5,137/mo this rent would consume 86% of the median local household income ($72k/yr) (locally 2401% of renters already pay >50% of income on rent) — very limited rent-growth headroom before tenants either downsize or default.
Forward outlook
- Local home prices are declining (-3.0%/yr); year-one equity from $5k of loan paydown is wiped out by about $21k of value loss. Plan a longer hold.
- Richmond County population projected to shrink 5% by 2050 — rents likely to lag national; underwrite the cash flow, not the appreciation.
Negotiation context
- It's been on market 16 days — a 2% lower offer ($689k) is reasonable based on typical stale-listing flexibility.
- 2 sale attempts since 2y ago with the ask held roughly flat each time — persistent listings suggest the price (not the market) is what's stuck; bring a comps-based counter.
Risks & watch-outs
- Watch-outs: built in 1915 — expect roof / HVAC / electrical / plumbing capex.
- Climate carrying-cost: major wind risk, 61% chance of damaging wind over 30y; extreme-heat days projected 7→16/yr by 2055 (HVAC capex compounding) — expect insurance premiums to compound above CPI over the hold.
Questions for the listing agent
- What do current leases actually rent for vs. the listed asking? Can we see a recent rent roll and the last 12 months of T-12 income?
- Can we see the unit-by-unit rent roll, current vacancy, and any below-market leases? What's the average tenancy length?
- What capital expenditures (roof, boiler, parking lot, exteriors) have been made in the last 5 years, and what's planned in the next 2?
- Built in 1915 — when were the roof, HVAC, electrical panel, plumbing, and water heater last replaced?
- Is there a deadline driving the sale (1031 exchange, divorce, estate, relocation)? That informs how much negotiation room exists.
- Schools are B-rated — typically a magnet for longer-tenancy family renters. What's the average tenant stay here, and is there a school-zone premium baked into asking?
- Crime grade is F in this area — have there been break-ins, vandalism, or insurance claims at this property in the last 3 years? What carrier currently insures it and at what premium?
- The area grade is low — what's the realistic commute time and amenity access for the typical tenant pool here? Any planned neighborhood developments (good or bad) we should know about?
- What's the average days-on-market for RENTAL listings here right now (not sales)? A rising rental-DOM trend means longer vacancies and softer asking-rent achievability than the comps imply.
- What's the recent tenant-quality profile in this submarket — average credit score on applications, eviction rate, late-payment / NSF rate, and stable-employment percentage? A property-management company in the area should have these aggregated.
- How much new apartment / multifamily construction is in the pipeline within 1–3 miles? Heavy new supply (>2% of stock underway) typically softens rents 12–24 months out; light construction supports rent growth.
Investment metrics
- 1% rule
- 0.73% ✗
- Cap rate
- 5.88%
- Cash-on-cash
- -1.47%
- DSCR
- 0.93
- GRM
- 11.4
CMA / ARV
- ARV (on-the-fly)
- $756,840
- Comps found
- 1
Show comp detail 1 sale within ~0.75 mi
| Address | Dist | Beds/Ba | Sqft | Sold | Price | $/sf | Match |
|---|---|---|---|---|---|---|---|
| 601 Richmond Rd | 0.21mi | 5/4.0 (-1) | 1,458 (+15%) | 0mo | $868,000 | $595 | 52 |
Match score weights: distance 35% · size 25% · config 20% · recency 20%. Top-matched comps best support the ARV.
Projected returns pro-forma
-3.0% appreciation · 1.99% rent growth · sell at horizon
- IRR
- -19.8%
- Equity multiple
- 0.32×
- Total profit
- $-134,125
- Equity at exit
- $104,372
- IRR
- -14.7%
- Equity multiple
- 0.19×
- Total profit
- $-158,274
- Equity at exit
- $60,523
Cash invested: $196,000 (down + closing). Projections, not guarantees.
Landlord ↔ Tenant lean methodology
- Overall (CITY)
- 0 Strongly Tenant-Friendly
- State New York
- 15 Strongly Tenant-Friendly · D+10
- County
- — inherits STATE
- City New York
- 0 Strongly Tenant-Friendly · D+34
ZIP-level market 10304
- Rents YoY
- 2.0%
- Active inventory
- 204
- Price-to-rent
- 20.3×
Monthly cashflow live
- Estimated rent
- $5,137 medium interval (Pro) →
- Mortgage (P&I)
- −$3,671
- Tax from tax record
- −$335 /mo · $4,026/yr
- Insurance
- −$292
- HOA
- −$0
- Vacancy / Maint / Mgmt
- −$1,079
- Net cashflow
- $-240
Break-even live
Sensitivity live
| Price | -10% $156 | -5% $-42 | +0% $-240 | +5% $-438 | +10% $-636 |
|---|---|---|---|---|---|
| Rent | -10% $-646 | -5% $-443 | +0% $-240 | +5% $-37 | +10% $166 |
| Rate | -1.0pp $113 | -0.5pp $-62 | base $-240 | +0.5pp $-421 | +1.0pp $-606 |
2-unit breakdown (identical units grouped — click to expand)
| Units | Beds | Baths | Est. rent |
|---|---|---|---|
| 1× unit | 3 | 3 | $2,875 |
| 1× unit | 1 | 1 | $2,263 |
| Total (2 units) | $5,137 | ||
UW: 25.0% down · 7.5% · 30yr · 1.5% tax · 5.0% vac · 8.0% maint · 8.0% mgmt
Financing live
Cash to close
- Down payment
- $175,000
- Closing costs
- $21,000
- Reserves months
- —
- Total cash needed
- —
Loan-product check · same deal, 3 products live
Conventional
25% down · 7.5% · 30yr
- Down + closing
- —
- Monthly P&I
- —
- Monthly cashflow
- —
- DSCR
- —
- Eligible?
- —
Personal DTI + credit; lowest rate.
DSCR
20% down · 8.5% · 30yr
- Down + closing
- —
- Monthly P&I
- —
- Monthly cashflow
- —
- DSCR
- —
- Eligible?
- —
No personal income docs; deal must DSCR.
Hard money
10% down · 12.0% · 12mo
- Down + closing
- —
- Monthly P&I
- —
- Monthly cashflow
- —
- DSCR
- —
- Eligible?
- —
Short-term bridge; refi at stabilization.
Listing history 6 events
-
2026-05-13status Pending
-
2026-04-27$699,999 Active
-
2024-12-02status Pending
-
2024-12-02historical
-
2024-10-29historical Contingent
-
2024-10-22$719,000 Active
ⓘ Source: listings_history table (triggers on properties + properties_extension) + one-shot
backfill from property_details.listing_events for pre-trigger history.
Tax reassessment forecast NY · Partial reset (capped growth)
- Current annual tax
- $4,026 · $335/mo
- Projected year-2 tax
- $7,928 · $661/mo
- Expected delta
- +$3,902/yr (+$325/mo · 96.9%)
ⓘ Screening estimate from a state-policy table — verify with the county assessor before closing.
Climate risk First Street
- Flood 1/10 Low FEMA zone X (unshaded) · 0% chance over 30 yrs
- Wildfire 2/10 Low
- Heat 7/10 Severe 7 d/yr ≥98°F today · 16 d/yr by 30 yrs out
- Wind 6/10 Major 61% chance of damaging wind over 30 yrs
- Air quality 4/10 Moderate 5 unhealthy d/yr today · 7 by 30 yrs out
Nearby sold comps map
Loading sold comps map…
Walkable amenities ~0.75 mi
Loading nearby amenities…
Taxation est. · year 1
- Rental income
- $61,644
- − Mortgage interest
- −$39,211
- − Property taxes
- −$4,026
- − Insurance
- −$3,500
- − Repairs & maintenance
- −$4,932
- − Management
- −$4,932
- − Depreciation
- −$20,364
- Taxable loss
- −$15,319
- Est. tax savings @ 24.0%
- +$3,677
- After-tax cash flow
- $799/yr
For passive investors: Depreciation is non-cash, so a rental often shows a tax loss while cash-flowing — sheltering income. Rental losses are passive: they offset passive income freely, and up to $25,000/yr can offset ordinary (W-2) income if you actively participate and your MAGI is under $100k (phasing out to $0 by $150k); unused losses carry forward. On sale, claimed depreciation is recaptured at up to 25%, and gains may owe capital-gains tax (a 1031 exchange can defer both). Figures are a year-1 estimate at your 24.0% rate — not tax advice; consult a CPA.
Schools (NCES district)
No district data.
Livability — New York
- Score
- 75/100
- State rank
- #268
- US rank
- #4188
Category grades
Schools grade is shown separately in the Schools card above.
Census & demographics
- Census place
- New York, NY
- County
- Richmond County · 404,174 people
- City population
- 7,731,280
- Metro
- New York-Newark-Jersey City, NY-NJ-PA
- Population (ZIP)
- 45,658
- Household income
- $71,561
- Rent vs Own
- Severe rent burden
- 2401.0
Population outlook (Richmond County) Hauer SSP2
- Today (2025)
- 482,784 people
- By 2030
- 481,831 · -0.2%
- By 2040
- 473,159 · -2.0%
- By 2050
- 457,242 · -5.3%
- By 2075
- 408,029 · -15.5%
- By 2100
- 341,459 · -29.3%
Race, ethnicity, and origin ACS 2023
- Neighborhood character
- Highly diverse neighborhood (Simpson 0.73)
- Race & ethnicity
- White 36% Black 25% Hispanic / Latino 24% Asian 13% Two or more races 8% Native American 1%
- Hispanic origin (detail)
- Mexican 4% Puerto Rican 10% Dominican 2%
- Common ancestry
- Scotch-Irish 3% Romanian 2% Swiss 2%
- Foreign-born
- 32% · Canada, China, Jamaica
- Languages at home
- 54% English-only · Spanish 16% Chinese 8% Other Indo-European 5%
Political lean MEDSL · Richmond
- 2024 margin
- Strong R (+29.8) · D 35.1% · R 64.9%
- 2008→2024 swing
- -25.7pp toward R · 2008: -4.0pp · 2024: -29.8pp
- All cycles
- 2024: R+29.8 2020: R+14.9 2016: R+16.8 2012: D+0.8 2008: R+4.0
Not yet ingested
- Civics
- —
Market trends
- HPI YoY
- ▼ -254.93%
- Current HPI
- 346.7976
- Rent YoY
- ▲ 1.99%
- Metro
- New York-Newark-Jersey City, NY-NJ-PA
- State GDP YoY
- ▲ 2.60%
- F500 in state
- 92
Industry mix (Fortune 500 HQ in NY)
| Industry | F500 HQs | Revenue |
|---|---|---|
| Financial Services | 10 | $950B |
|
||
| Consumer Goods | 9 | $162B |
|
||
| Insurance | 4 | $225B |
|
||
| Telecommunications | 2 | $144B |
|
||
| Pharmaceuticals | 2 | $112B |
|
||
| Media / Entertainment | 2 | $69B |
|
||
Price history
-2.6% since first listed6 events — show timeline
- 2026-05-13 Pending — SIBORMLS
- 2026-04-27 Listed $699,999 SIBORMLS
- 2024-12-02 Pending — SIBORMLS
- 2024-12-02 Listing Removed — SIBORMLS
- 2024-10-29 Contingent — SIBORMLS
- 2024-10-22 Listed $719,000 SIBORMLS
Property tax history
+17.2%/yrLatest (2025): $4,026 · +6.0% YoY. Source: county tax records.
Cash-flow waterfall
monthlySold comps — $/sqft
last 12 mo · ≤1 miLoading sold comps…