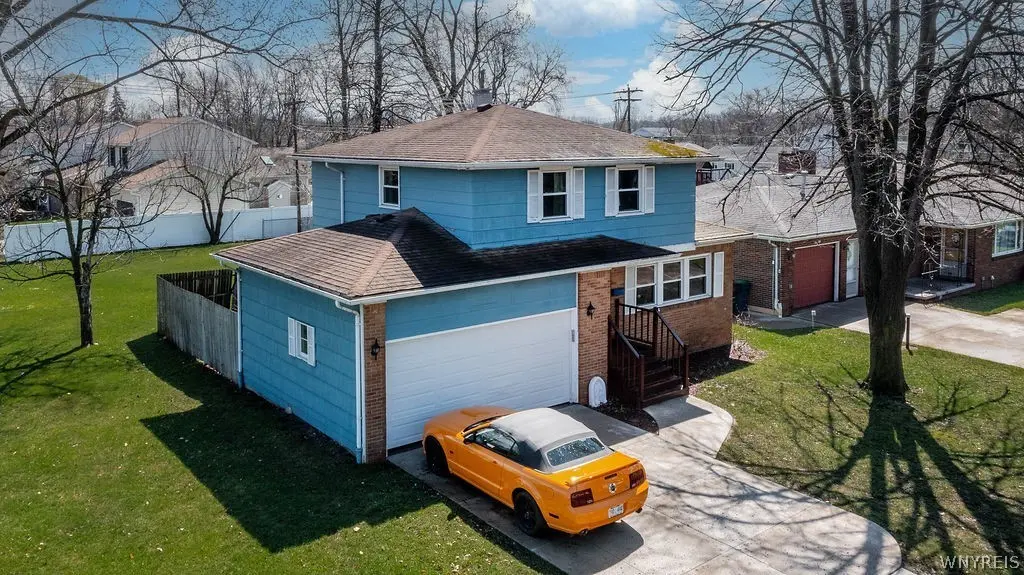
91 Cottonwood Dr · University at Buffalo, NY
Flood risk 1/10 · Minimal
- FEMA flood zone
- X (unshaded)
- Chance of flooding over 30 yrs
- 0.0%
- Est. flood insurance / yr
- $473 – $860
Fire risk 1/10 · Minimal
- Est. fire insurance / yr
- $691 – $1,283
Heat risk 2/10 · Minimal
- Hot days now (above 94°F)
- 7 days/yr
- Hot days in 30 yrs
- 15 days/yr
Wind risk 1/10 · Minimal
- Chance of severe wind over 30 yrs
- —
Air-quality risk 2/10 · Minimal
- Unhealthy air days now
- 2 days/yr
- Unhealthy air days in 30 yrs
- 2 days/yr
Risk factors via First Street. Map © Google.
Why this score? — see what drove the C grade
The composite is a weighted blend of 9 inputs, each scored 0–100. Each bar is that input's sub-score; the figure is the points it added to the 100-point composite (weight × sub-score).
- Cash flow +17.0/30.0
- ARV discount +15.0/15.0
- Schools +6.3/10.0
- DSCR +5.3/10.0
- 1% rule +5.2/10.0
- Livability +4.4/5.0
- Rent growth +3.8/5.0
- Condition / age +2.5/5.0
- Appreciation +0.0/10.0
$299,500
🖨 Deal sheet (PDF) 📄 Offer letter ✓ Due diligence
Listing remarks
Fantastic opportunity in a prime location! Classic brick front 4-bedroom Colonial is bursting with potential! Improvements include: * * concrete driveway * * 21 windows replaced * * new circuit breakers * * 2 car attached garage * * poured concrete basement * * Williamsville School district * * large corner lot * * Property is just blocks from Clearfield Recreation Complex, Clearfield Public Library and Dash's Market which has a plaza with a variety of stores and restaurants. * * Showings begin at Open House on Sunday, 4/19 from 1-4 pm. * * Please submit purchase offers by Tues, 4/21 @ 4pm.
Key facts
- Large corner lot
- New circuit breakers
- 21 windows replaced
Tags
Neighborhood map
What this means for you Summary
Snapshot
- This is a 4-bed/1.5-bath single-family listed at $300k.
Deal economics
- At list price, monthly cash flow is $200 ($2k/yr) — positive.
- The deal already cash-flows at list — no discount required.
- Meets the 1% rule at list price ($3k rent vs $300k).
- Cap rate 7.1% vs local median 2.8% in University at Buffalo — top-decile yield for the area; either an underpriced asset or a hidden risk that comps aren't pricing in. Stress-test before assuming the spread holds.
Location & tenants
- Location reads 88/100 on livability (#9 in NY, #176 nationally) — a professional / high-income tenant draw. Strengths: schools A+, amenities A+, commute A+; Watch: cost of living D+, employment F.
- Williamsville Central School District (suburban): math 64% / reading 77% proficiency, ranked #114 of 590 in NY (top 19%) — strong family-tenant draw, lease renewals of 3-5y typical; only 10% free/reduced lunch — higher-income household profile.
- Market conditions: Rents rising fast (+5.0%/yr); 334 active listings in the ZIP; 3 comparable units currently listed for rent nearby; rentals leasing fast (median 6d on market — plan ~1-2 weeks tenant-placement turnaround); solid renter incomes; 1,244 units permitted in Erie County in 2024 (563 in 5+ unit buildings).
- This rent runs 36% of the median local income ($102k/yr) — at the standard rent-burdened threshold; future hikes will face affordability resistance.
Forward outlook
- Local home prices are declining (-3.0%/yr); year-one equity from $2k of loan paydown is wiped out by about $9k of value loss. Plan a longer hold.
Negotiation context
- Only 7 days on market — expect competitive offers; lowballing is unlikely to land.
Questions for the listing agent
- Built in 1963 — when were the roof, HVAC, electrical panel, plumbing, and water heater last replaced?
- Is there a deadline driving the sale (1031 exchange, divorce, estate, relocation)? That informs how much negotiation room exists.
- Schools are A-rated — typically a magnet for longer-tenancy family renters. What's the average tenant stay here, and is there a school-zone premium baked into asking?
- What's the average days-on-market for RENTAL listings here right now (not sales)? A rising rental-DOM trend means longer vacancies and softer asking-rent achievability than the comps imply.
- What's the recent tenant-quality profile in this submarket — average credit score on applications, eviction rate, late-payment / NSF rate, and stable-employment percentage? A property-management company in the area should have these aggregated.
- How much new for-sale + rental construction is in the pipeline within 1–3 miles? Heavy new supply typically softens prices + rents 12–24 months out; constrained supply supports both.
Investment metrics
- 1% rule
- 1.02% ✓
- Cap rate
- 7.10%
- Cash-on-cash
- 2.87%
- DSCR
- 1.13
- GRM
- 8.2
CMA / ARV
- ARV (on-the-fly)
- $360,808
- Comps found
- 12
Show comp detail 12 sales within ~0.75 mi
| Address | Dist | Beds/Ba | Sqft | Sold | Price | $/sf | Match |
|---|---|---|---|---|---|---|---|
| 291 W Klein Rd | 0.12mi | 3/2.5 (-1) | 1,517 (+0%) | 10mo | $385,000 | $254 | 77 |
| 162 Red Oak Dr | 0.30mi | 3/1.5 (-1) | 1,556 (+3%) | 5mo | $315,900 | $203 | 72 |
| 88 W Klein Rd | 0.57mi | 4/1.5 | 1,504 (-1%) | 5mo | $390,000 | $259 | 68 |
| 215 Cottonwood Dr | 0.29mi | 3/1.5 (-1) | 1,563 (+3%) | 19mo | $420,000 | $269 | 60 |
| 257 Clearfield Dr | 0.24mi | 3/2.0 (-1) | 1,586 (+5%) | 18mo | $397,500 | $251 | 59 |
| 137 Redwood | 0.40mi | 3/2.5 (-1) | 1,637 (+8%) | 13mo | $390,000 | $238 | 48 |
| 55 Clearfield Dr | 0.67mi | 3/1.5 (-1) | 1,352 (-11%) | 6mo | $335,000 | $248 | 41 |
| 92 Clearfield Dr | 0.60mi | 3/1.5 (-1) | 1,628 (+7%) | 21mo | $380,000 | $233 | 37 |
| 175 Old Orchard Dr | 0.59mi | 3/1.5 (-1) | 1,686 (+11%) | 17mo | $365,000 | $216 | 35 |
| 148 Redwood Ter | 0.38mi | 3/1.0 (-1) | 1,305 (-14%) | 20mo | $255,000 | $195 | 35 |
| 1210 Maple Rd | 0.74mi | 3/2.0 (-1) | 1,378 (-9%) | 11mo | $275,000 | $200 | 34 |
| 124 Redwood | 0.43mi | 3/2.0 (-1) | 1,731 (+14%) | 22mo | $307,500 | $178 | 32 |
Match score weights: distance 35% · size 25% · config 20% · recency 20%. Top-matched comps best support the ARV.
Projected returns pro-forma
-3.0% appreciation · 5.01% rent growth · sell at horizon
- IRR
- -9.4%
- Equity multiple
- 0.65×
- Total profit
- $-29,335
- Equity at exit
- $44,656
- IRR
- 2.8%
- Equity multiple
- 1.22×
- Total profit
- $18,387
- Equity at exit
- $25,895
Cash invested: $83,860 (down + closing). Projections, not guarantees.
Landlord ↔ Tenant lean methodology
- Overall (STATE)
- 15 Strongly Tenant-Friendly
- State New York
- 15 Strongly Tenant-Friendly · D+10
- County
- — inherits STATE
- City
- — inherits STATE
ZIP-level market 14221
- Rents YoY
- 5.0%
- Active inventory
- 334
- Price-to-rent
- 8.2×
Monthly cashflow live
- Estimated rent
- $3,056 medium interval (Pro) →
- Mortgage (P&I)
- −$1,571
- Tax from tax record
- −$519 /mo · $6,225/yr
- Insurance
- −$125
- HOA
- −$0
- Vacancy / Maint / Mgmt
- −$642
- Net cashflow
- $200
Break-even live
Sensitivity live
| Price | -10% $370 | -5% $285 | +0% $200 | +5% $116 | +10% $31 |
|---|---|---|---|---|---|
| Rent | -10% $-41 | -5% $80 | +0% $200 | +5% $321 | +10% $442 |
| Rate | -1.0pp $351 | -0.5pp $276 | base $200 | +0.5pp $123 | +1.0pp $44 |
UW: 25.0% down · 7.5% · 30yr · 1.5% tax · 5.0% vac · 8.0% maint · 8.0% mgmt
Financing live
Cash to close
- Down payment
- $74,875
- Closing costs
- $8,985
- Reserves months
- —
- Total cash needed
- —
Loan-product check · same deal, 3 products live
Conventional
25% down · 7.5% · 30yr
- Down + closing
- —
- Monthly P&I
- —
- Monthly cashflow
- —
- DSCR
- —
- Eligible?
- —
Personal DTI + credit; lowest rate.
DSCR
20% down · 8.5% · 30yr
- Down + closing
- —
- Monthly P&I
- —
- Monthly cashflow
- —
- DSCR
- —
- Eligible?
- —
No personal income docs; deal must DSCR.
Hard money
10% down · 12.0% · 12mo
- Down + closing
- —
- Monthly P&I
- —
- Monthly cashflow
- —
- DSCR
- —
- Eligible?
- —
Short-term bridge; refi at stabilization.
Rent comps 3 comps
| Address | Beds | Baths | Sqft | Rent | $/sqft | DOM | Units | Dist |
|---|---|---|---|---|---|---|---|---|
| 116 Segsbury Rd Buffalo, NY | 3.0 | 2.0 | 1488 | $2,950 | $1.98 | 25d | 1 | 0.87mi |
| 1325 N Forest Rd Buffalo, NY | 1.0–3.0 | 1.0 | 870 | $2,095 | $2.41 | 0d | 9 | 1.03mi |
| 15 Telfair Dr Buffalo, NY | 4.0 | 2.5 | 1976 | $4,250 | $2.15 | 5d | 1 | 1.19mi |
Listing history 2 events
-
2026-04-23status Pending
-
2026-04-15$299,500 Active
ⓘ Source: listings_history table (triggers on properties + properties_extension) + one-shot
backfill from property_details.listing_events for pre-trigger history.
Tax reassessment forecast NY · Partial reset (capped growth)
- Current annual tax
- $6,225 · $519/mo
- Projected year-2 tax
- $6,225 · $519/mo
- Expected delta
- $0/yr ($0/mo · -0.0%)
ⓘ Screening estimate from a state-policy table — verify with the county assessor before closing.
Climate risk First Street
- Flood 1/10 Low FEMA zone X (unshaded) · 0% chance over 30 yrs
- Wildfire 1/10 Low
- Heat 2/10 Low 7 d/yr ≥94°F today · 15 d/yr by 30 yrs out
- Wind 1/10 Low
- Air quality 2/10 Low 2 unhealthy d/yr today · 2 by 30 yrs out
Nearby sold comps map
Loading sold comps map…
Walkable amenities ~0.75 mi
Loading nearby amenities…
Taxation est. · year 1
- Rental income
- $36,676
- − Mortgage interest
- −$16,777
- − Property taxes
- −$6,225
- − Insurance
- −$1,498
- − Repairs & maintenance
- −$2,934
- − Management
- −$2,934
- − Depreciation
- −$8,713
- Taxable loss
- −$2,405
- Est. tax savings @ 24.0%
- +$577
- After-tax cash flow
- $2,981/yr
For passive investors: Depreciation is non-cash, so a rental often shows a tax loss while cash-flowing — sheltering income. Rental losses are passive: they offset passive income freely, and up to $25,000/yr can offset ordinary (W-2) income if you actively participate and your MAGI is under $100k (phasing out to $0 by $150k); unused losses carry forward. On sale, claimed depreciation is recaptured at up to 25%, and gains may owe capital-gains tax (a 1031 exchange can defer both). Figures are a year-1 estimate at your 24.0% rate — not tax advice; consult a CPA.
Schools (NCES district)
- District
- Williamsville Central School District
- NCES district ID
- 3631470
- Math proficiency
- 64% ▼ -14.00%
- Reading proficiency
- 77% ▲ 6.00%
- Median HH income
- $79,907
- Composite
- 62.59/100
- National rank
- #678
- State rank
- #114 of 590 in NY
Livability — University at Buffalo
- Score
- 88/100
- State rank
- #9
- US rank
- #176
Category grades
Schools grade is shown separately in the Schools card above.
Census & demographics
- County
- Erie County · 714,559 people
- City population
- 5,827
- Metro
- Buffalo-Cheektowaga, NY
- Population (ZIP)
- 55,255
- Household income
- $101,615
- Rent vs Own
- Severe rent burden
- 1956.0
Population outlook (Erie County) Hauer SSP2
- Today (2025)
- 933,037 people
- By 2030
- 935,181 · +0.2%
- By 2040
- 928,531 · -0.5%
- By 2050
- 905,725 · -2.9%
- By 2075
- 834,037 · -10.6%
- By 2100
- 708,033 · -24.1%
Race, ethnicity, and origin ACS 2023
- Neighborhood character
- Predominantly White (84%)
- Race & ethnicity
- White 84% Asian 8% Two or more races 4% Hispanic / Latino 3% Black 2%
- Common ancestry
- Romanian 15% Lithuanian 2% Slovak 2%
- Foreign-born
- 10% · Canada, China, South Korea
- Languages at home
- 88% English-only · Other Indo-European 3% Other Asian/Pacific 2% Spanish 2%
Political lean MEDSL · Erie
- 2024 margin
- Lean D (+9.7) · D 54.8% · R 45.2%
- 2008→2024 swing
- -7.9pp toward R · 2008: 17.5pp · 2024: 9.7pp
- All cycles
- 2024: D+9.7 2020: D+14.7 2016: D+4.8 2012: D+15.6 2008: D+17.5
Not yet ingested
- Civics
- —
Market trends
- HPI YoY
- ▼ -301.37%
- Current HPI
- 322.6947
- Rent YoY
- ▲ 5.01%
- Metro
- Buffalo-Cheektowaga, NY
- State GDP YoY
- ▲ 2.60%
- F500 in state
- 92
Industry mix (Fortune 500 HQ in NY)
| Industry | F500 HQs | Revenue |
|---|---|---|
| Financial Services | 10 | $950B |
|
||
| Consumer Goods | 9 | $162B |
|
||
| Insurance | 4 | $225B |
|
||
| Telecommunications | 2 | $144B |
|
||
| Pharmaceuticals | 2 | $112B |
|
||
| Media / Entertainment | 2 | $69B |
|
||
Price history
2 events — show timeline
- 2026-04-23 Pending — WNYREIS
- 2026-04-15 Listed $299,500 WNYREIS
Property tax history
+4.4%/yrLatest (2025): $6,225 · +1.7% YoY. Source: county tax records.
Cash-flow waterfall
monthlySold comps — $/sqft
last 12 mo · ≤1 miLoading sold comps…