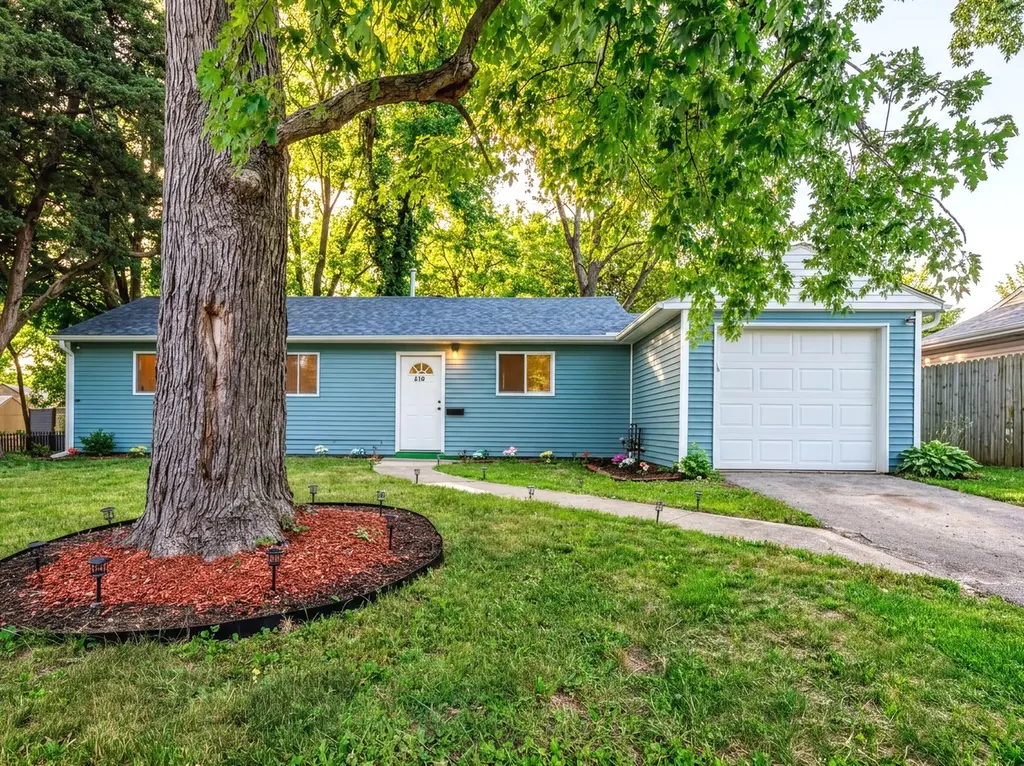
210 Mantua St · Park Forest, IL
Flood risk 1/10 · Minimal
- FEMA flood zone
- X (unshaded)
- Chance of flooding over 30 yrs
- 0.0%
- Est. flood insurance / yr
- $473 – $860
Fire risk 1/10 · Minimal
- Est. fire insurance / yr
- $804 – $1,492
Heat risk 3/10 · Minor
- Hot days now (above 101°F)
- 7 days/yr
- Hot days in 30 yrs
- 16 days/yr
Wind risk 2/10 · Minimal
- Chance of severe wind over 30 yrs
- —
Air-quality risk 2/10 · Minimal
- Unhealthy air days now
- 1 days/yr
- Unhealthy air days in 30 yrs
- 1 days/yr
Risk factors via First Street. Map © Google.
Why this score? — see what drove the C- grade
The composite is a weighted blend of 9 inputs, each scored 0–100. Each bar is that input's sub-score; the figure is the points it added to the 100-point composite (weight × sub-score).
- Cash flow +26.1/30.0
- DSCR +8.8/10.0
- 1% rule +6.9/10.0
- Livability +3.9/5.0
- Rent growth +2.5/5.0
- Condition / age +2.5/5.0
- Schools +0.9/10.0
- ARV discount +0.0/15.0
- Appreciation +0.0/10.0
$175,000
🖨 Deal sheet (PDF) 📄 Offer letter ✓ Due diligence
Listing remarks
Turnkey investment opportunity with immediate cash flow! This fully rehabbed, tenant-occupied rental property is an excellent addition to any investment portfolio and offers income from day one. Recent major improvements include a NEW roof (2026), NEW vinyl siding (2026), NEW windows (2025), NEW water boiler (2025), NEW AC (2025), along with numerous additional updates that help minimize maintenance expenses and future capital expenditures. This income-producing property is ideal for both seasoned investors and first-time investors seeking a buy-and-hold rental with strong long-term potential. The home features a functional layout, attractive curb appeal, and is located in an established re
Key facts
- Garage
- Built 1952
- Listed 11 days
Neighborhood map
What this means for you Summary
Snapshot
- This is a 3-bed/1.0-bath single-family listed at $175k.
Deal economics
- At list price, monthly cash flow is $440 ($5k/yr) — positive.
- The deal already cash-flows at list — no discount required.
- Meets the 1% rule at list price ($2k rent vs $175k).
Location & tenants
- Location reads 78/100 on livability (#148 in IL, #2,726 nationally) — a middle-class / working-renter tenant base. Strengths: commute A+, cost of living A+, housing A+; Watch: amenities F.
- Rich Twp Hsd 227 (suburban): math 5% / reading 12% proficiency, ranked #577 of 620 in IL (top 93%) — low school quality limits family demand, transient renter base, plan for 1-2y turnover.
- Zoned schools: Michelle Obama Sch of Technology (484 students, 0% FRL).
- Market conditions: 106 active listings in the ZIP; 11 comparable units currently listed for rent nearby; rentals leasing fast (median 5d on market — plan ~1-2 weeks tenant-placement turnaround); 6,272 units permitted in Cook County in 2024 (4,658 in 5+ unit buildings).
- This rent runs 41% of the median local income ($62k/yr) — at the standard rent-burdened threshold; future hikes will face affordability resistance.
Forward outlook
- Local home prices are declining (-3.0%/yr); year-one equity from $1k of loan paydown is wiped out by about $5k of value loss. Plan a longer hold.
Negotiation context
- Only 11 days on market — expect competitive offers; lowballing is unlikely to land.
- 3 sale attempts since 3y ago; this cycle's ask is 212% above the opening price — seller raised mid-cycle; expect resistance to lowballs.
- Current owner paid $30k; list at $175k implies a 483% gain — meaningful room to come down on a strong offer.
Risks & watch-outs
- Watch-outs: built in 1952 — expect roof / HVAC / electrical / plumbing capex.
Questions for the listing agent
- Built in 1952 — when were the roof, HVAC, electrical panel, plumbing, and water heater last replaced?
- Is there a deadline driving the sale (1031 exchange, divorce, estate, relocation)? That informs how much negotiation room exists.
- Schools are D-rated, which usually means shorter tenancies and higher turnover. Who's the typical renter profile here, and what's been the actual vacancy rate?
- What's the average days-on-market for RENTAL listings here right now (not sales)? A rising rental-DOM trend means longer vacancies and softer asking-rent achievability than the comps imply.
- What's the recent tenant-quality profile in this submarket — average credit score on applications, eviction rate, late-payment / NSF rate, and stable-employment percentage? A property-management company in the area should have these aggregated.
- How much new for-sale + rental construction is in the pipeline within 1–3 miles? Heavy new supply typically softens prices + rents 12–24 months out; constrained supply supports both.
Investment metrics
- 1% rule
- 1.19% ✓
- Cap rate
- 9.31%
- Cash-on-cash
- 10.78%
- DSCR
- 1.48
- GRM
- 7.0
CMA / ARV
- ARV (on-the-fly)
- $141,997
- Comps found
- 12
Show comp detail 12 sales within ~0.75 mi
| Address | Dist | Beds/Ba | Sqft | Sold | Price | $/sf | Match |
|---|---|---|---|---|---|---|---|
| 209 Miami St | 0.08mi | 2/1.0 (-1) | 974 (+2%) | 1mo | $108,000 | $111 | 87 |
| 310 Nassau St | 0.41mi | 3/1.0 | 953 (0%) | 1mo | $129,000 | $135 | 80 |
| 316 Mohawk St | 0.43mi | 2/1.0 (-1) | 949 (-0%) | 2mo | $141,000 | $149 | 73 |
| 254 Blackhawk Dr | 0.28mi | 2/1.0 (-1) | 1,000 (+5%) | 2mo | $105,000 | $105 | 72 |
| 318 Minocqua St | 0.47mi | 2/1.0 (-1) | 974 (+2%) | 1mo | $145,000 | $149 | 69 |
| 314 Seminole St | 0.55mi | 2/1.0 (-1) | 949 (-0%) | 1mo | $135,000 | $142 | 68 |
| 429 Natoma St | 0.39mi | 3/1.0 | 1,035 (+9%) | 1mo | $159,000 | $154 | 67 |
| 223 S Orchard Dr | 0.61mi | 2/1.0 (-1) | 949 (-0%) | 0mo | $105,000 | $111 | 66 |
| 354 Marquette St | 0.64mi | 2/1.0 (-1) | 973 (+2%) | 2mo | $131,000 | $135 | 60 |
| 425 Neosho St | 0.37mi | 3/1.0 | 1,092 (+15%) | 1mo | $169,900 | $156 | 58 |
| 434 Shabbona Dr | 0.46mi | 3/1.0 | 1,092 (+15%) | 0mo | $177,900 | $163 | 54 |
| 181 Nanti St | 0.55mi | 3/1.0 | 1,092 (+15%) | 1mo | $179,999 | $165 | 49 |
Match score weights: distance 35% · size 25% · config 20% · recency 20%. Top-matched comps best support the ARV.
Projected returns pro-forma
-3.0% appreciation · 3.0% rent growth · sell at horizon
- IRR
- -0.2%
- Equity multiple
- 0.99×
- Total profit
- $-292
- Equity at exit
- $26,093
- IRR
- 9.5%
- Equity multiple
- 1.73×
- Total profit
- $35,973
- Equity at exit
- $15,131
Cash invested: $49,000 (down + closing). Projections, not guarantees.
Landlord ↔ Tenant lean methodology
- Overall (STATE)
- 43 Moderately Tenant-Leaning
- State Illinois
- 43 Moderately Tenant-Leaning · D+7
- County
- — inherits STATE
- City
- — inherits STATE
ZIP-level market 60466
- Home prices YoY
- -21.1%
- Active inventory
- 106
- Price-to-rent
- 7.0×
Monthly cashflow live
- Estimated rent
- $2,088 high interval (Pro) →
- Mortgage (P&I)
- −$918
- Tax est. 1.5%
- −$219 /mo · $2,625/yr
- Insurance
- −$73
- HOA
- −$0
- Vacancy / Maint / Mgmt
- −$438
- Net cashflow
- $440
Break-even live
Sensitivity live
| Price | -10% $561 | -5% $501 | +0% $440 | +5% $380 | +10% $319 |
|---|---|---|---|---|---|
| Rent | -10% $275 | -5% $358 | +0% $440 | +5% $523 | +10% $605 |
| Rate | -1.0pp $528 | -0.5pp $485 | base $440 | +0.5pp $395 | +1.0pp $349 |
UW: 25.0% down · 7.5% · 30yr · 1.5% tax · 5.0% vac · 8.0% maint · 8.0% mgmt
Financing live
Cash to close
- Down payment
- $43,750
- Closing costs
- $5,250
- Reserves months
- —
- Total cash needed
- —
Loan-product check · same deal, 3 products live
Conventional
25% down · 7.5% · 30yr
- Down + closing
- —
- Monthly P&I
- —
- Monthly cashflow
- —
- DSCR
- —
- Eligible?
- —
Personal DTI + credit; lowest rate.
DSCR
20% down · 8.5% · 30yr
- Down + closing
- —
- Monthly P&I
- —
- Monthly cashflow
- —
- DSCR
- —
- Eligible?
- —
No personal income docs; deal must DSCR.
Hard money
10% down · 12.0% · 12mo
- Down + closing
- —
- Monthly P&I
- —
- Monthly cashflow
- —
- DSCR
- —
- Eligible?
- —
Short-term bridge; refi at stabilization.
Rent comps 11 comps
| Address | Beds | Baths | Sqft | Rent | $/sqft | DOM | Units | Dist |
|---|---|---|---|---|---|---|---|---|
| 411 Huron St Park Forest, IL | 3.0 | 1.0 | 1092 | $2,200 | $2.01 | 1d | 1 | 0.22mi |
| 277 Somonauk St Park Forest, IL | 3.0 | 1.0 | 966 | $2,000 | $2.07 | 5d | 1 | 0.44mi |
| 194 Monee Rd Park Forest, IL | 3.0 | 1.0 | 1092 | $1,971 | $1.80 | 23d | 1 | 0.59mi |
| 235 Tampa St Park Forest, IL | 3.0 | 1.0 | 1092 | $2,000 | $1.83 | 26d | 1 | 0.72mi |
| 3324 Western Ave Park Forest, IL | 1.0–3.0 | 1.0 | 1026 | $1,995 | $1.94 | 0d | 11 | 1.03mi |
| 23439 Western Ave Unit C29 Park Forest, IL | 2.0 | 2.0 | 975 | $1,570 | $1.61 | 0d | 1 | 1.07mi |
| 11 Fir St Park Forest, IL | 1.0–3.0 | 1.0 | 1026 | $2,069 | $2.02 | 0d | 1 | 1.10mi |
| 3905 Tower Dr Richton Park, IL | 1.0–2.0 | 1.0–2.0 | 905 | $1,795 | $1.98 | 0d | 19 | 1.35mi |
| 4014 Euclid Ln Richton Park, IL | 2.0 | 1.0 | 1100 | $2,100 | $1.91 | 9d | 1 | 1.44mi |
| 4014 Euclid Ln Richton Park, IL | 3.0 | 1.0 | 1100 | $2,100 | $1.91 | 14d | 1 | 1.44mi |
| 4014 Euclid Ln Richton Park, IL | 2.0 | 1.0 | 1100 | $2,100 | $1.91 | 23d | 1 | 1.44mi |
Listing history 9 events
-
2026-06-21days on market $175,000 Active 11 DOM
-
2026-06-18days on market $175,000 Active 8 DOM
-
2026-06-17days on market $175,000 Active 7 DOM
-
2026-06-16days on market $175,000 Active 6 DOM
-
2026-06-15days on market $175,000 Active 5 DOM
-
2026-06-13remarks 699-char remark
-
2026-06-13status $175,000 Active 3 DOM
-
2026-06-09days on market $175,000 Active (Private) 3 DOM
-
2026-06-08$175,000 Active (Private) 2 DOM
ⓘ Source: listings_history table (triggers on properties + properties_extension) + one-shot
backfill from property_details.listing_events for pre-trigger history.
Climate risk First Street
- Flood 1/10 Low FEMA zone X (unshaded) · 0% chance over 30 yrs
- Wildfire 1/10 Low
- Heat 3/10 Moderate 7 d/yr ≥101°F today · 16 d/yr by 30 yrs out
- Wind 2/10 Low
- Air quality 2/10 Low 1 unhealthy d/yr today · 1 by 30 yrs out
Nearby sold comps map
Loading sold comps map…
Walkable amenities ~0.75 mi
Loading nearby amenities…
Taxation est. · year 1
- Rental income
- $25,056
- − Mortgage interest
- −$9,803
- − Property taxes
- −$2,625
- − Insurance
- −$875
- − Repairs & maintenance
- −$2,005
- − Management
- −$2,005
- − Depreciation
- −$5,091
- Taxable income
- $2,654
- Est. tax owed @ 24.0%
- −$637
- After-tax cash flow
- $4,645/yr
For passive investors: Depreciation is non-cash, so a rental often shows a tax loss while cash-flowing — sheltering income. Rental losses are passive: they offset passive income freely, and up to $25,000/yr can offset ordinary (W-2) income if you actively participate and your MAGI is under $100k (phasing out to $0 by $150k); unused losses carry forward. On sale, claimed depreciation is recaptured at up to 25%, and gains may owe capital-gains tax (a 1031 exchange can defer both). Figures are a year-1 estimate at your 24.0% rate — not tax advice; consult a CPA.
Schools (NCES district)
- District
- Rich Twp Hsd 227
- NCES district ID
- 1733420
- Math proficiency
- 5% ▼ -3.00%
- Reading proficiency
- 12% ▬ 0.00%
- Median HH income
- $56,056
- Composite
- 8.93/100
- National rank
- #9885
- State rank
- #577 of 620 in IL
Livability — Park Forest
- Score
- 78/100
- State rank
- #148
- US rank
- #2726
Category grades
Schools grade is shown separately in the Schools card above.
Census & demographics
- Census place
- Park Forest, IL
- County
- Cook County · 4,486,803 people
- City population
- 21,461
- Metro
- Chicago-Naperville-Elgin, IL-IN-WI
- Population (ZIP)
- 21,461
- Household income
- $61,654
- Rent vs Own
- Severe rent burden
- 900.0
Population outlook (Cook County) Hauer SSP2
- Today (2025)
- 5,347,519 people
- By 2030
- 5,357,703 · +0.2%
- By 2040
- 5,324,924 · -0.4%
- By 2050
- 5,230,762 · -2.2%
- By 2075
- 4,785,735 · -10.5%
- By 2100
- 4,188,836 · -21.7%
Race, ethnicity, and origin ACS 2023
- Neighborhood character
- Predominantly Black (69%)
- Race & ethnicity
- Black 69% White 19% Hispanic / Latino 9% Two or more races 3% Native American 1%
- Hispanic origin (detail)
- Mexican 8%
- Common ancestry
- Romanian 2% Iranian 1% Italian 1%
- Foreign-born
- 6% · Canada
- Languages at home
- 90% English-only · Spanish 7% French/Haitian/Cajun 1% Russian/Polish/Slavic 1%
Political lean MEDSL · Cook
- 2024 margin
- Solid D (+42.0) · D 70.4% · R 28.4% · Other 1.2%
- 2008→2024 swing
- -11.4pp toward R · 2008: 53.4pp · 2024: 42.0pp
- All cycles
- 2024: D+42.0 2020: D+50.3 2016: D+53.0 2012: D+49.4 2008: D+53.4
Not yet ingested
- Civics
- —
Market trends
- HPI YoY
- ▼ -58.87%
- Current HPI
- 219.9692
- Rent YoY
- —
- Metro
- Chicago-Naperville-Elgin, IL-IN-WI
- State GDP YoY
- ▲ 1.59%
- F500 in state
- 60
Industry mix (Fortune 500 HQ in IL)
| Industry | F500 HQs | Revenue |
|---|---|---|
| Insurance | 4 | $201B |
|
||
| Consumer Goods | 4 | $87B |
|
||
| Industrial Machinery | 3 | $64B |
|
||
| Healthcare | 2 | $55B |
|
||
| Retail / Pharmacy | 1 | $148B |
|
||
| Agriculture / Food | 1 | $86B |
|
||
Price history
-29.4% since first listed18 events — show timeline
- 2026-01-29 Listing Removed — MRED as Distributed by MLS Grid
- 2026-01-16 Price Changed — MRED as Distributed by MLS Grid
- 2025-12-23 Price Changed — MRED as Distributed by MLS Grid
- 2025-12-01 Price Changed — MRED as Distributed by MLS Grid
- 2025-11-24 Price Changed — MRED as Distributed by MLS Grid
- 2025-11-19 Listed — MRED as Distributed by MLS Grid
- 2025-11-17 Listing Removed — MRED as Distributed by MLS Grid
- 2025-11-10 Price Changed — MRED as Distributed by MLS Grid
- 2025-11-05 Price Changed — MRED as Distributed by MLS Grid
- 2025-10-28 Price Changed — MRED as Distributed by MLS Grid
- 2025-10-22 Listed — MRED as Distributed by MLS Grid
- 2024-04-03 Sold (MLS) $30,000 MRED as Distributed by MLS Grid
- 2024-03-01 Pending — MRED as Distributed by MLS Grid
- 2024-02-01 Price Changed $37,900 MRED as Distributed by MLS Grid
- 2023-12-02 Price Changed $49,500 MRED as Distributed by MLS Grid
- 2023-11-13 Listed $56,000 MRED as Distributed by MLS Grid
- 1986-07-21 Sold (Public Records) $44,000 Public Records
- 1979-07-24 Sold (Public Records) $42,500 Public Records
Property tax history
+7.2%/yrLatest (2023): $9,516 · +92.5% YoY. Source: county tax records.
Cash-flow waterfall
monthlySold comps — $/sqft
last 12 mo · ≤1 miLoading sold comps…