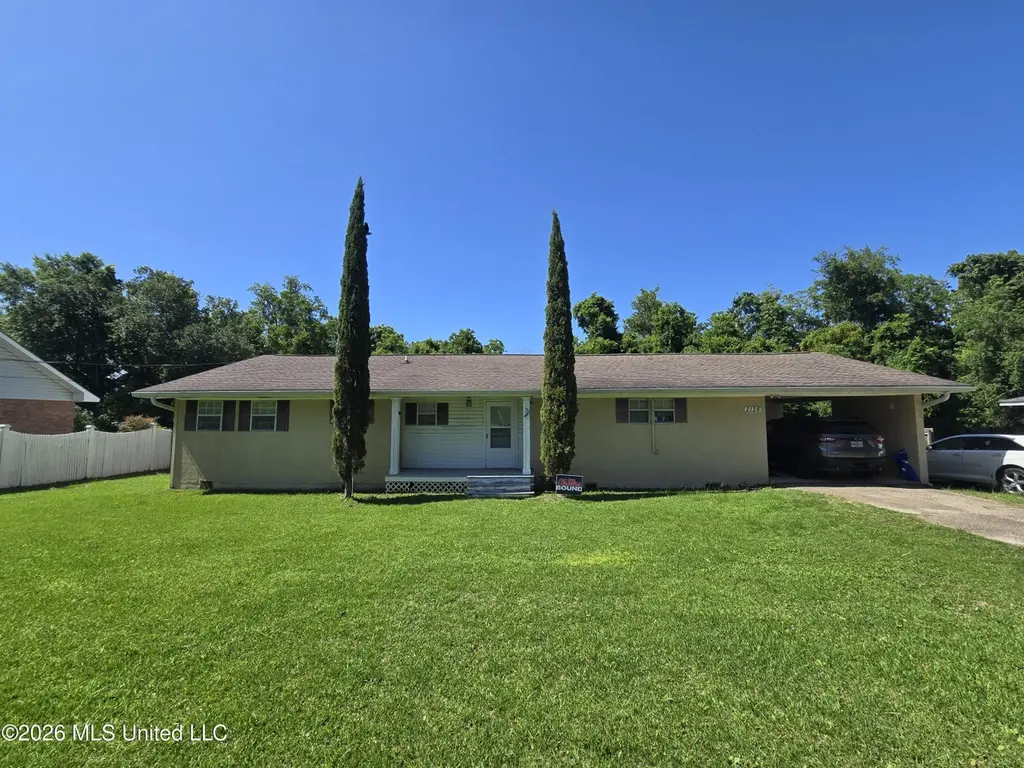
2128 Ames St · Biloxi, MS
Flood risk 5/10 · Moderate
- FEMA flood zone
- X (unshaded)
- Chance of flooding over 30 yrs
- 0.66%
- Est. flood insurance / yr
- $507 – $1,088
Fire risk 1/10 · Minimal
- Est. fire insurance / yr
- $1,241 – $2,305
Heat risk 10/10 · Severe
- Hot days now (above 106°F)
- 7 days/yr
- Hot days in 30 yrs
- 22 days/yr
Wind risk 9/10 · Severe
- Chance of severe wind over 30 yrs
- 99.0%
Air-quality risk 3/10 · Minor
- Unhealthy air days now
- 2 days/yr
- Unhealthy air days in 30 yrs
- 3 days/yr
Risk factors via First Street. Map © Google.
Why this score? — see what drove the C+ grade
The composite is a weighted blend of 9 inputs, each scored 0–100. Each bar is that input's sub-score; the figure is the points it added to the 100-point composite (weight × sub-score).
- Cash flow +20.7/30.0
- ARV discount +15.0/15.0
- DSCR +6.6/10.0
- 1% rule +4.5/10.0
- Schools +4.5/10.0
- Livability +4.0/5.0
- Rent growth +2.5/5.0
- Condition / age +2.5/5.0
- Appreciation +0.0/10.0
$189,000
🖨 Deal sheet 📄 Offer letter ✓ Due diligence
Listing remarks
Opportunity is knocking in one of Biloxi's most desirable locations! This fixer-upper is full of potential and ready for someone with vision to bring it back to life. Whether you are an investor, renovator, or buyer looking to create your dream home. Located in the highly rated Biloxi Public School District. Enjoy the convenience of being just minutes from Hwy 90, the beach, shopping, dining, entertainment, and a quick drive to I-10, making commutes across the Coast simple and convenient. With the right updates, this home could truly shine. Great location, strong school district, and endless potential — this is one you do not want to miss! This is being sold as-is.
Key facts
- Quick drive to i-10
- Minutes from hwy 90
- 0.34 acre lot
Tags
Property features AI
Finance
- Other: Lot approximately 0.34 acres (about 100 x 150 feet)
Exterior
- Parking: 1-car carport; Driveway
- Utilities: Public water; Public sewer; Electricity connected; Water connected
- Home design: Single-family house; One level; Shingle roof; Chainwall foundation
- Construction: Vinyl, brick, and stucco exterior; Built (year reported by assessor)
- Exterior features: Patio; Porch
Interior
- Kitchen: Dishwasher; Oven; Refrigerator
- Bathrooms: 2 full bathrooms
- Heating & cooling: Central electric heating; Central electric air conditioning
- Interior features: Fireplace in the living room; Fixer condition
- Laundry & utility: Water heater
Neighborhood map
What this means for you Summary
Snapshot
- This is a 3-bed/1.0-bath single-family listed at $189k.
Deal economics
- At list price, monthly cash flow is $254 ($3k/yr) — positive.
- The deal already cash-flows at list — no discount required.
- To meet the 1% rule (rent ≥ 1% of price), the offer needs to be $179k (5.1% below list).
- Recommended offer: $179k (5.1% below list) — sets the bar for 1% rule.
- Cap rate 7.9% vs local median 3.5% in Biloxi — top-decile yield for the area; either an underpriced asset or a hidden risk that comps aren't pricing in. Stress-test before assuming the spread holds.
Location & tenants
- Location reads 79/100 on livability (#6 in MS, #2,141 nationally) — a middle-class / working-renter tenant base. Strengths: crime A+, cost of living A+, housing A+; Watch: commute D+, amenities F, employment D-.
- Biloxi Public School District (urban): math 60% / reading 48% proficiency, ranked #7 of 130 in MS (top 5%) — acceptable for families but not a draw, mixed tenant base, ~2y average lease.
- Zoned schools: Popps Ferry Elementary School (math 53% / reading 58%, grade C, #40 of 375 statewide, top 11%, 552 students, 100% FRL); Biloxi Junior High (math 60% / reading 43%, grade C, #27 of 179 statewide, top 16%, 881 students, 100% FRL); Biloxi High School (math 65% / reading 53%, grade C+, #7 of 197 statewide, top 3%, 1,728 students, 100% FRL) — zoned schools average 100% FRL vs 59% district-wide (40 pts higher); higher-poverty schools than district average — tighter screening recommended.
- Market conditions: Rents flat; 201 active listings in the ZIP; 14 comparable units currently listed for rent nearby; rentals at typical pace (median 21d on market — plan ~3-4 weeks tenant-placement turnaround); 2,194 units permitted in Harrison County in 2024 (0 in 5+ unit buildings).
- This rent runs 40% of the median local income ($54k/yr) — at the standard rent-burdened threshold; future hikes will face affordability resistance.
Forward outlook
- Local home prices are declining (-3.0%/yr); year-one equity from $1k of loan paydown is wiped out by about $6k of value loss. Plan a longer hold.
- Harrison County population projected at +27% by 2050 — long-run rental-demand tailwind backs the buy-and-hold thesis.
Negotiation context
- It's been on market 18 days — a 2% lower offer ($186k) is reasonable based on typical stale-listing flexibility.
- 2 sale attempts since 18y ago; this cycle's ask has dropped $10k (5%) from the opening price — seller is motivated, your offer sets the floor, not the list.
Risks & watch-outs
- Watch-outs: built in 1940 — expect roof / HVAC / electrical / plumbing capex.
- Climate carrying-cost: moderate flood risk; severe wind risk, 99% chance of damaging wind over 30y; extreme-heat days projected 7→22/yr by 2055 (HVAC capex compounding) — expect insurance premiums to compound above CPI over the hold.
Questions for the listing agent
- Built in 1940 — when were the roof, HVAC, electrical panel, plumbing, and water heater last replaced?
- Is there a deadline driving the sale (1031 exchange, divorce, estate, relocation)? That informs how much negotiation room exists.
- What's the average days-on-market for RENTAL listings here right now (not sales)? A rising rental-DOM trend means longer vacancies and softer asking-rent achievability than the comps imply.
- What's the recent tenant-quality profile in this submarket — average credit score on applications, eviction rate, late-payment / NSF rate, and stable-employment percentage? A property-management company in the area should have these aggregated.
- How much new for-sale + rental construction is in the pipeline within 1–3 miles? Heavy new supply typically softens prices + rents 12–24 months out; constrained supply supports both.
Investment metrics
- 1% rule
- 0.95% ✗
- Cap rate
- 7.91%
- Cash-on-cash
- 5.77%
- DSCR
- 1.26
- GRM
- 8.8
CMA / ARV
- ARV (on-the-fly)
- $236,856
- Comps found
- 12
Show comp detail 12 sales within ~0.75 mi
| Address | Dist | Beds/Ba | Sqft | Sold | Price | $/sf | Match |
|---|---|---|---|---|---|---|---|
| 460 Venito Dr | 0.11mi | 3/2.0 | 1,750 (+3%) | 9mo | $320,000 | $183 | 79 |
| 383 Jim Money Rd | 0.18mi | 3/1.0 | 1,576 (-8%) | 5mo | $110,000 | $70 | 75 |
| 2105 Ward Ln | 0.23mi | 3/2.0 | 1,612 (-5%) | 2mo | $269,000 | $167 | 75 |
| 459 Jim Money Rd | 0.17mi | 3/2.0 | 1,636 (-4%) | 9mo | $254,900 | $156 | 74 |
| 2172 Atkinson Rd | 0.17mi | 3/2.0 | 1,746 (+2%) | 14mo | $226,989 | $130 | 72 |
| 2181 George Walton Dr | 0.18mi | 3/1.0 | 1,821 (+7%) | 12mo | $212,000 | $116 | 70 |
| 2131 Dwayne Dr | 0.32mi | 3/1.5 | 1,745 (+2%) | 15mo | $224,900 | $129 | 67 |
| 430 Tuscano Ln | 0.07mi | 3/2.0 | 1,824 (+7%) | 22mo | $315,000 | $173 | 63 |
| 349 Park Cir | 0.15mi | 3/2.5 | 1,906 (+12%) | 6mo | $219,999 | $115 | 62 |
| 333 Tanglewood Dr | 0.43mi | 3/2.0 | 1,688 (-1%) | 17mo | $169,900 | $101 | 60 |
| 335 Jim Money Rd | 0.41mi | 3/2.0 | 1,767 (+4%) | 16mo | $249,000 | $141 | 58 |
| 400 Woodland Park Dr | 0.25mi | 3/2.0 | 1,873 (+10%) | 14mo | $259,900 | $139 | 56 |
Match score weights: distance 35% · size 25% · config 20% · recency 20%. Top-matched comps best support the ARV.
Projected returns pro-forma
-3.0% appreciation · 0.05% rent growth · sell at horizon
- IRR
- -10.5%
- Equity multiple
- 0.63×
- Total profit
- $-19,659
- Equity at exit
- $28,181
- IRR
- -5.5%
- Equity multiple
- 0.69×
- Total profit
- $-16,511
- Equity at exit
- $16,341
Cash invested: $52,920 (down + closing). Projections, not guarantees.
Landlord ↔ Tenant lean methodology
- Overall (STATE)
- 90 Strongly Landlord-Friendly
- State Mississippi
- 90 Strongly Landlord-Friendly · R+11
- County
- — inherits STATE
- City
- — inherits STATE
ZIP-level market 39531
- Home prices YoY
- -13.0%
- Rents YoY
- 0.1%
- Active inventory
- 201
- Price-to-rent
- 8.8×
Monthly cashflow live
- Estimated rent
- $1,794 high interval (Pro) →
- Mortgage (P&I)
- −$991
- Tax from tax record
- −$93 /mo · $1,112/yr
- Insurance
- −$79
- HOA
- −$0
- Vacancy / Maint / Mgmt
- −$377
- Net cashflow
- $254
Break-even live
UW: 25.0% down · 7.5% · 30yr · 1.5% tax · 5.0% vac · 8.0% maint · 8.0% mgmt
Financing live
Cash to close
- Down payment
- $47,250
- Closing costs
- $5,670
- Reserves months
- —
- Total cash needed
- —
Loan-product check · same deal, 3 products live
Conventional
25% down · 7.5% · 30yr
- Down + closing
- —
- Monthly P&I
- —
- Monthly cashflow
- —
- DSCR
- —
- Eligible?
- —
Personal DTI + credit; lowest rate.
DSCR
20% down · 8.5% · 30yr
- Down + closing
- —
- Monthly P&I
- —
- Monthly cashflow
- —
- DSCR
- —
- Eligible?
- —
No personal income docs; deal must DSCR.
Hard money
10% down · 12.0% · 12mo
- Down + closing
- —
- Monthly P&I
- —
- Monthly cashflow
- —
- DSCR
- —
- Eligible?
- —
Short-term bridge; refi at stabilization.
Rent comps 14 comps
| Address | Beds | Baths | Sqft | Rent | $/sqft | DOM | Units | Dist |
|---|---|---|---|---|---|---|---|---|
| 2611 Heidi LN Biloxi, MS | 3.0 | 2.5 | 1550 | $1,775 | $1.15 | 21d | 1 | 0.53mi |
| 310 Abbey Ct Biloxi, MS | 2.0–3.0 | 1.0–2.0 | 1062 | $1,275 | $1.20 | 21d | 17 | 0.53mi |
| 390 Bertucci Blvd Biloxi, MS | 3.0 | 2.0 | 1358 | $1,800 | $1.33 | 43d | 1 | 0.73mi |
| 2386 Merlin Cv Biloxi, MS | 3.0 | 2.0 | 1500 | $1,600 | $1.07 | 13d | 1 | 0.76mi |
| 340 Hiller Dr Biloxi, MS | 3.0 | 2.0 | 1447 | $1,749 | $1.21 | 21d | 1 | 0.77mi |
| 2387 Trafalgar Dr Biloxi, MS | 3.0 | 2.0 | 1375 | $1,700 | $1.24 | 21d | 1 | 0.83mi |
| 495 Popps Ferry Rd #77 Biloxi, MS | 2.0 | 2.5 | 1524 | $2,000 | $1.31 | 21d | 1 | 0.86mi |
| 495 Popps Ferry Rd Biloxi, MS | 2.0 | 1.5–2.5 | 1455 | $1,850 | $1.27 | 43d | 2 | 0.87mi |
| 2046 Beach Blvd Biloxi, MS | 2.0 | 2.0 | 1152 | $2,200 | $1.91 | 21d | 1 | 1.15mi |
| 2508 Shady Ln Biloxi, MS | 3.0 | 2.0 | 1431 | $2,100 | $1.47 | 43d | 1 | 1.17mi |
| 2060 Beach Blvd #604 Biloxi, MS | 2.0 | 2.0 | 1670 | $2,849 | $1.71 | 13d | 1 | 1.29mi |
| 1737 James Buchanan Dr Biloxi, MS | 3.0 | 2.0 | 1328 | $1,650 | $1.24 | 43d | 1 | 1.35mi |
| 1805 Irish Hill Dr #4 Biloxi, MS | 3.0 | 2.0 | 1600 | $2,400 | $1.50 | 43d | 1 | 1.39mi |
| 258 Stennis Dr Biloxi, MS | 2.0 | 1.0–2.0 | 1040 | $1,245 | $1.20 | 13d | 1 | 1.47mi |
Listing history 15 events
-
2026-06-18days on market $189,000 Active 18 DOM
-
2026-06-17days on market $189,000 Active 17 DOM
-
2026-06-16days on market $189,000 Active 16 DOM
-
2026-06-15days on market $189,000 Active 15 DOM
-
2026-06-14days on market $189,000 Active 13 DOM
-
2026-06-13pricedays on market $189,000 Active 12 DOM
-
2026-06-09days on market $199,000 Active 9 DOM
-
2026-06-08days on market $199,000 Active 8 DOM
-
2026-06-07days on market $199,000 Active 7 DOM
-
2026-06-05days on market $199,000 Active 4 DOM
-
2026-06-03days on market $199,000 Active 3 DOM
-
2026-06-02days on market $199,000 Active 2 DOM
-
2026-06-01remarks 673-char remark
-
2026-06-01remarks 647-char remark
-
2026-06-01$199,000 Active 1 DOM
ⓘ Source: listings_history table (triggers on properties + properties_extension) + one-shot
backfill from property_details.listing_events for pre-trigger history.
Tax reassessment forecast MS · Resets to sale price
- Current annual tax
- $1,112 · $93/mo
- Projected year-2 tax
- $1,493 · $124/mo
- Expected delta
- +$382/yr (+$32/mo · 34.3%)
ⓘ Screening estimate from a state-policy table — verify with the county assessor before closing.
Climate risk First Street
- Flood 5/10 Major FEMA zone X (unshaded) · 66% chance over 30 yrs
- Wildfire 1/10 Low
- Heat 10/10 Extreme 7 d/yr ≥106°F today · 22 d/yr by 30 yrs out
- Wind 9/10 Extreme 99% chance of damaging wind over 30 yrs
- Air quality 3/10 Moderate 2 unhealthy d/yr today · 3 by 30 yrs out
Nearby sold comps map
Loading sold comps map…
Walkable amenities ~0.75 mi
Loading nearby amenities…
Taxation est. · year 1
- Rental income
- $21,522
- − Mortgage interest
- −$10,587
- − Property taxes
- −$1,112
- − Insurance
- −$945
- − Repairs & maintenance
- −$1,722
- − Management
- −$1,722
- − Depreciation
- −$5,498
- Taxable loss
- −$63
- Est. tax savings @ 24.0%
- +$15
- After-tax cash flow
- $3,067/yr
For passive investors: Depreciation is non-cash, so a rental often shows a tax loss while cash-flowing — sheltering income. Rental losses are passive: they offset passive income freely, and up to $25,000/yr can offset ordinary (W-2) income if you actively participate and your MAGI is under $100k (phasing out to $0 by $150k); unused losses carry forward. On sale, claimed depreciation is recaptured at up to 25%, and gains may owe capital-gains tax (a 1031 exchange can defer both). Figures are a year-1 estimate at your 24.0% rate — not tax advice; consult a CPA.
Schools (NCES district)
- District
- Biloxi Public School District
- NCES district ID
- 2800630
- Math proficiency
- 60% ▼ -7.00%
- Reading proficiency
- 48% ▼ -3.00%
- Median HH income
- $40,608
- Composite
- 45.26/100
- National rank
- #2657
- State rank
- #7 of 130 in MS
Livability — Biloxi
- Score
- 79/100
- State rank
- #6
- US rank
- #2141
Category grades
Schools grade is shown separately in the Schools card above.
Census & demographics
- Census place
- Biloxi, MS
- County
- Harrison County · 178,171 people
- City population
- 63,281
- Metro
- Gulfport-Biloxi, MS
- Population (ZIP)
- 18,918
- Household income
- $54,218
- Rent vs Own
- Severe rent burden
- 1110.0
Population outlook (Harrison County) Hauer SSP2
- Today (2025)
- 228,444 people
- By 2030
- 241,942 · +5.9%
- By 2040
- 267,531 · +17.1%
- By 2050
- 291,062 · +27.4%
- By 2075
- 346,711 · +51.8%
- By 2100
- 378,165 · +65.5%
Race, ethnicity, and origin ACS 2023
- Neighborhood character
- Diverse neighborhood (Simpson 0.60)
- Race & ethnicity
- White 60% Black 18% Two or more races 12% Hispanic / Latino 11% Asian 2%
- Hispanic origin (detail)
- Mexican 5%
- Common ancestry
- Lithuanian 6% Slovak 2% Serbian 1%
- Foreign-born
- 8% · Canada, Vietnam
- Languages at home
- 89% English-only · Spanish 6% Arabic 1% Other Indo-European 1%
Political lean MEDSL · Harrison
- 2024 margin
- Strong R (+28.9) · D 35.0% · R 63.9% · Other 1.1%
- 2008→2024 swing
- -2.9pp toward R · 2008: -26.0pp · 2024: -28.9pp
- All cycles
- 2024: R+28.9 2020: R+25.2 2016: R+30.7 2012: R+26.6 2008: R+26.0
Not yet ingested
- Civics
- —
Market trends
- HPI YoY
- ▼ -28.97%
- Current HPI
- 193.4018
- Rent YoY
- ▬ 0.05%
- Metro
- Gulfport-Biloxi, MS
- State GDP YoY
- —
- F500 in state
- 0
Price history
+73.2% since first listed5 events — show timeline
- 2026-05-31 Listed $199,000 MLSU
- 2020-06-19 Sold (Public Records) — Public Records
- 2008-06-18 Sold (Public Records) — Public Records
- 2008-06-11 Sold (MLS) — MLSU
- 2008-04-29 Listed $114,900 MLSU
Property tax history
-3.7%/yrLatest (2025): $1,112 · +8.6% YoY. Source: county tax records.
Cash-flow waterfall
monthlySold comps — $/sqft
last 12 mo · ≤1 miLoading sold comps…