32090 Ranch Rd · Homeland, CA
Flood risk 1/10 · Minimal
- FEMA flood zone
- X (unshaded)
- Chance of flooding over 30 yrs
- 0.0%
- Est. flood insurance / yr
- $507 – $1,088
Fire risk 8/10 · Major
- Est. fire insurance / yr
- $659 – $1,223
Heat risk 7/10 · Major
- Hot days now (above 103°F)
- 7 days/yr
- Hot days in 30 yrs
- 20 days/yr
Wind risk 1/10 · Minimal
- Chance of severe wind over 30 yrs
- —
Air-quality risk 6/10 · Moderate
- Unhealthy air days now
- 10 days/yr
- Unhealthy air days in 30 yrs
- 14 days/yr
Risk factors via First Street. Map © Google.
Why this score? — see what drove the F grade
The composite is a weighted blend of 9 inputs, each scored 0–100. Each bar is that input's sub-score; the figure is the points it added to the 100-point composite (weight × sub-score).
- Appreciation +10.0/10.0
- ARV discount +7.5/15.0
- Cash flow +4.7/30.0
- Schools +3.7/10.0
- Rent growth +2.5/5.0
- Condition / age +2.5/5.0
- Livability +2.2/5.0
- 1% rule +0.0/10.0
- DSCR +0.0/10.0
$449,500
🖨 Deal sheet (PDF) 📄 Offer letter ✓ Due diligence
Listing remarks MLS
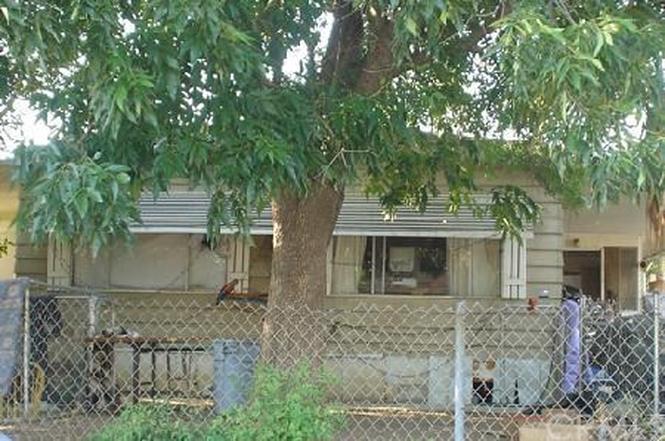
GREAT OPPORTUNITY!!! FIXER UPPER!!! BEAUTIFUL MOUNTAIN VIEWS. STARTER HOME TO FIX UP, OR CAN REMOVE AND PUT ON A NEW HOME! . 21 ACRES LOCATED IN QUIET CUL-DE-SAC. LOW TAX AREA.
Key facts
- Remodeled showers
- New window screens
- Central a/c
Tags
Property features AI
Exterior
- Parking: Attached garage; Two garage spaces (two parking spaces total)
- Utilities: Public water district service; Sewer or septic (unknown)
- Home design: Single-story; No shared/common walls; No accessory dwelling unit
- Construction: Certified 433a foundation
- Exterior features: Manufactured home; No pool; Lot roughly 0–1 unit per acre; Curbs
Interior
- Bedrooms: Five bedrooms on the main level
- Bathrooms: Two full bathrooms on the main level
- Heating & cooling: Central heating (furnace); Central air conditioning
- Interior features: One-level layout; All bedrooms on the main level; Main-level entry
- Laundry & utility: Washer hookup; Gas dryer hookup
Neighborhood map
What this means for you Summary
Snapshot
- This is a 2-bed/2.0-bath manufactured listed at $450k.
Deal economics
- At list price, monthly cash flow is $-1k ($-13k/yr) — negative.
- To cash-flow at today's rent, offer at most $252k (43.8% below list).
- To meet the 1% rule (rent ≥ 1% of price), the offer needs to be $204k (54.7% below list).
- Recommended offer: $204k (54.7% below list) — sets the bar for 1% rule.
- Cap rate 3.3% vs local median 5.9% in Homeland — below-typical yield; the buyer is paying a premium for something (appreciation thesis, condition, location) that the cap rate doesn't capture.
Location & tenants
- Location reads 45/100 on livability (#1,297 in CA) — a working-class tenant base; expect higher turnover. Strengths: housing A+; Watch: cost of living C-, health & safety C-, employment D.
- Romoland Elementary (suburban): math 35% / reading 44% proficiency, ranked #699 of 1,400 in CA (top 50%) — families likely to look elsewhere, expect single-tenant / working-renter base with shorter leases.
- Market conditions: 53 active listings in the ZIP; 9,195 units permitted in Riverside County in 2024 (1,512 in 5+ unit buildings).
Forward outlook
- In year one you build about $48k of equity ($3k loan paydown + $45k appreciation (10.0% local appreciation)).
- Riverside County population projected at +22% by 2050 — long-run rental-demand tailwind backs the buy-and-hold thesis.
- By year 2, paydown + projected appreciation supports a ~$77k cash-out refi (75% LTV) — recoverable capital for the next deal without selling this one.
Negotiation context
- It's been on market 190 days — a 12% lower offer ($396k) is reasonable based on typical stale-listing flexibility.
- 22 sale attempts since 20y ago; this cycle's ask is 15982% above the opening price — seller raised mid-cycle; expect resistance to lowballs.
- Current owner paid $85k; list at $450k implies a 429% gain — meaningful room to come down on a strong offer.
Risks & watch-outs
- Climate carrying-cost: severe wildfire risk; extreme-heat days projected 7→20/yr by 2055 (HVAC capex compounding) — expect insurance premiums to compound above CPI over the hold.
Questions for the listing agent
- What do current leases actually rent for vs. the listed asking? Can we see a recent rent roll and the last 12 months of T-12 income?
- It's been on market 190 days. Have you received any prior offers? Is the seller open to a 55% concession, seller financing, or rate buy-down credit?
- Why hasn't it sold? Are there any deal-killer items the seller is aware of (foundation, flood, title, zoning, code violations)?
- Is there a deadline driving the sale (1031 exchange, divorce, estate, relocation)? That informs how much negotiation room exists.
- Schools are F-rated, which usually means shorter tenancies and higher turnover. Who's the typical renter profile here, and what's been the actual vacancy rate?
- Crime grade is F in this area — have there been break-ins, vandalism, or insurance claims at this property in the last 3 years? What carrier currently insures it and at what premium?
- The area grade is low — what's the realistic commute time and amenity access for the typical tenant pool here? Any planned neighborhood developments (good or bad) we should know about?
- What's the average days-on-market for RENTAL listings here right now (not sales)? A rising rental-DOM trend means longer vacancies and softer asking-rent achievability than the comps imply.
- What's the recent tenant-quality profile in this submarket — average credit score on applications, eviction rate, late-payment / NSF rate, and stable-employment percentage? A property-management company in the area should have these aggregated.
- How much new for-sale + rental construction is in the pipeline within 1–3 miles? Heavy new supply typically softens prices + rents 12–24 months out; constrained supply supports both.
Investment metrics
- 1% rule
- 0.45% ✗
- Cap rate
- 3.32%
- Cash-on-cash
- -10.63%
- DSCR
- 0.53
- GRM
- 18.4
CMA / ARV
No comps found within radius.
Projected returns pro-forma
10.0% appreciation · 3.0% rent growth · sell at horizon
- IRR
- 16.8%
- Equity multiple
- 2.38×
- Total profit
- $173,573
- Equity at exit
- $404,945
- IRR
- 16.0%
- Equity multiple
- 5.50×
- Total profit
- $566,598
- Equity at exit
- $873,280
Cash invested: $125,860 (down + closing). Projections, not guarantees.
Landlord ↔ Tenant lean methodology
- Overall (STATE)
- 18 Strongly Tenant-Friendly
- State California
- 18 Strongly Tenant-Friendly · D+13
- County
- — inherits STATE
- City
- — inherits STATE
ZIP-level market 92548
- Home prices YoY
- 16.7%
- Active inventory
- 53
- Price-to-rent
- 18.4×
Monthly cashflow live
- Estimated rent
- $2,037 medium interval (Pro) →
- Mortgage (P&I)
- −$2,357
- Tax from tax record
- −$180 /mo · $2,160/yr
- Insurance
- −$187
- HOA
- −$0
- Vacancy / Maint / Mgmt
- −$428
- Net cashflow
- $-1,115
Break-even live
Sensitivity live
| Price | -10% $-861 | -5% $-988 | +0% $-1,115 | +5% $-1,243 | +10% $-1,370 |
|---|---|---|---|---|---|
| Rent | -10% $-1,276 | -5% $-1,196 | +0% $-1,115 | +5% $-1,035 | +10% $-954 |
| Rate | -1.0pp $-889 | -0.5pp $-1,001 | base $-1,115 | +0.5pp $-1,232 | +1.0pp $-1,350 |
UW: 25.0% down · 7.5% · 30yr · 1.5% tax · 5.0% vac · 8.0% maint · 8.0% mgmt
Financing live
Cash to close
- Down payment
- $112,375
- Closing costs
- $13,485
- Reserves months
- —
- Total cash needed
- —
Loan-product check · same deal, 3 products live
Conventional
25% down · 7.5% · 30yr
- Down + closing
- —
- Monthly P&I
- —
- Monthly cashflow
- —
- DSCR
- —
- Eligible?
- —
Personal DTI + credit; lowest rate.
DSCR
20% down · 8.5% · 30yr
- Down + closing
- —
- Monthly P&I
- —
- Monthly cashflow
- —
- DSCR
- —
- Eligible?
- —
No personal income docs; deal must DSCR.
Hard money
10% down · 12.0% · 12mo
- Down + closing
- —
- Monthly P&I
- —
- Monthly cashflow
- —
- DSCR
- —
- Eligible?
- —
Short-term bridge; refi at stabilization.
Listing history 5 events
-
2026-06-04days on market $449,500 Active 190 DOM
-
2026-06-03days on market $449,500 Active 189 DOM
-
2026-06-02days on market $449,500 Active 188 DOM
-
2026-06-01remarks 305-char remark
-
2026-06-01$449,500 Active 187 DOM
ⓘ Source: listings_history table (triggers on properties + properties_extension) + one-shot
backfill from property_details.listing_events for pre-trigger history.
Tax reassessment forecast CA · Resets to sale price
- Current annual tax
- $2,160 · $180/mo
- Projected year-2 tax
- $3,416 · $285/mo
- Expected delta
- +$1,256/yr (+$105/mo · 58.2%)
ⓘ Screening estimate from a state-policy table — verify with the county assessor before closing.
Climate risk First Street
- Flood 1/10 Low FEMA zone X (unshaded) · 0% chance over 30 yrs
- Wildfire 8/10 Severe
- Heat 7/10 Severe 7 d/yr ≥103°F today · 20 d/yr by 30 yrs out
- Wind 1/10 Low
- Air quality 6/10 Major 10 unhealthy d/yr today · 14 by 30 yrs out
Nearby sold comps map
Loading sold comps map…
Walkable amenities ~0.75 mi
Loading nearby amenities…
Taxation est. · year 1
- Rental income
- $24,444
- − Mortgage interest
- −$25,179
- − Property taxes
- −$2,160
- − Insurance
- −$2,248
- − Repairs & maintenance
- −$1,956
- − Management
- −$1,956
- − Depreciation
- −$13,076
- Taxable loss
- −$22,130
- Est. tax savings @ 24.0%
- +$5,311
- After-tax cash flow
- $-8,072/yr
For passive investors: Depreciation is non-cash, so a rental often shows a tax loss while cash-flowing — sheltering income. Rental losses are passive: they offset passive income freely, and up to $25,000/yr can offset ordinary (W-2) income if you actively participate and your MAGI is under $100k (phasing out to $0 by $150k); unused losses carry forward. On sale, claimed depreciation is recaptured at up to 25%, and gains may owe capital-gains tax (a 1031 exchange can defer both). Figures are a year-1 estimate at your 24.0% rate — not tax advice; consult a CPA.
Schools (NCES district)
- District
- Romoland Elementary
- NCES district ID
- 0633390
- Math proficiency
- 35% ▲ 2.00%
- Reading proficiency
- 44% ▲ 1.00%
- Median HH income
- $58,935
- Composite
- 37.36/100
- National rank
- #8931
- State rank
- #699 of 1400 in CA
Livability — Homeland
- Score
- 45/100
- State rank
- #1297
- US rank
- #26584
Category grades
Schools grade is shown separately in the Schools card above.
Census & demographics
- Census place
- Homeland, CA
- Population (ZIP)
- 6,435
Population outlook (Riverside County) Hauer SSP2
- Today (2025)
- 2,664,475 people
- By 2030
- 2,802,692 · +5.2%
- By 2040
- 3,050,904 · +14.5%
- By 2050
- 3,256,783 · +22.2%
- By 2075
- 3,655,058 · +37.2%
- By 2100
- 3,766,594 · +41.4%
Race, ethnicity, and origin ACS 2023
- Neighborhood character
- Predominantly Hispanic (65%)
- Race & ethnicity
- Hispanic / Latino 65% White 30% Two or more races 9% Native American 3% Asian 3%
- Hispanic origin (detail)
- Mexican 59% Puerto Rican 2%
- Common ancestry
- Italian 2% Lithuanian 1% Serbian 1%
- Foreign-born
- 20% · Canada, South Korea
- Languages at home
- 54% English-only · Spanish 44% Korean 1% Vietnamese 1%
Political lean MEDSL · Riverside
- 2024 margin
- Toss-up / Even · D 48.0% · R 49.3% · Other 2.6%
- 2008→2024 swing
- -3.6pp toward R · 2008: 2.3pp · 2024: -1.3pp
- All cycles
- 2024: R+1.3 2020: D+8.0 2016: D+4.3 2012: R+0.4 2008: D+2.3
Not yet ingested
- Civics
- —
Market trends
- HPI YoY
- ▲ 62.36%
- Current HPI
- 435.0222
- Rent YoY
- —
- Metro
- —
- State GDP YoY
- ▲ 3.21%
- F500 in state
- 116
Industry mix (Fortune 500 HQ in CA)
| Industry | F500 HQs | Revenue |
|---|---|---|
| Technology | 27 | $1,492B |
|
||
| Financial Services | 3 | $174B |
|
||
| Retail | 3 | $44B |
|
||
| Insurance | 3 | $26B |
|
||
| Media / Entertainment | 2 | $115B |
|
||
| Pharmaceuticals / Biotech | 2 | $62B |
|
||
Price history
-86.7% since first listed30 events — show timeline
- 2026-06-01 Relisted — CRMLS
- 2026-05-20 Listed for Rent $2,795 CRMLS
- 2026-05-09 Relisted — CRMLS
- 2026-04-24 Relisted — CRMLS
- 2026-03-27 Relisted — CRMLS
- 2026-02-27 Relisted — CRMLS
- 2026-02-01 Relisted — CRMLS
- 2026-01-17 Relisted — CRMLS
- 2025-12-20 Relisted — CRMLS
- 2025-11-21 Relisted — CRMLS
- 2025-10-17 Relisted — CRMLS
- 2025-09-27 Relisted — CRMLS
- 2025-07-18 Relisted — CRMLS
- 2025-06-01 Relisted — CRMLS
- 2025-05-09 Relisted — CRMLS
- 2025-03-22 Relisted — CRMLS
- 2025-02-25 Relisted — CRMLS
- 2025-02-21 Rental Removed $2,795 CRMLS
- 2025-02-06 Price Changed $2,795 CRMLS
- 2025-02-01 Listed for Rent $2,950 CRMLS
- 2024-11-01 Relisted — CRMLS
- 2024-10-07 Price Changed $449,500 CRMLS
- 2024-09-28 Listed $460,000 CRMLS
- 2019-03-07 Listing Removed — CRMLS
- 2019-01-04 Price Changed $279,950 CRMLS
- 2018-12-12 Listed $289,950 CRMLS
- 2006-11-13 Sold (Public Records) $85,000 Public Records
- 2006-11-13 Sold (MLS) $85,000 CRMLS
- 2006-05-25 Listed $95,000 CRMLS
- 1997-03-26 Sold (Public Records) $21,000 Public Records
Property tax history
+1.5%/yrLatest (2025): $2,160 · -0.0% YoY. Source: county tax records.
Cash-flow waterfall
monthlySold comps — $/sqft
last 12 mo · ≤1 miLoading sold comps…