 6-Plex
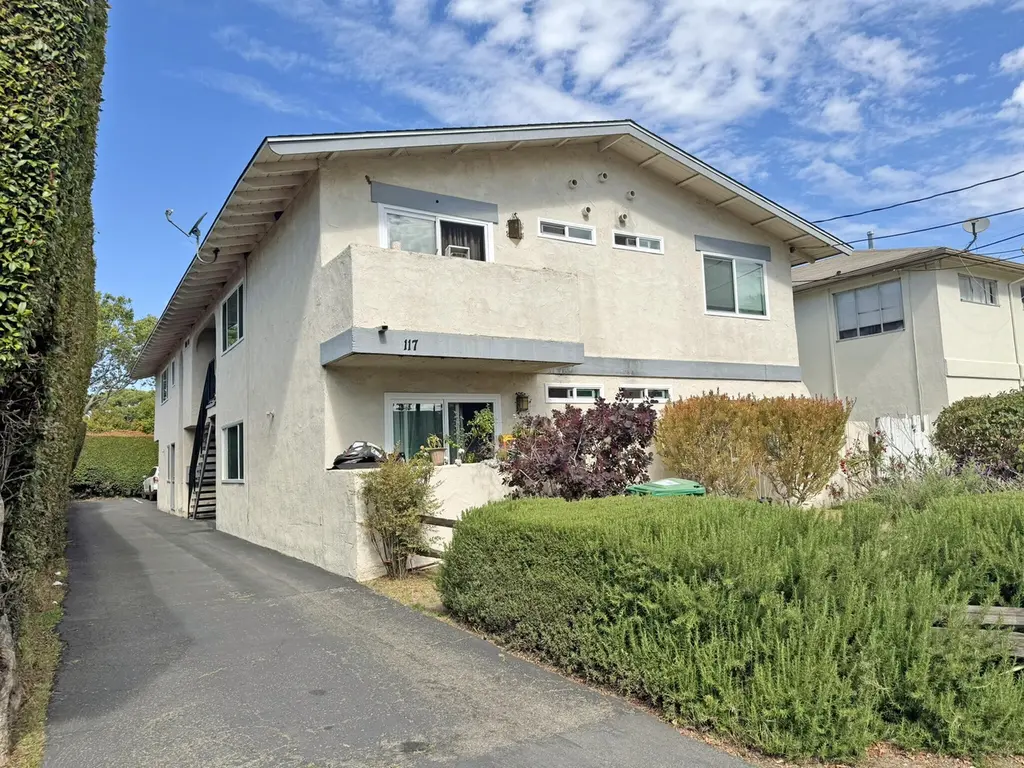
117 Magnolia Ave · Goleta, CA
Flood risk 1/10 · Minimal
- FEMA flood zone
- X (unshaded)
- Chance of flooding over 30 yrs
- 0.0%
- Est. flood insurance / yr
- $507 – $1,088
Fire risk 2/10 · Minimal
- Est. fire insurance / yr
- $659 – $1,223
Heat risk 6/10 · Moderate
- Hot days now (above 83°F)
- 8 days/yr
- Hot days in 30 yrs
- 22 days/yr
Wind risk 1/10 · Minimal
- Chance of severe wind over 30 yrs
- —
Air-quality risk 6/10 · Moderate
- Unhealthy air days now
- 10 days/yr
- Unhealthy air days in 30 yrs
- 10 days/yr
Risk factors via First Street. Map © Google.
Why this score? — see what drove the B grade
The composite is a weighted blend of 9 inputs, each scored 0–100. Each bar is that input's sub-score; the figure is the points it added to the 100-point composite (weight × sub-score).
- Cash flow +30.0/30.0
- 1% rule +10.0/10.0
- DSCR +10.0/10.0
- ARV discount +7.5/15.0
- Schools +5.6/10.0
- Rent growth +4.1/5.0
- Livability +4.0/5.0
- Condition / age +2.5/5.0
- Appreciation +0.0/10.0
$1,995,000
🖨 Deal sheet (PDF) 📄 Offer letter ✓ Due diligence
Multi-family units
County records classify this as Multi-Family (5+ Unit). Listing-text estimate: 6 units. confirmed
5+ unit building — per-unit beds/baths from public records are typically unavailable; the breakdown below (if shown) is an estimate from the listing text.
Listing remarks
Offers to be reviewed Monday, May 18th at Noon. 117 Magnolia Ave presents a rare opportunity to acquire a well-located 6-unit apartment building in the heart of Goleta. This property offers strong in-place income with upside potential through rental increases and operational efficiencies. Situated in a highly desirable rental market near major employers, retail amenities, and UCSB, the asset benefits from consistent tenant demand and long-term appreciation potential. Ideal for investors seeking stable cash flow with value-add potential in one of Santa Barbara County's most sought-after submarkets.
Key facts
- 6,534 sq ft lot
- Built 1970
- Listed 9 days
Property features AI
Finance
- Financial info: Unit rents: two units at $2,800 each, two units at $2,100 each, two units at $1,850 each; Monthly totals shown: $5,600, $4,200, $3,700 (per unit group)
Exterior
- Home design: Multi-unit property (6 units)
- Exterior features: Zoned Other; Located near Hollister Ave
Interior
- Bedrooms: Two 2-bedroom units; Two 1-bedroom units; Two additional units (bedrooms not specified)
- Bathrooms: Two 2-bath units; Two 1-bath units; Two 1-bath units (listed as full bath)
- Interior features: Six-unit building
Neighborhood map
What this means for you Summary
Snapshot
- This is a 6 × 6-bed/8.0-bath units multifamily listed at $2.00M.
Deal economics
- At list price, monthly cash flow is $18k ($213k/yr) — positive. Per door: $3k/mo.
- The deal already cash-flows at list — no discount required.
- Meets the 1% rule at list price ($38k rent vs $2.00M).
- Cap rate 17.0% vs local median 2.9% in Goleta — top-decile yield for the area; either an underpriced asset or a hidden risk that comps aren't pricing in. Stress-test before assuming the spread holds.
Location & tenants
- Location reads 81/100 on livability (#40 in CA, #1,510 nationally) — a professional / high-income tenant draw. Strengths: amenities A+, commute A+, employment A+; Watch: cost of living F.
- Goleta Union Elementary (suburban): math 59% / reading 65% proficiency, ranked #195 of 1,400 in CA (top 14%) — acceptable for families but not a draw, mixed tenant base, ~2y average lease.
- Market conditions: Rents rising fast (+6.5%/yr); 70 active listings in the ZIP; solid renter incomes; 719 units permitted in Santa Barbara County in 2024 (217 in 5+ unit buildings).
- At $37,738/mo this rent would consume 503% of the median local household income ($90k/yr) (locally 4402% of renters already pay >50% of income on rent) — very limited rent-growth headroom before tenants either downsize or default.
Forward outlook
- Local home prices are declining (-3.0%/yr); year-one equity from $14k of loan paydown is wiped out by about $60k of value loss. Plan a longer hold.
- Santa Barbara County population projected at +20% by 2050 — long-run rental-demand tailwind backs the buy-and-hold thesis.
- At projected returns (-3.0% appreciation + 6.5% rent growth), your $559k cash investment doubles in ~3 years — after that, you're playing with house money.
Negotiation context
- Only 9 days on market — expect competitive offers; lowballing is unlikely to land.
Risks & watch-outs
- Climate carrying-cost: extreme-heat days projected 8→22/yr by 2055 (HVAC capex compounding) — expect insurance premiums to compound above CPI over the hold.
Questions for the listing agent
- Can we see the unit-by-unit rent roll, current vacancy, and any below-market leases? What's the average tenancy length?
- What capital expenditures (roof, boiler, parking lot, exteriors) have been made in the last 5 years, and what's planned in the next 2?
- Built in 1970 — when were the roof, HVAC, electrical panel, plumbing, and water heater last replaced?
- Is there a deadline driving the sale (1031 exchange, divorce, estate, relocation)? That informs how much negotiation room exists.
- What's the average days-on-market for RENTAL listings here right now (not sales)? A rising rental-DOM trend means longer vacancies and softer asking-rent achievability than the comps imply.
- What's the recent tenant-quality profile in this submarket — average credit score on applications, eviction rate, late-payment / NSF rate, and stable-employment percentage? A property-management company in the area should have these aggregated.
- How much new apartment / multifamily construction is in the pipeline within 1–3 miles? Heavy new supply (>2% of stock underway) typically softens rents 12–24 months out; light construction supports rent growth.
Investment metrics
- 1% rule
- 1.89% ✓
- Cap rate
- 16.99%
- Cash-on-cash
- 38.22%
- DSCR
- 2.70
- GRM
- 4.4
CMA / ARV
No comps found within radius.
Projected returns pro-forma
-3.0% appreciation · 6.49% rent growth · sell at horizon
- IRR
- 38.0%
- Equity multiple
- 2.69×
- Total profit
- $946,368
- Equity at exit
- $297,461
- IRR
- 46.1%
- Equity multiple
- 6.17×
- Total profit
- $2,885,653
- Equity at exit
- $172,491
Cash invested: $558,600 (down + closing). Projections, not guarantees.
Landlord ↔ Tenant lean methodology
- Overall (STATE)
- 18 Strongly Tenant-Friendly
- State California
- 18 Strongly Tenant-Friendly · D+13
- County
- — inherits STATE
- City
- — inherits STATE
ZIP-level market 93117
- Rents YoY
- 6.5%
- Active inventory
- 70
- Price-to-rent
- 26.4×
Monthly cashflow live
- Estimated rent
- $37,738 medium interval (Pro) →
- Mortgage (P&I)
- −$10,462
- Tax from tax record
- −$731 /mo · $8,767/yr
- Insurance
- −$831
- HOA
- −$0
- Vacancy / Maint / Mgmt
- −$7,925
- Net cashflow
- $17,789
Break-even live
Sensitivity live
| Price | -10% $18,919 | -5% $18,354 | +0% $17,789 | +5% $17,225 | +10% $16,660 |
|---|---|---|---|---|---|
| Rent | -10% $14,808 | -5% $16,299 | +0% $17,789 | +5% $19,280 | +10% $20,771 |
| Rate | -1.0pp $18,794 | -0.5pp $18,297 | base $17,789 | +0.5pp $17,272 | +1.0pp $16,746 |
6-unit breakdown (identical units grouped — click to expand)
| Units | Beds | Baths | Est. rent |
|---|---|---|---|
| 6× units | 6 | 8 | $37,740 |
| #1 | 6 | 8 | $6,290 |
| #2 | 6 | 8 | $6,290 |
| #3 | 6 | 8 | $6,290 |
| #4 | 6 | 8 | $6,290 |
| #5 | 6 | 8 | $6,290 |
| #6 | 6 | 8 | $6,290 |
| Total (6 units) | $37,738 | ||
UW: 25.0% down · 7.5% · 30yr · 1.5% tax · 5.0% vac · 8.0% maint · 8.0% mgmt
Financing live
Cash to close
- Down payment
- $498,750
- Closing costs
- $59,850
- Reserves months
- —
- Total cash needed
- —
Loan-product check · same deal, 3 products live
Conventional
25% down · 7.5% · 30yr
- Down + closing
- —
- Monthly P&I
- —
- Monthly cashflow
- —
- DSCR
- —
- Eligible?
- —
Personal DTI + credit; lowest rate.
DSCR
20% down · 8.5% · 30yr
- Down + closing
- —
- Monthly P&I
- —
- Monthly cashflow
- —
- DSCR
- —
- Eligible?
- —
No personal income docs; deal must DSCR.
Hard money
10% down · 12.0% · 12mo
- Down + closing
- —
- Monthly P&I
- —
- Monthly cashflow
- —
- DSCR
- —
- Eligible?
- —
Short-term bridge; refi at stabilization.
Listing history 2 events
-
2026-05-20status Pending
-
2026-05-11$1,995,000 Active
ⓘ Source: listings_history table (triggers on properties + properties_extension) + one-shot
backfill from property_details.listing_events for pre-trigger history.
Tax reassessment forecast CA · Resets to sale price
- Current annual tax
- $8,767 · $731/mo
- Projected year-2 tax
- $15,162 · $1,264/mo
- Expected delta
- +$6,395/yr (+$533/mo · 73.0%)
ⓘ Screening estimate from a state-policy table — verify with the county assessor before closing.
Climate risk First Street
- Flood 1/10 Low FEMA zone X (unshaded) · 0% chance over 30 yrs
- Wildfire 2/10 Low
- Heat 6/10 Major 8 d/yr ≥83°F today · 22 d/yr by 30 yrs out
- Wind 1/10 Low
- Air quality 6/10 Major 10 unhealthy d/yr today · 10 by 30 yrs out
Nearby sold comps map
Loading sold comps map…
Walkable amenities ~0.75 mi
Loading nearby amenities…
Taxation est. · year 1
- Rental income
- $452,856
- − Mortgage interest
- −$111,751
- − Property taxes
- −$8,767
- − Insurance
- −$9,975
- − Repairs & maintenance
- −$36,228
- − Management
- −$36,228
- − Depreciation
- −$58,036
- Taxable income
- $191,870
- Est. tax owed @ 24.0%
- −$46,049
- After-tax cash flow
- $167,422/yr
For passive investors: Depreciation is non-cash, so a rental often shows a tax loss while cash-flowing — sheltering income. Rental losses are passive: they offset passive income freely, and up to $25,000/yr can offset ordinary (W-2) income if you actively participate and your MAGI is under $100k (phasing out to $0 by $150k); unused losses carry forward. On sale, claimed depreciation is recaptured at up to 25%, and gains may owe capital-gains tax (a 1031 exchange can defer both). Figures are a year-1 estimate at your 24.0% rate — not tax advice; consult a CPA.
Schools (NCES district)
- District
- Goleta Union Elementary
- NCES district ID
- 0615510
- Math proficiency
- 59% ▲ 1.00%
- Reading proficiency
- 65% ▲ 3.00%
- Median HH income
- $70,375
- Composite
- 56.2/100
- National rank
- #2513
- State rank
- #195 of 1400 in CA
Livability — Goleta
- Score
- 81/100
- State rank
- #40
- US rank
- #1510
Category grades
Schools grade is shown separately in the Schools card above.
Census & demographics
- Census place
- Goleta, CA
- County
- Santa Barbara County · 410,380 people
- City population
- 52,934
- Metro
- Santa Maria-Santa Barbara, CA
- Population (ZIP)
- 52,934
- Household income
- $90,037
- Rent vs Own
- Severe rent burden
- 4402.0
Population outlook (Santa Barbara County) Hauer SSP2
- Today (2025)
- 484,679 people
- By 2030
- 505,323 · +4.3%
- By 2040
- 545,783 · +12.6%
- By 2050
- 584,263 · +20.5%
- By 2075
- 682,586 · +40.8%
- By 2100
- 723,188 · +49.2%
Race, ethnicity, and origin ACS 2023
- Neighborhood character
- Diverse neighborhood (Simpson 0.66)
- Race & ethnicity
- White 47% Hispanic / Latino 31% Two or more races 15% Asian 14% Black 3%
- Hispanic origin (detail)
- Mexican 27%
- Common ancestry
- Italian 2% Slovak 2% Lithuanian 1%
- Foreign-born
- 19% · Canada, China, South Korea
- Languages at home
- 66% English-only · Spanish 19% Chinese 6% Other Indo-European 2%
Political lean MEDSL · Santa Barbara
- 2024 margin
- Strong D (+26.7) · D 61.8% · R 35.1% · Other 3.1%
- 2008→2024 swing
- +3.8pp toward D · 2008: 22.9pp · 2024: 26.7pp
- All cycles
- 2024: D+26.7 2020: D+32.1 2016: D+28.2 2012: D+17.1 2008: D+22.9
Not yet ingested
- Civics
- —
Market trends
- HPI YoY
- ▼ -1327.27%
- Current HPI
- 301.0456
- Rent YoY
- ▲ 6.49%
- Metro
- Santa Maria-Santa Barbara, CA
- State GDP YoY
- ▲ 3.21%
- F500 in state
- 116
Industry mix (Fortune 500 HQ in CA)
| Industry | F500 HQs | Revenue |
|---|---|---|
| Technology | 27 | $1,492B |
|
||
| Financial Services | 3 | $174B |
|
||
| Retail | 3 | $44B |
|
||
| Insurance | 3 | $26B |
|
||
| Media / Entertainment | 2 | $115B |
|
||
| Pharmaceuticals / Biotech | 2 | $62B |
|
||
Price history
2 events — show timeline
- 2026-05-20 Pending — SBMLS
- 2026-05-11 Listed $1,995,000 SBMLS
Property tax history
+1.7%/yrLatest (2025): $8,767 · +1.3% YoY. Source: county tax records.
Cash-flow waterfall
monthlySold comps — $/sqft
last 12 mo · ≤1 miLoading sold comps…