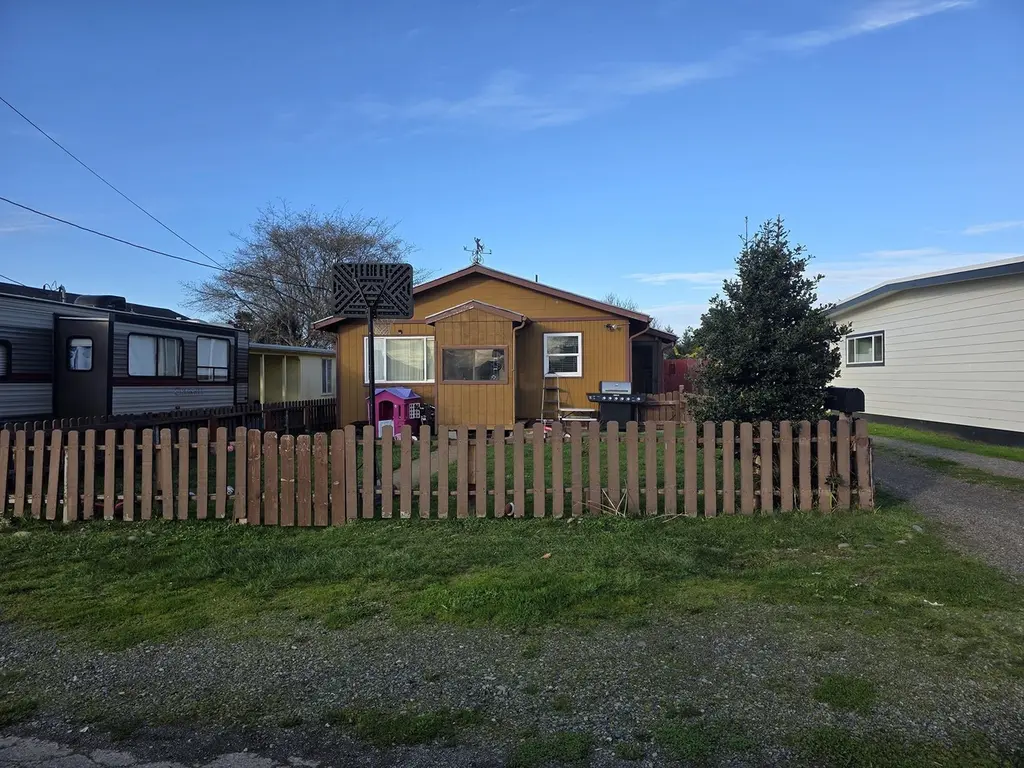
540 Keller Ave · Crescent City, CA
Flood risk 1/10 · Minimal
- FEMA flood zone
- X (unshaded)
- Chance of flooding over 30 yrs
- 0.0%
- Est. flood insurance / yr
- $507 – $1,088
Fire risk 2/10 · Minimal
- Est. fire insurance / yr
- $659 – $1,223
Heat risk 2/10 · Minimal
- Hot days now (above 71°F)
- 9 days/yr
- Hot days in 30 yrs
- 29 days/yr
Wind risk 1/10 · Minimal
- Chance of severe wind over 30 yrs
- —
Air-quality risk 6/10 · Moderate
- Unhealthy air days now
- 8 days/yr
- Unhealthy air days in 30 yrs
- 9 days/yr
Risk factors via First Street. Map © Google.
Why this score? — see what drove the D grade
The composite is a weighted blend of 9 inputs, each scored 0–100. Each bar is that input's sub-score; the figure is the points it added to the 100-point composite (weight × sub-score).
- Cash flow +14.0/30.0
- ARV discount +10.1/15.0
- DSCR +4.2/10.0
- Livability +2.9/5.0
- Schools +2.8/10.0
- 1% rule +2.7/10.0
- Rent growth +2.5/5.0
- Condition / age +2.5/5.0
- Appreciation +0.0/10.0
$270,000
🖨 Deal sheet 📄 Offer letter ✓ Due diligence
Listing remarks MLS
Discover the perfect blend of comfort and coastal living in this inviting single-family 2 bed, 1bath home nestled in a quiet residential neighborhood of Crescent City. This home is about 1,260 sq. ft. Located on desirable Keller Avenue, this property offers easy access to the rugged beauty of Northern California's coastline, just minutes from pristine beaches, the historic Battery Point Lighthouse, and the majestic ancient redwoods of Jedediah Smith Redwoods State Park. Ideal for first-time buyers, retirees, or anyone seeking a peaceful escape, this home features classic mid-century charm with potential for personalization. Enjoy the mild coastal climate, nearby ocean views, and endless outdoor adventures—from beachcombing and whale watching to hiking ancient forest trails. Conveniently close to local amenities, schools, and Highway 101 for easy travel. Don't miss this opportunity to own a slice of Del Norte County's natural paradise—schedule your showing today!
Key facts
- Minutes from beaches
- Mild coastal climate
- Nearby ocean views
Tags
Neighborhood map
What this means for you Summary
Snapshot
- This is a 2-bed/1.0-bath single-family listed at $270k.
Deal economics
- At list price, monthly cash flow is $33 ($393/yr) — positive.
- The deal already cash-flows at list — no discount required.
- To meet the 1% rule (rent ≥ 1% of price), the offer needs to be $207k (23.4% below list).
- Recommended offer: $207k (23.4% below list) — sets the bar for 1% rule.
- Cap rate 6.4% vs local median 3.1% in Crescent City — top-decile yield for the area; either an underpriced asset or a hidden risk that comps aren't pricing in. Stress-test before assuming the spread holds.
Location & tenants
- Location reads 57/100 on livability (#730 in CA) — a working-class tenant base; expect higher turnover. Strengths: health & safety A+, housing A; Watch: cost of living D, schools D-, crime F.
- Del Norte County Unified (town): math 25% / reading 36% proficiency, ranked #1,047 of 1,400 in CA (top 75%) — families likely to look elsewhere, expect single-tenant / working-renter base with shorter leases.
- Market conditions: 226 active listings in the ZIP; 3 comparable units currently listed for rent nearby; rentals lingering (median 44d on market — plan ~5-8 weeks vacancy on turnover, expect pricing pressure); 100% of comp listings sitting > 30 days — soft ceiling on asking rent; 55 units permitted in Del Norte County in 2024 (22 in 5+ unit buildings).
Forward outlook
- Local home prices are declining (-3.0%/yr); year-one equity from $2k of loan paydown is wiped out by about $8k of value loss. Plan a longer hold.
- Del Norte County population projected at -14% by 2050 — secular population decline; favor cash flow + early exit over multi-decade hold.
Negotiation context
- It's been on market 179 days — a 12% lower offer ($238k) is reasonable based on typical stale-listing flexibility.
Risks & watch-outs
- Watch-outs: built in 1948 — expect roof / HVAC / electrical / plumbing capex.
Questions for the listing agent
- It's been on market 179 days. Have you received any prior offers? Is the seller open to a 23% concession, seller financing, or rate buy-down credit?
- Built in 1948 — when were the roof, HVAC, electrical panel, plumbing, and water heater last replaced?
- Why hasn't it sold? Are there any deal-killer items the seller is aware of (foundation, flood, title, zoning, code violations)?
- Is there a deadline driving the sale (1031 exchange, divorce, estate, relocation)? That informs how much negotiation room exists.
- Schools are D-rated, which usually means shorter tenancies and higher turnover. Who's the typical renter profile here, and what's been the actual vacancy rate?
- Crime grade is F in this area — have there been break-ins, vandalism, or insurance claims at this property in the last 3 years? What carrier currently insures it and at what premium?
- The area grade is low — what's the realistic commute time and amenity access for the typical tenant pool here? Any planned neighborhood developments (good or bad) we should know about?
- What's the average days-on-market for RENTAL listings here right now (not sales)? A rising rental-DOM trend means longer vacancies and softer asking-rent achievability than the comps imply.
- What's the recent tenant-quality profile in this submarket — average credit score on applications, eviction rate, late-payment / NSF rate, and stable-employment percentage? A property-management company in the area should have these aggregated.
- How much new for-sale + rental construction is in the pipeline within 1–3 miles? Heavy new supply typically softens prices + rents 12–24 months out; constrained supply supports both.
Investment metrics
- 1% rule
- 0.77% ✗
- Cap rate
- 6.44%
- Cash-on-cash
- 0.52%
- DSCR
- 1.02
- GRM
- 10.9
CMA / ARV
- ARV (median comp)
- $286,310
- List price
- $270,000
- Delta
- -5.70%
- Verdict
- FAIR
- Comps
- 20 within 1.0 mi
Show comp detail 12 sales within ~0.75 mi
| Address | Dist | Beds/Ba | Sqft | Sold | Price | $/sf | Match |
|---|---|---|---|---|---|---|---|
| 902 Fresno St | 0.14mi | 3/2.0 (+1) | 1,306 (+4%) | 3mo | $320,000 | $245 | 76 |
| 696 Cooper Ave | 0.18mi | 3/2.0 (+1) | 1,306 (+4%) | 5mo | $294,900 | $226 | 72 |
| 469 Murphy Ave | 0.10mi | 3/2.0 (+1) | 1,100 (-13%) | 4mo | $145,000 | $132 | 62 |
| 171 E Cooper Ave | 0.33mi | 2/2.0 | 1,342 (+6%) | 10mo | $295,000 | $220 | 61 |
| 855 G St | 0.64mi | 3/1.0 (+1) | 1,199 (-5%) | 5mo | $220,000 | $183 | 53 |
| 250 Grand Ave | 0.60mi | 3/1.0 (+1) | 1,204 (-4%) | 10mo | $320,000 | $266 | 51 |
| 180 Grand Ave | 0.58mi | 3/1.0 (+1) | 1,159 (-8%) | 5mo | $340,000 | $293 | 51 |
| 373 Grant Ave | 0.41mi | 3/2.0 (+1) | 1,400 (+11%) | 3mo | $280,000 | $200 | 51 |
| 407 Glenn St | 0.24mi | 3/2.0 (+1) | 1,095 (-13%) | 10mo | $339,000 | $310 | 50 |
| 845 G St | 0.65mi | 2/1.5 | 1,140 (-10%) | 3mo | $270,000 | $237 | 50 |
| 1382 California St | 0.56mi | 3/2.0 (+1) | 1,344 (+7%) | 7mo | $325,000 | $242 | 48 |
| 1210 Douglas St | 0.68mi | 3/2.0 (+1) | 1,430 (+14%) | 6mo | $250,000 | $175 | 32 |
Match score weights: distance 35% · size 25% · config 20% · recency 20%. Top-matched comps best support the ARV.
Projected returns pro-forma
-3.0% appreciation · 3.0% rent growth · sell at horizon
- IRR
- -15.5%
- Equity multiple
- 0.45×
- Total profit
- $-41,798
- Equity at exit
- $40,258
- IRR
- -7.1%
- Equity multiple
- 0.55×
- Total profit
- $-34,246
- Equity at exit
- $23,345
Cash invested: $75,600 (down + closing). Projections, not guarantees.
Landlord ↔ Tenant lean methodology
- Overall (STATE)
- 18 Strongly Tenant-Friendly
- State California
- 18 Strongly Tenant-Friendly · D+13
- County
- — inherits STATE
- City
- — inherits STATE
ZIP-level market 95531
- Active inventory
- 226
- Price-to-rent
- 10.9×
Monthly cashflow live
- Estimated rent
- $2,068 medium interval (Pro) →
- Mortgage (P&I)
- −$1,416
- Tax from tax record
- −$72 /mo · $870/yr
- Insurance
- −$112
- HOA
- −$0
- Vacancy / Maint / Mgmt
- −$434
- Net cashflow
- $33
Break-even live
UW: 25.0% down · 7.5% · 30yr · 1.5% tax · 5.0% vac · 8.0% maint · 8.0% mgmt
Financing live
Cash to close
- Down payment
- $67,500
- Closing costs
- $8,100
- Reserves months
- —
- Total cash needed
- —
Loan-product check · same deal, 3 products live
Conventional
25% down · 7.5% · 30yr
- Down + closing
- —
- Monthly P&I
- —
- Monthly cashflow
- —
- DSCR
- —
- Eligible?
- —
Personal DTI + credit; lowest rate.
DSCR
20% down · 8.5% · 30yr
- Down + closing
- —
- Monthly P&I
- —
- Monthly cashflow
- —
- DSCR
- —
- Eligible?
- —
No personal income docs; deal must DSCR.
Hard money
10% down · 12.0% · 12mo
- Down + closing
- —
- Monthly P&I
- —
- Monthly cashflow
- —
- DSCR
- —
- Eligible?
- —
Short-term bridge; refi at stabilization.
Rent comps 3 comps
| Address | Beds | Baths | Sqft | Rent | $/sqft | DOM | Units | Dist |
|---|---|---|---|---|---|---|---|---|
| 633 Calaveras St Crescent City, CA | 2.0 | 1.0 | 1354 | $2,280 | $1.68 | 43d | 1 | 0.09mi |
| 911 Pacific Ave Crescent City, CA | 2.0–3.0 | 1.5–2.0 | 1050 | $1,200 | $1.14 | 43d | 1 | 0.39mi |
| 1610 Arlington Dr Crescent City, CA | 3.0 | 2.0 | 1490 | $1,950 | $1.31 | 43d | 1 | 0.82mi |
Listing history 19 events
-
2026-06-19days on market $270,000 Active 179 DOM
-
2026-06-18days on market $270,000 Active 178 DOM
-
2026-06-17days on market $270,000 Active 177 DOM
-
2026-06-16days on market $270,000 Active 176 DOM
-
2026-06-15days on market $270,000 Active 175 DOM
-
2026-06-14days on market $270,000 Active 173 DOM
-
2026-06-12days on market $270,000 Active 172 DOM
-
2026-06-09days on market $270,000 Active 169 DOM
-
2026-06-08days on market $270,000 Active 168 DOM
-
2026-06-07days on market $270,000 Active 167 DOM
-
2026-06-07days on market $270,000 Active 166 DOM
-
2026-06-04days on market $270,000 Active 163 DOM
-
2026-06-02days on market $270,000 Active 162 DOM
-
2026-06-01days on market $270,000 Active 161 DOM
-
2026-05-31days on market $270,000 Active 160 DOM
-
2026-05-31days on market $270,000 Active 159 DOM
-
2026-05-07price $270,000 988-char remark
Show marketing remark (988 chars)
Discover the perfect blend of comfort and coastal living in this inviting single-family 2 bed, 1bath home nestled in a quiet residential neighborhood of Crescent City. This home is about 1,260 sq. ft. Located on desirable Keller Avenue, this property offers easy access to the rugged beauty of Northern California's coastline, just minutes from pristine beaches, the historic Battery Point Lighthouse, and the majestic ancient redwoods of Jedediah Smith Redwoods State Park. Ideal for first-time buyers, retirees, or anyone seeking a peaceful escape, this home features classic mid-century charm with potential for personalization. Enjoy the mild coastal climate, nearby ocean views, and endless outdoor adventures—from beachcombing and whale watching to hiking ancient forest trails. Conveniently close to local amenities, schools, and Highway 101 for easy travel. Don't miss this opportunity to own a slice of Del Norte County's natural paradise—schedule your showing today!
-
2026-04-02price $250,000 988-char remark
Show marketing remark (988 chars)
Discover the perfect blend of comfort and coastal living in this inviting single-family 2 bed, 1bath home nestled in a quiet residential neighborhood of Crescent City. This home is about 1,260 sq. ft. Located on desirable Keller Avenue, this property offers easy access to the rugged beauty of Northern California's coastline, just minutes from pristine beaches, the historic Battery Point Lighthouse, and the majestic ancient redwoods of Jedediah Smith Redwoods State Park. Ideal for first-time buyers, retirees, or anyone seeking a peaceful escape, this home features classic mid-century charm with potential for personalization. Enjoy the mild coastal climate, nearby ocean views, and endless outdoor adventures—from beachcombing and whale watching to hiking ancient forest trails. Conveniently close to local amenities, schools, and Highway 101 for easy travel. Don't miss this opportunity to own a slice of Del Norte County's natural paradise—schedule your showing today!
-
2025-12-23$290,000 Active 988-char remark
Show marketing remark (988 chars)
Discover the perfect blend of comfort and coastal living in this inviting single-family 2 bed, 1bath home nestled in a quiet residential neighborhood of Crescent City. This home is about 1,260 sq. ft. Located on desirable Keller Avenue, this property offers easy access to the rugged beauty of Northern California's coastline, just minutes from pristine beaches, the historic Battery Point Lighthouse, and the majestic ancient redwoods of Jedediah Smith Redwoods State Park. Ideal for first-time buyers, retirees, or anyone seeking a peaceful escape, this home features classic mid-century charm with potential for personalization. Enjoy the mild coastal climate, nearby ocean views, and endless outdoor adventures—from beachcombing and whale watching to hiking ancient forest trails. Conveniently close to local amenities, schools, and Highway 101 for easy travel. Don't miss this opportunity to own a slice of Del Norte County's natural paradise—schedule your showing today!
ⓘ Source: listings_history table (triggers on properties + properties_extension) + one-shot
backfill from property_details.listing_events for pre-trigger history.
Tax reassessment forecast CA · Resets to sale price
- Current annual tax
- $870 · $72/mo
- Projected year-2 tax
- $2,052 · $171/mo
- Expected delta
- +$1,182/yr (+$99/mo · 136.0%)
ⓘ Screening estimate from a state-policy table — verify with the county assessor before closing.
Climate risk First Street
- Flood 1/10 Low FEMA zone X (unshaded) · 0% chance over 30 yrs
- Wildfire 2/10 Low
- Heat 2/10 Low 9 d/yr ≥71°F today · 29 d/yr by 30 yrs out
- Wind 1/10 Low
- Air quality 6/10 Major 8 unhealthy d/yr today · 9 by 30 yrs out
Nearby sold comps map
Loading sold comps map…
Walkable amenities ~0.75 mi
Loading nearby amenities…
Taxation est. · year 1
- Rental income
- $24,815
- − Mortgage interest
- −$15,124
- − Property taxes
- −$870
- − Insurance
- −$1,350
- − Repairs & maintenance
- −$1,985
- − Management
- −$1,985
- − Depreciation
- −$7,855
- Taxable loss
- −$4,354
- Est. tax savings @ 24.0%
- +$1,045
- After-tax cash flow
- $1,438/yr
For passive investors: Depreciation is non-cash, so a rental often shows a tax loss while cash-flowing — sheltering income. Rental losses are passive: they offset passive income freely, and up to $25,000/yr can offset ordinary (W-2) income if you actively participate and your MAGI is under $100k (phasing out to $0 by $150k); unused losses carry forward. On sale, claimed depreciation is recaptured at up to 25%, and gains may owe capital-gains tax (a 1031 exchange can defer both). Figures are a year-1 estimate at your 24.0% rate — not tax advice; consult a CPA.
Schools (NCES district)
- District
- Del Norte County Unified
- NCES district ID
- 0610770
- Math proficiency
- 25% ▲ 1.00%
- Reading proficiency
- 36% ▲ 1.00%
- Median HH income
- $39,747
- Composite
- 28.43/100
- National rank
- #12110
- State rank
- #1047 of 1400 in CA
Livability — Crescent City
- Score
- 57/100
- State rank
- #730
- US rank
- #21544
Category grades
Schools grade is shown separately in the Schools card above.
Census & demographics
- Population (ZIP)
- 22,491
Population outlook (Del Norte County) Hauer SSP2
- Today (2025)
- 25,011 people
- By 2030
- 24,204 · -3.2%
- By 2040
- 22,826 · -8.7%
- By 2050
- 21,495 · -14.1%
- By 2075
- 18,487 · -26.1%
- By 2100
- 16,113 · -35.6%
Race, ethnicity, and origin ACS 2023
- Neighborhood character
- Diverse neighborhood (Simpson 0.58)
- Race & ethnicity
- White 61% Hispanic / Latino 20% Two or more races 12% Native American 5% Asian 4% Black 3%
- Hispanic origin (detail)
- Mexican 15%
- Common ancestry
- Slovak 4% Russian 2% Lithuanian 2%
- Foreign-born
- 8% · Canada, Vietnam, South Korea
- Languages at home
- 88% English-only · Spanish 8% Other Asian/Pacific 2% Vietnamese 1%
Political lean MEDSL · Del Norte
- 2024 margin
- R (+16.4) · D 40.4% · R 56.8% · Other 2.8%
- 2008→2024 swing
- -9.7pp toward R · 2008: -6.8pp · 2024: -16.4pp
- All cycles
- 2024: R+16.4 2020: R+15.6 2016: R+17.6 2012: R+10.8 2008: R+6.8
Not yet ingested
- Civics
- —
Market trends
- HPI YoY
- ▼ -300.53%
- Current HPI
- 148.4819
- Rent YoY
- —
- Metro
- —
- State GDP YoY
- ▲ 3.21%
- F500 in state
- 116
Industry mix (Fortune 500 HQ in CA)
| Industry | F500 HQs | Revenue |
|---|---|---|
| Technology | 27 | $1,492B |
|
||
| Financial Services | 3 | $174B |
|
||
| Retail | 3 | $44B |
|
||
| Insurance | 3 | $26B |
|
||
| Media / Entertainment | 2 | $115B |
|
||
| Pharmaceuticals / Biotech | 2 | $62B |
|
||
Price history
-6.9% since first listed3 events — show timeline
- 2026-05-07 Price Changed $270,000 DNAORMLS
- 2026-04-02 Price Changed $250,000 DNAORMLS
- 2025-12-23 Listed $290,000 DNAORMLS
Property tax history
+1.9%/yrLatest (2025): $870 · +5.6% YoY. Source: county tax records.
Cash-flow waterfall
monthlySold comps — $/sqft
last 12 mo · ≤1 miLoading sold comps…