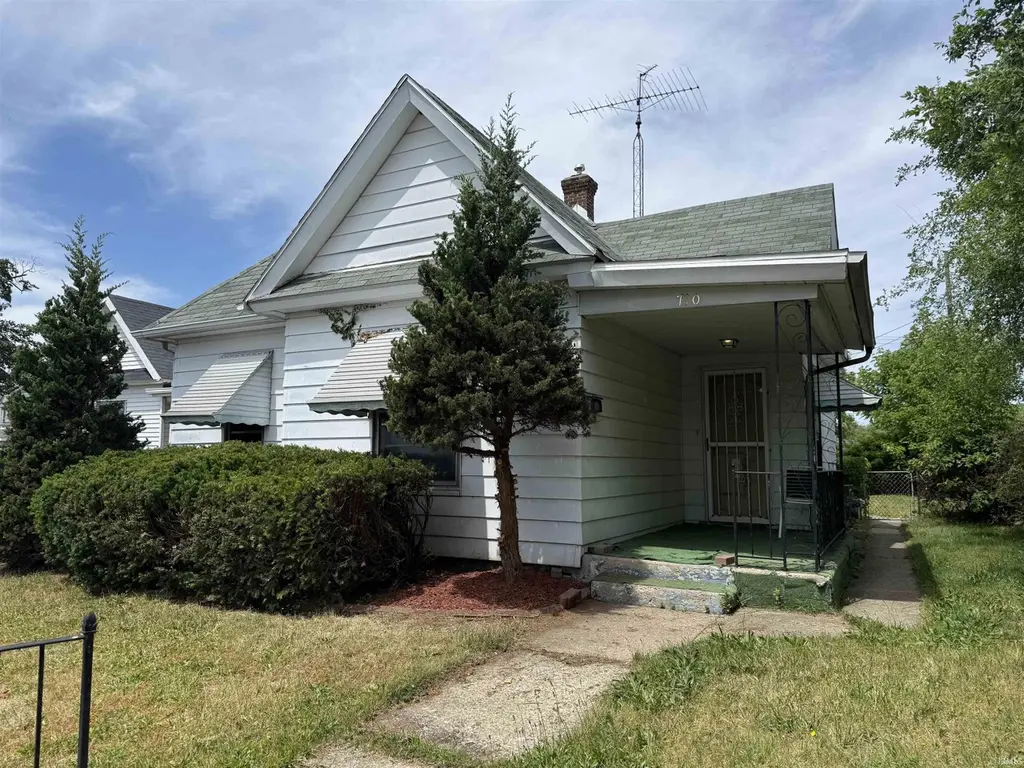
710 Laporte Ave · South Bend, IN
Flood risk 1/10 · Minimal
- FEMA flood zone
- X (unshaded)
- Chance of flooding over 30 yrs
- 0.0%
- Est. flood insurance / yr
- $473 – $860
Fire risk 1/10 · Minimal
- Est. fire insurance / yr
- $717 – $1,331
Heat risk 2/10 · Minimal
- Hot days now (above 99°F)
- 7 days/yr
- Hot days in 30 yrs
- 16 days/yr
Wind risk 2/10 · Minimal
- Chance of severe wind over 30 yrs
- —
Air-quality risk 3/10 · Minor
- Unhealthy air days now
- 3 days/yr
- Unhealthy air days in 30 yrs
- 3 days/yr
Risk factors via First Street. Map © Google.
Why this score? — see what drove the B+ grade
The composite is a weighted blend of 9 inputs, each scored 0–100. Each bar is that input's sub-score; the figure is the points it added to the 100-point composite (weight × sub-score).
- Cash flow +30.0/30.0
- ARV discount +15.0/15.0
- 1% rule +10.0/10.0
- DSCR +10.0/10.0
- Rent growth +4.2/5.0
- Livability +3.2/5.0
- Condition / age +2.5/5.0
- Schools +1.4/10.0
- Appreciation +0.0/10.0
$74,900
🖨 Deal sheet (PDF) 📄 Offer letter ✓ Due diligence
Listing remarks
Investor Opportunity or Affordable Owner-Occupant Home! Welcome to 710 Laporte Avenue, a solid home with a strong rental history and plenty of potential. Whether you're looking to add a proven income-producing property to your portfolio or searching for a home you can personalize over time, this property offers excellent flexibility. The home can be enjoyed as-is, while also providing an opportunity for updates and improvements to match your style and vision. A detached garage offers additional storage, parking, or workspace, adding to the property's functionality. Conveniently located near downtown South Bend, you'll enjoy easy access to shopping, dining, and entertainment. With its combin
Key facts
- Value-add potential
- Detached garage
- 5,227 sq ft lot
Tags
Property features AI
Finance
- Other: Property listed with At Home Realty Group
Exterior
- Parking: Detached 1-car garage
- Utilities: Public water; Public sewer
- Home design: Single-family residence; Site-built home; Single-story
- Construction: Aluminum siding
- Exterior features: Lot dimensions approximately 43 x 124; Lot size about 0.12 acre
Interior
- Kitchen: Gas range; Refrigerator
- Bedrooms: Total rooms: 8; Laundry on main level
- Bathrooms: 1 full bathroom (main level)
- Heating & cooling: Forced air heating; No central air
- Interior features: Refrigerator; Gas range; Unfinished basement
- Laundry & utility: Main-level laundry
Neighborhood map
What this means for you Summary
Snapshot
- This is a 2-bed/1.0-bath single-family listed at $75k.
Deal economics
- At list price, monthly cash flow is $388 ($5k/yr) — positive.
- The deal already cash-flows at list — no discount required.
- Meets the 1% rule at list price ($1k rent vs $75k).
- Cap rate 12.5% vs local median 4.4% in South Bend — top-decile yield for the area; either an underpriced asset or a hidden risk that comps aren't pricing in. Stress-test before assuming the spread holds.
Location & tenants
- Location reads 64/100 on livability (#365 in IN) — a middle-class / working-renter tenant base. Strengths: cost of living A+, housing A+, health & safety A+; Watch: amenities D, employment D, crime F.
- South Bend Community School Corporation (urban): math 12% / reading 21% proficiency, ranked #284 of 301 in IN (top 94%) — low school quality limits family demand, transient renter base, plan for 1-2y turnover; 66% free/reduced lunch — lower-income household profile, screen leases tightly.
- Zoned schools: Madison S.T.E.A.M. Academy (math 2% / reading 2%, grade F, #994 of 994 statewide, top 100%, 618 students, 93% FRL); Lasalle Academy (math 23% / reading 53%, grade F, #136 of 330 statewide, top 44%, 488 students, 56% FRL); Riley High School (math 19% / reading 46%, grade F, #293 of 369 statewide, top 80%, 992 students, 67% FRL).
- Market conditions: Rents rising fast (+6.8%/yr); 424 active listings in the ZIP; 35 comparable units currently listed for rent nearby; rentals at typical pace (median 23d on market — plan ~3-4 weeks tenant-placement turnaround); 754 units permitted in St. Joseph County in 2024 (460 in 5+ unit buildings).
Forward outlook
- Local home prices are declining (-3.0%/yr); year-one equity from $518 of loan paydown is wiped out by about $2k of value loss. Plan a longer hold.
- At projected returns (-3.0% appreciation + 6.8% rent growth), your $21k cash investment doubles in ~5 years — after that, you're playing with house money.
Negotiation context
- Only 10 days on market — expect competitive offers; lowballing is unlikely to land.
- 5 sale attempts since 8y ago with the ask held roughly flat each time — persistent listings suggest the price (not the market) is what's stuck; bring a comps-based counter.
- Current owner paid $28k; list at $75k implies a 172% gain — meaningful room to come down on a strong offer.
Risks & watch-outs
- Watch-outs: property tax is 2.6% of price; built in 1895 — expect roof / HVAC / electrical / plumbing capex.
Questions for the listing agent
- Built in 1895 — when were the roof, HVAC, electrical panel, plumbing, and water heater last replaced?
- Property tax is high relative to price — has the assessment been appealed recently, and will the sale trigger a re-assessment?
- Is there a deadline driving the sale (1031 exchange, divorce, estate, relocation)? That informs how much negotiation room exists.
- Schools are F-rated, which usually means shorter tenancies and higher turnover. Who's the typical renter profile here, and what's been the actual vacancy rate?
- Crime grade is F in this area — have there been break-ins, vandalism, or insurance claims at this property in the last 3 years? What carrier currently insures it and at what premium?
- What's the average days-on-market for RENTAL listings here right now (not sales)? A rising rental-DOM trend means longer vacancies and softer asking-rent achievability than the comps imply.
- What's the recent tenant-quality profile in this submarket — average credit score on applications, eviction rate, late-payment / NSF rate, and stable-employment percentage? A property-management company in the area should have these aggregated.
- How much new for-sale + rental construction is in the pipeline within 1–3 miles? Heavy new supply typically softens prices + rents 12–24 months out; constrained supply supports both.
Investment metrics
- 1% rule
- 1.65% ✓
- Cap rate
- 12.52%
- Cash-on-cash
- 22.22%
- DSCR
- 1.99
- GRM
- 5.1
CMA / ARV
- ARV (on-the-fly)
- $112,896
- Comps found
- 12
Show comp detail 12 sales within ~0.75 mi
| Address | Dist | Beds/Ba | Sqft | Sold | Price | $/sf | Match |
|---|---|---|---|---|---|---|---|
| 722 Johnson St | 0.29mi | 2/1.0 | 892 (-0%) | 0mo | $65,000 | $73 | 85 |
| 925 Sancome Ave | 0.23mi | 3/1.0 (+1) | 864 (-4%) | 1mo | $108,000 | $125 | 78 |
| 1118 N Brookfield St | 0.45mi | 2/1.0 | 864 (-4%) | 1mo | $159,900 | $185 | 72 |
| 1521 Van Buren St | 0.18mi | 2/1.0 | 792 (-12%) | 1mo | $60,000 | $76 | 72 |
| 1133 Wilber St | 0.43mi | 2/1.0 | 842 (-6%) | 3mo | $138,000 | $164 | 67 |
| 1119 College St | 0.44mi | 3/1.0 (+1) | 960 (+7%) | 3mo | $121,000 | $126 | 60 |
| 1322 Johnson St | 0.65mi | 2/2.0 | 912 (+2%) | 3mo | $72,500 | $79 | 60 |
| 1133 N Brookfield St | 0.49mi | 2/1.0 | 792 (-12%) | 0mo | $112,900 | $143 | 57 |
| 1134 College St | 0.45mi | 2/1.0 | 792 (-12%) | 3mo | $115,600 | $146 | 57 |
| 1501 N Adams St | 0.75mi | 2/1.0 | 840 (-6%) | 0mo | $134,900 | $161 | 54 |
| 1122 Fremont St | 0.71mi | 3/1.0 (+1) | 1,008 (+12%) | 2mo | $120,000 | $119 | 39 |
| 1414 Wilber St | 0.71mi | 3/1.0 (+1) | 1,020 (+14%) | 0mo | $118,000 | $116 | 38 |
Match score weights: distance 35% · size 25% · config 20% · recency 20%. Top-matched comps best support the ARV.
Projected returns pro-forma
-3.0% appreciation · 6.78% rent growth · sell at horizon
- IRR
- 19.6%
- Equity multiple
- 1.84×
- Total profit
- $17,533
- Equity at exit
- $11,168
- IRR
- 30.5%
- Equity multiple
- 4.29×
- Total profit
- $68,981
- Equity at exit
- $6,476
Cash invested: $20,972 (down + closing). Projections, not guarantees.
Landlord ↔ Tenant lean methodology
- Overall (STATE)
- 90 Strongly Landlord-Friendly
- State Indiana
- 90 Strongly Landlord-Friendly · R+11
- County
- — inherits STATE
- City
- — inherits STATE
ZIP-level market 46628
- Rents YoY
- 6.8%
- Active inventory
- 424
- Price-to-rent
- 5.1×
Monthly cashflow live
- Estimated rent
- $1,234 high interval (Pro) →
- Mortgage (P&I)
- −$393
- Tax from tax record
- −$163 /mo · $1,952/yr
- Insurance
- −$31
- HOA
- −$0
- Vacancy / Maint / Mgmt
- −$259
- Net cashflow
- $388
Break-even live
Sensitivity live
| Price | -10% $431 | -5% $410 | +0% $388 | +5% $367 | +10% $346 |
|---|---|---|---|---|---|
| Rent | -10% $291 | -5% $340 | +0% $388 | +5% $437 | +10% $486 |
| Rate | -1.0pp $426 | -0.5pp $407 | base $388 | +0.5pp $369 | +1.0pp $349 |
UW: 25.0% down · 7.5% · 30yr · 1.5% tax · 5.0% vac · 8.0% maint · 8.0% mgmt
Financing live
Cash to close
- Down payment
- $18,725
- Closing costs
- $2,247
- Reserves months
- —
- Total cash needed
- —
Loan-product check · same deal, 3 products live
Conventional
25% down · 7.5% · 30yr
- Down + closing
- —
- Monthly P&I
- —
- Monthly cashflow
- —
- DSCR
- —
- Eligible?
- —
Personal DTI + credit; lowest rate.
DSCR
20% down · 8.5% · 30yr
- Down + closing
- —
- Monthly P&I
- —
- Monthly cashflow
- —
- DSCR
- —
- Eligible?
- —
No personal income docs; deal must DSCR.
Hard money
10% down · 12.0% · 12mo
- Down + closing
- —
- Monthly P&I
- —
- Monthly cashflow
- —
- DSCR
- —
- Eligible?
- —
Short-term bridge; refi at stabilization.
Rent comps 35 comps
| Address | Beds | Baths | Sqft | Rent | $/sqft | DOM | Units | Dist |
|---|---|---|---|---|---|---|---|---|
| 736 Lawndale Ave Unit 1 South Bend, IN | 3.0 | 1.0 | 1072 | $1,200 | $1.12 | 15d | 1 | 0.13mi |
| 910 Allen St South Bend, IN | 3.0 | 1.0 | 1100 | $1,350 | $1.23 | 22d | 1 | 0.43mi |
| 717 Huey St South Bend, IN | 2.0 | 1.0 | 672 | $1,050 | $1.56 | 45d | 1 | 0.44mi |
| 729 N Elmer St South Bend, IN | 2.0 | 1.0 | 672 | $1,100 | $1.64 | 15d | 1 | 0.50mi |
| 1237 Wilber St South Bend, IN | 2.0 | 1.0 | 880 | $1,200 | $1.36 | 45d | 1 | 0.55mi |
| 1046 N Elmer St South Bend, IN | 2.0 | 1.0 | 1050 | $1,025 | $0.98 | 22d | 1 | 0.59mi |
| 1201 Woodward Ave South Bend, IN | 2.0 | 1.0 | 960 | $1,675 | $1.74 | 45d | 1 | 0.64mi |
| 2417 Linden Ave South Bend, IN | 2.0 | 1.0 | 1000 | $1,200 | $1.20 | 45d | 1 | 0.65mi |
| 1314 Johnson St South Bend, IN | 2.0 | 1.0 | 902 | $1,150 | $1.27 | 15d | 1 | 0.65mi |
| 1141 Fremont St South Bend, IN | 3.0 | 1.0 | 760 | $1,100 | $1.45 | 22d | 1 | 0.76mi |
| 2013 Elwood Ave South Bend, IN | 3.0 | 1.0 | 720 | $999 | $1.39 | 45d | 1 | 0.77mi |
| 1428 Kessler Blvd South Bend, IN | 3.0 | 1.0 | 936 | $1,000 | $1.07 | 45d | 1 | 0.82mi |
| 1214 Queen St South Bend, IN | 3.0 | 1.0 | 1056 | $1,300 | $1.23 | 15d | 1 | 0.87mi |
| 1505 Huey St South Bend, IN | 3.0 | 1.0 | 864 | $1,425 | $1.65 | 22d | 1 | 0.88mi |
| 1308 Kinyon St South Bend, IN | 2.0 | 1.0 | 700 | $1,100 | $1.57 | 45d | 1 | 0.91mi |
| 1630 Obrien St South Bend, IN | 3.0 | 1.0 | 1120 | $1,400 | $1.25 | 15d | 1 | 0.94mi |
| 1710 Johnson St South Bend, IN | 3.0 | 1.0 | 1000 | $1,350 | $1.35 | 45d | 1 | 1.00mi |
| 1614 Fremont St South Bend, IN | 2.0 | 1.0 | 720 | $850 | $1.18 | 22d | 1 | 1.03mi |
| 344 Parkovash Ave South Bend, IN | 3.0 | 1.0 | 950 | $1,900 | $2.00 | 15d | 1 | 1.04mi |
| 2823 Calhoun St South Bend, IN | 2.0 | 1.0 | 720 | $1,249 | $1.73 | 45d | 1 | 1.04mi |
| 1709 Huey St South Bend, IN | 2.0 | 1.0 | 720 | $995 | $1.38 | 22d | 1 | 1.06mi |
| 208 S Bendix Dr South Bend, IN | 3.0 | 1.0 | 864 | $1,150 | $1.33 | 22d | 1 | 1.08mi |
| 125 W Marion St South Bend, IN | 2.0 | 1.0 | 672 | $1,350 | $2.01 | 15d | 5 | 1.12mi |
| 1317 Poland St South Bend, IN | 3.0 | 1.0 | 1100 | $1,300 | $1.18 | 22d | 1 | 1.14mi |
| 937 Roosevelt St South Bend, IN | 2.0 | 1.0 | 720 | $1,060 | $1.47 | 45d | 1 | 1.14mi |
| 1033 Beale St South Bend, IN | 3.0 | 1.0 | 840 | $1,250 | $1.49 | 22d | 1 | 1.17mi |
| 3224 Ardmore Trl South Bend, IN | 1.0 | 1.0 | 675 | $864 | $1.28 | 15d | 2 | 1.17mi |
| 211 W Washington St South Bend, IN | 3.0 | 1.0–2.5 | 1162 | $5,399 | $4.64 | 22d | 19 | 1.18mi |
| 929 Beale St South Bend, IN | 2.0 | 1.0 | 720 | $975 | $1.35 | 45d | 1 | 1.21mi |
| 453 S Kaley St Unit 1 South Bend, IN | 2.0 | 1.0 | 1100 | $1,050 | $0.95 | 45d | 1 | 1.22mi |
| 1301 N Michigan St South Bend, IN | 1.0 | 1.0 | 575 | $740 | $1.29 | 22d | 1 | 1.27mi |
| 307 E Lasalle Ave South Bend, IN | 1.0–2.0 | 1.0–2.0 | 925 | $1,670 | $1.80 | 15d | 22 | 1.34mi |
| 300 E Lasalle Ave South Bend, IN | 3.0 | 1.0–3.0 | 1013 | $2,409 | $2.38 | 15d | 31 | 1.39mi |
| 716 N Niles Ave South Bend, IN | 1.0–2.0 | 1.0–2.0 | 732 | $1,750 | $2.39 | 15d | 11 | 1.46mi |
| 421 S Lake St South Bend, IN | 2.0 | 1.0 | 900 | $1,200 | $1.33 | 45d | 1 | 1.50mi |
Listing history 8 events
-
2026-06-15statusdays on market $74,900 Pending 10 DOM
-
2026-06-14days on market $74,900 Active 9 DOM
-
2026-06-13days on market $74,900 Active 8 DOM
-
2026-06-10days on market $74,900 Active 6 DOM
-
2026-06-09days on market $74,900 Active 5 DOM
-
2026-06-08days on market $74,900 Active 4 DOM
-
2026-06-07remarks 699-char remark
-
2026-06-07$74,900 Active 3 DOM
ⓘ Source: listings_history table (triggers on properties + properties_extension) + one-shot
backfill from property_details.listing_events for pre-trigger history.
Tax reassessment forecast IN · Partial reset (capped growth)
- Current annual tax
- $1,952 · $163/mo
- Projected year-2 tax
- $1,952 · $163/mo
- Expected delta
- $0/yr ($0/mo · 0.0%)
ⓘ Screening estimate from a state-policy table — verify with the county assessor before closing.
Climate risk First Street
- Flood 1/10 Low FEMA zone X (unshaded) · 0% chance over 30 yrs
- Wildfire 1/10 Low
- Heat 2/10 Low 7 d/yr ≥99°F today · 16 d/yr by 30 yrs out
- Wind 2/10 Low
- Air quality 3/10 Moderate 3 unhealthy d/yr today · 3 by 30 yrs out
Nearby sold comps map
Loading sold comps map…
Walkable amenities ~0.75 mi
Loading nearby amenities…
Taxation est. · year 1
- Rental income
- $14,811
- − Mortgage interest
- −$4,196
- − Property taxes
- −$1,952
- − Insurance
- −$374
- − Repairs & maintenance
- −$1,185
- − Management
- −$1,185
- − Depreciation
- −$2,179
- Taxable income
- $3,740
- Est. tax owed @ 24.0%
- −$898
- After-tax cash flow
- $3,763/yr
For passive investors: Depreciation is non-cash, so a rental often shows a tax loss while cash-flowing — sheltering income. Rental losses are passive: they offset passive income freely, and up to $25,000/yr can offset ordinary (W-2) income if you actively participate and your MAGI is under $100k (phasing out to $0 by $150k); unused losses carry forward. On sale, claimed depreciation is recaptured at up to 25%, and gains may owe capital-gains tax (a 1031 exchange can defer both). Figures are a year-1 estimate at your 24.0% rate — not tax advice; consult a CPA.
Schools (NCES district)
- District
- South Bend Community School Corporation
- NCES district ID
- 1810290
- Math proficiency
- 12% ▼ -10.00%
- Reading proficiency
- 21% ▼ -6.00%
- Median HH income
- $41,935
- Composite
- 14.21/100
- National rank
- #9452
- State rank
- #284 of 301 in IN
Livability — South Bend
- Score
- 64/100
- State rank
- #365
- US rank
- #13730
Category grades
Schools grade is shown separately in the Schools card above.
Census & demographics
- Census place
- South Bend, IN
- County
- Saint Joseph County · 189,048 people
- City population
- 99,767
- Metro
- South Bend-Mishawaka, IN-MI
- Population (ZIP)
- 27,685
- Household income
- $61,759
- Rent vs Own
- Severe rent burden
- 1024.0
Population outlook (St. Joseph County) Hauer SSP2
- Today (2025)
- 273,186 people
- By 2030
- 273,594 · +0.1%
- By 2040
- 271,641 · -0.6%
- By 2050
- 269,187 · -1.5%
- By 2075
- 263,136 · -3.7%
- By 2100
- 245,659 · -10.1%
Race, ethnicity, and origin ACS 2023
- Neighborhood character
- Diverse neighborhood (Simpson 0.60)
- Race & ethnicity
- White 55% Black 30% Hispanic / Latino 10% Two or more races 8%
- Hispanic origin (detail)
- Mexican 8%
- Common ancestry
- Romanian 12% Lithuanian 1% Slovak 1%
- Foreign-born
- 7% · Canada, China
- Languages at home
- 89% English-only · Spanish 7% Russian/Polish/Slavic 1%
Political lean MEDSL · St. Joseph
- 2024 margin
- Toss-up / Even · D 50.0% · R 48.5% · Other 1.5%
- 2008→2024 swing
- -15.6pp toward R · 2008: 17.1pp · 2024: 1.5pp
- All cycles
- 2024: D+1.5 2020: D+5.8 2016: D+0.2 2012: D+3.5 2008: D+17.1
Not yet ingested
- Civics
- —
Market trends
- HPI YoY
- ▼ -130.47%
- Current HPI
- 202.112
- Rent YoY
- ▲ 6.78%
- Metro
- South Bend-Mishawaka, IN-MI
- State GDP YoY
- ▲ 2.90%
- F500 in state
- 18
Industry mix (Fortune 500 HQ in IN)
| Industry | F500 HQs | Revenue |
|---|---|---|
| Industrial Machinery | 2 | $37B |
|
||
| Healthcare | 1 | $177B |
|
||
| Pharmaceuticals | 1 | $45B |
|
||
| Metals / Steel | 1 | $18B |
|
||
| Agriculture | 1 | $17B |
|
||
| Packaging | 1 | $12B |
|
||
Price history
+36.4% since first listed6 events — show timeline
- 2026-06-04 Listed $74,900 IRMLS
- 2019-07-02 Sold (MLS) $27,500 IRMLS
- 2019-05-15 Listed $29,900 IRMLS
- 2018-12-28 Listed $27,900 IRMLS
- 2018-07-01 Listed $38,000 IRMLS
- 2018-02-16 Listed $54,900 IRMLS
Property tax history
-2.3%/yrLatest (2024): $1,952 · +59.9% YoY. Source: county tax records.
Cash-flow waterfall
monthlySold comps — $/sqft
last 12 mo · ≤1 miLoading sold comps…