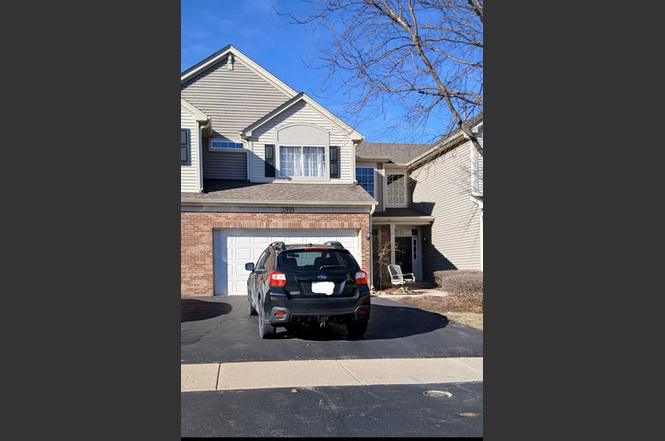
3919 Pratt St · Plano, IL
Flood risk 1/10 · Minimal
- FEMA flood zone
- X (unshaded)
- Chance of flooding over 30 yrs
- 0.0%
- Est. flood insurance / yr
- $507 – $1,088
Fire risk 1/10 · Minimal
- Est. fire insurance / yr
- $804 – $1,492
Heat risk 3/10 · Minor
- Hot days now (above 102°F)
- 7 days/yr
- Hot days in 30 yrs
- 15 days/yr
Wind risk 2/10 · Minimal
- Chance of severe wind over 30 yrs
- 1.0%
Air-quality risk 2/10 · Minimal
- Unhealthy air days now
- 1 days/yr
- Unhealthy air days in 30 yrs
- 2 days/yr
Risk factors via First Street. Map © Google.
Why this score? — see what drove the D- grade
The composite is a weighted blend of 9 inputs, each scored 0–100. Each bar is that input's sub-score; the figure is the points it added to the 100-point composite (weight × sub-score).
- Cash flow +11.2/30.0
- ARV discount +7.5/15.0
- 1% rule +6.0/10.0
- Livability +3.7/5.0
- DSCR +3.3/10.0
- Schools +2.7/10.0
- Rent growth +2.5/5.0
- Condition / age +2.5/5.0
- Appreciation +0.0/10.0
$219,000
🖨 Deal sheet 📄 Offer letter ✓ Due diligence
Listing remarks
APPROVED SHORT SALE! This well-located 3-bedroom, 2.5-bath townhome offers a rare opportunity for first-time buyers or investors to add value with simple cosmetic updates. The spacious layout includes a bright main level and generously sized bedrooms, giving you plenty of room to grow. A large attached 2-car garage provides convenience, storage, and added appeal for future tenants or owners. The home needs some attention to the HVAC and fresh cosmetic touches, making it an ideal option for anyone who wants to build instant equity. Enjoy a prime location close to shopping, dining, schools, and major commuter routes. The rental-friendly community makes this a strong investment opportunity wit
Key facts
- Bright main level
- Prime location
- $236 HOA
Tags
Property features AI
Finance
- Other: Living area sourced from assessor; Parcel number available
- Financial info: Special service area applies
- HOA & community: HOA fee $196 per month; Master association fee $40 per month; HOA covers insurance, clubhouse, pool, lawn care, and snow removal; Pets allowed (cats and dogs); pet policy allows larger pets
Exterior
- Parking: Attached garage (2 spaces); Two total parking spaces
- Utilities: Public water; Public sewer
- Home design: Attached single property; Townhouse — 2 story; Entry level is 1; Fee simple ownership with homeowners association; Approximately 16–20 years old; Not rebuilt or rehabbed; Located within Plano corporate limits, Little Rock township
- Construction: Vinyl siding construction
- Exterior features: Vinyl siding
Interior
- Kitchen: Kitchen on main level (11 x 10)
- Bedrooms: Master bedroom on the second floor (16 x 12) with a full bath; Second bedroom on the second floor (13 x 11); Third bedroom on the second floor (9 x 12)
- Bathrooms: Two full bathrooms; One half bathroom
- Heating & cooling: Natural gas heating; Central air conditioning
- Interior features: Six total rooms; School bus service available
- Laundry & utility: Laundry room on the second floor (3 x 6)
Neighborhood map
What this means for you Summary
Snapshot
- This is a 3-bed/2.5-bath condo listed at $219k.
Deal economics
- At list price, monthly cash flow is $-85 ($-1k/yr) — negative.
- To cash-flow at today's rent, offer at most $204k (6.8% below list).
- Meets the 1% rule at list price ($2k rent vs $219k).
- Recommended offer: $199k (9.0% below list) — sets the bar for market timing.
- Cap rate 5.8% vs local median 3.2% in Plano — top-decile yield for the area; either an underpriced asset or a hidden risk that comps aren't pricing in. Stress-test before assuming the spread holds.
Location & tenants
- Location reads 74/100 on livability (#238 in IL, #4,373 nationally) — a middle-class / working-renter tenant base. Strengths: crime A+, housing A+, health & safety A+; Watch: schools F, amenities F, commute F.
- Plano CUSD 88 (suburban): math 24% / reading 28% proficiency, ranked #553 of 919 in IL (top 60%) — low school quality limits family demand, transient renter base, plan for 1-2y turnover.
- Market conditions: 29 active listings in the ZIP; 12 comparable units currently listed for rent nearby; rentals at typical pace (median 16d on market — plan ~3-4 weeks tenant-placement turnaround); 706 units permitted in Kendall County in 2024 (263 in 5+ unit buildings).
Forward outlook
- Local home prices are declining (-3.0%/yr); year-one equity from $2k of loan paydown is wiped out by about $7k of value loss. Plan a longer hold.
- Kendall County population projected at +20% by 2050 — long-run rental-demand tailwind backs the buy-and-hold thesis.
Negotiation context
- It's been on market 100 days — a 9% lower offer ($199k) is reasonable based on typical stale-listing flexibility.
- 2 sale attempts since 17y ago; this cycle's ask is 7% above the opening price — seller raised mid-cycle; expect resistance to lowballs.
Risks & watch-outs
- Watch-outs: property tax is 2.8% of price.
Questions for the listing agent
- What do current leases actually rent for vs. the listed asking? Can we see a recent rent roll and the last 12 months of T-12 income?
- It's been on market 100 days. Have you received any prior offers? Is the seller open to a 9% concession, seller financing, or rate buy-down credit?
- Property tax is high relative to price — has the assessment been appealed recently, and will the sale trigger a re-assessment?
- What does the HOA fee cover, when was the last increase, and are there any pending special assessments or reserve-fund shortfalls?
- Any open or pending special assessments — roof, HVAC, plumbing, elevator, façade? What's the per-unit balance and payoff schedule, and is the seller paying it off at close or rolling it to the buyer?
- Why hasn't it sold? Are there any deal-killer items the seller is aware of (foundation, flood, title, zoning, code violations)?
- Is there a deadline driving the sale (1031 exchange, divorce, estate, relocation)? That informs how much negotiation room exists.
- Schools are F-rated, which usually means shorter tenancies and higher turnover. Who's the typical renter profile here, and what's been the actual vacancy rate?
- The area grade is low — what's the realistic commute time and amenity access for the typical tenant pool here? Any planned neighborhood developments (good or bad) we should know about?
- What's the average days-on-market for RENTAL listings here right now (not sales)? A rising rental-DOM trend means longer vacancies and softer asking-rent achievability than the comps imply.
- What's the recent tenant-quality profile in this submarket — average credit score on applications, eviction rate, late-payment / NSF rate, and stable-employment percentage? A property-management company in the area should have these aggregated.
- How much new apartment / multifamily construction is in the pipeline within 1–3 miles? Heavy new supply (>2% of stock underway) typically softens rents 12–24 months out; light construction supports rent growth.
Investment metrics
- 1% rule
- 1.10% ✓
- Cap rate
- 5.83%
- Cash-on-cash
- -1.66%
- DSCR
- 0.93
- GRM
- 7.6
CMA / ARV
No comps found within radius.
Projected returns pro-forma
-3.0% appreciation · 3.0% rent growth · sell at horizon
- IRR
- -18.8%
- Equity multiple
- 0.34×
- Total profit
- $-40,552
- Equity at exit
- $32,654
- IRR
- -11.0%
- Equity multiple
- 0.33×
- Total profit
- $-40,923
- Equity at exit
- $18,935
Cash invested: $61,320 (down + closing). Projections, not guarantees.
Landlord ↔ Tenant lean methodology
- Overall (STATE)
- 43 Moderately Tenant-Leaning
- State Illinois
- 43 Moderately Tenant-Leaning · D+7
- County
- — inherits STATE
- City
- — inherits STATE
ZIP-level market 60545
- Home prices YoY
- -34.8%
- Active inventory
- 29
- Price-to-rent
- 7.6×
Monthly cashflow live
- Estimated rent
- $2,409 high interval (Pro) →
- Mortgage (P&I)
- −$1,148
- Tax from tax record
- −$512 /mo · $6,147/yr
- Insurance
- −$91
- HOA
- −$236
- Vacancy / Maint / Mgmt
- −$506
- Net cashflow
- $-85
Break-even live
UW: 25.0% down · 7.5% · 30yr · 1.5% tax · 5.0% vac · 8.0% maint · 8.0% mgmt
Financing live
Cash to close
- Down payment
- $54,750
- Closing costs
- $6,570
- Reserves months
- —
- Total cash needed
- —
Loan-product check · same deal, 3 products live
Conventional
25% down · 7.5% · 30yr
- Down + closing
- —
- Monthly P&I
- —
- Monthly cashflow
- —
- DSCR
- —
- Eligible?
- —
Personal DTI + credit; lowest rate.
DSCR
20% down · 8.5% · 30yr
- Down + closing
- —
- Monthly P&I
- —
- Monthly cashflow
- —
- DSCR
- —
- Eligible?
- —
No personal income docs; deal must DSCR.
Hard money
10% down · 12.0% · 12mo
- Down + closing
- —
- Monthly P&I
- —
- Monthly cashflow
- —
- DSCR
- —
- Eligible?
- —
Short-term bridge; refi at stabilization.
Rent comps 12 comps
| Address | Beds | Baths | Sqft | Rent | $/sqft | DOM | Units | Dist |
|---|---|---|---|---|---|---|---|---|
| 3900 Pratt St Plano, IL | 3.0 | 2.5 | 1690 | $2,660 | $1.57 | 1d | 1 | 0.05mi |
| 3864 Munson St Plano, IL | 2.0 | 2.5 | 1740 | $2,200 | $1.26 | 3d | 1 | 0.05mi |
| 3740 Pope Ct Unit 740-4 Plano, IL | 3.0 | 2.5 | 1585 | $2,495 | $1.57 | 15d | 1 | 0.07mi |
| 3740 Pope Ct Unit 740-4 Plano, IL | 3.0 | 2.5 | 1585 | $2,495 | $1.57 | 44d | 1 | 0.07mi |
| 3740 Pope Ct Plano, IL | 3.0 | 2.0 | 1585 | $2,395 | $1.51 | 1d | 1 | 0.08mi |
| 4409 Klatt St Plano, IL | 3.0 | 2.5 | 1382 | $2,150 | $1.56 | 1d | 1 | 0.34mi |
| 2804 Sarah Ct Plano, IL | 3.0 | 2.5 | 1768 | $2,250 | $1.27 | 15d | 1 | 0.57mi |
| 310 Waubonsee Dr Plano, IL | 3.0 | 2.5 | 1768 | $2,095 | $1.18 | 20d | 1 | 0.81mi |
| 3224 Hoffman St Plano, IL | 2.0 | 1.5 | 925 | $1,900 | $2.05 | 6d | 1 | 0.89mi |
| 407 Waubonsee Dr Plano, IL | 3.0 | 2.5 | 1623 | $2,350 | $1.45 | 1d | 1 | 0.90mi |
| 1325 Chestnut Ln Yorkville, IL | 2.0 | 2.5 | 1200 | $2,150 | $1.79 | 44d | 1 | 1.36mi |
| 1216 Gillespie Ln Yorkville, IL | 3.0 | 2.5 | 1696 | $2,750 | $1.62 | 44d | 1 | 1.39mi |
HOA detail condo
- Monthly dues
- $236 · $2,832/yr
- Assessments
- None detected in remarks — confirm with the listing agent.
Listing history 20 events
-
2026-06-18days on market $219,000 Active 100 DOM
-
2026-06-17pricestatus $219,000 Active 99 DOM
-
2026-06-17days on market $220,000 Contingent - No Showings 99 DOM
-
2026-06-16days on market $220,000 Contingent - No Showings 98 DOM
-
2026-06-15days on market $220,000 Contingent - No Showings 97 DOM
-
2026-06-13days on market $220,000 Contingent - No Showings 95 DOM
-
2026-06-09days on market $220,000 Contingent - No Showings 91 DOM
-
2026-06-08days on market $220,000 Contingent - No Showings 90 DOM
-
2026-06-07days on market $220,000 Contingent - No Showings 89 DOM
-
2026-06-04days on market $220,000 Contingent - No Showings 86 DOM
-
2026-06-03days on market $220,000 Contingent - No Showings 85 DOM
-
2026-06-02days on market $220,000 Contingent - No Showings 84 DOM
-
2026-06-01days on market $220,000 Contingent - No Showings 83 DOM
-
2026-05-31days on market $220,000 Contingent - No Showings 82 DOM
-
2026-03-18historical Contingent - No Showings
-
2026-03-10$205,000 Active
-
2026-03-09historical
-
2026-01-31price
-
2009-03-26historical
-
2009-02-15
ⓘ Source: listings_history table (triggers on properties + properties_extension) + one-shot
backfill from property_details.listing_events for pre-trigger history.
Tax reassessment forecast IL · Partial reset (capped growth)
- Current annual tax
- $6,147 · $512/mo
- Projected year-2 tax
- $6,147 · $512/mo
- Expected delta
- $0/yr ($0/mo · 0.0%)
ⓘ Screening estimate from a state-policy table — verify with the county assessor before closing.
Climate risk First Street
- Flood 1/10 Low FEMA zone X (unshaded) · 0% chance over 30 yrs
- Wildfire 1/10 Low
- Heat 3/10 Moderate 7 d/yr ≥102°F today · 15 d/yr by 30 yrs out
- Wind 2/10 Low 100% chance of damaging wind over 30 yrs
- Air quality 2/10 Low 1 unhealthy d/yr today · 2 by 30 yrs out
Nearby sold comps map
Loading sold comps map…
Walkable amenities ~0.75 mi
Loading nearby amenities…
Taxation est. · year 1
- Rental income
- $28,911
- − Mortgage interest
- −$12,267
- − Property taxes
- −$6,147
- − Insurance
- −$1,095
- − Repairs & maintenance
- −$2,313
- − Management
- −$2,313
- − HOA
- −$2,832
- − Depreciation
- −$6,371
- Taxable loss
- −$4,427
- Est. tax savings @ 24.0%
- +$1,063
- After-tax cash flow
- $47/yr
For passive investors: Depreciation is non-cash, so a rental often shows a tax loss while cash-flowing — sheltering income. Rental losses are passive: they offset passive income freely, and up to $25,000/yr can offset ordinary (W-2) income if you actively participate and your MAGI is under $100k (phasing out to $0 by $150k); unused losses carry forward. On sale, claimed depreciation is recaptured at up to 25%, and gains may owe capital-gains tax (a 1031 exchange can defer both). Figures are a year-1 estimate at your 24.0% rate — not tax advice; consult a CPA.
Schools (NCES district)
- District
- Plano CUSD 88
- NCES district ID
- 1731770
- Math proficiency
- 24% ▲ 2.00%
- Reading proficiency
- 28% ▲ 5.00%
- Median HH income
- $56,844
- Composite
- 26.53/100
- National rank
- #12619
- State rank
- #553 of 919 in IL
Livability — Plano
- Score
- 74/100
- State rank
- #238
- US rank
- #4373
Category grades
Schools grade is shown separately in the Schools card above.
Census & demographics
- Census place
- Plano, IL
- City population
- 14,191
- Population (ZIP)
- 14,191
Population outlook (Kendall County) Hauer SSP2
- Today (2025)
- 138,283 people
- By 2030
- 144,935 · +4.8%
- By 2040
- 156,944 · +13.5%
- By 2050
- 165,424 · +19.6%
- By 2075
- 174,715 · +26.3%
- By 2100
- 168,523 · +21.9%
Race, ethnicity, and origin ACS 2023
- Neighborhood character
- Majority White (59%)
- Race & ethnicity
- White 59% Hispanic / Latino 34% Two or more races 19% Black 4%
- Hispanic origin (detail)
- Mexican 26% Puerto Rican 2%
- Common ancestry
- Romanian 7% Italian 4% Portuguese 4%
- Foreign-born
- 12% · Canada, Jamaica
- Languages at home
- 74% English-only · Spanish 23% Tagalog/Filipino 2%
Political lean MEDSL · Kendall
- 2024 margin
- Toss-up / Even · D 50.0% · R 48.5% · Other 1.6%
- 2008→2024 swing
- -5.7pp toward R · 2008: 7.2pp · 2024: 1.5pp
- All cycles
- 2024: D+1.5 2020: D+5.7 2016: R+1.5 2012: R+4.1 2008: D+7.2
Not yet ingested
- Civics
- —
Market trends
- HPI YoY
- ▼ -111.48%
- Current HPI
- 209.3485
- Rent YoY
- —
- Metro
- —
- State GDP YoY
- ▲ 1.59%
- F500 in state
- 60
Industry mix (Fortune 500 HQ in IL)
| Industry | F500 HQs | Revenue |
|---|---|---|
| Insurance | 4 | $201B |
|
||
| Consumer Goods | 4 | $87B |
|
||
| Industrial Machinery | 3 | $64B |
|
||
| Healthcare | 2 | $55B |
|
||
| Retail / Pharmacy | 1 | $148B |
|
||
| Agriculture / Food | 1 | $86B |
|
||
Price history
6 events — show timeline
- 2026-03-18 Contingent — MRED as Distributed by MLS Grid
- 2026-03-10 Listed $205,000 MRED as Distributed by MLS Grid
- 2026-03-09 Listing Removed — MRED as Distributed by MLS Grid
- 2026-01-31 Price Changed — MRED as Distributed by MLS Grid
- 2009-03-26 Listing Removed — MRED as Distributed by MLS Grid
- 2009-02-15 Listed — MRED as Distributed by MLS Grid
Property tax history
+7.1%/yrLatest (2024): $6,147 · +3.7% YoY. Source: county tax records.
Cash-flow waterfall
monthlySold comps — $/sqft
last 12 mo · ≤1 miLoading sold comps…