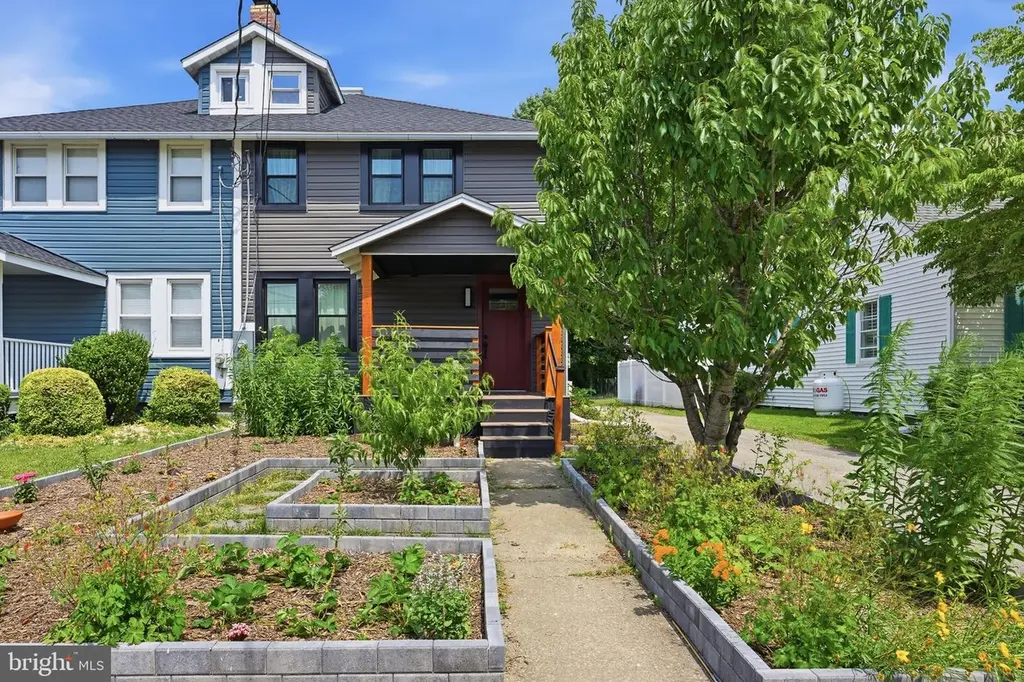
311 S Cass St · Middletown, DE
Flood risk 1/10 · Minimal
- FEMA flood zone
- X (unshaded)
- Chance of flooding over 30 yrs
- 0.0%
- Est. flood insurance / yr
- $473 – $860
Fire risk 1/10 · Minimal
- Est. fire insurance / yr
- $476 – $884
Heat risk 8/10 · Major
- Hot days now (above 102°F)
- 7 days/yr
- Hot days in 30 yrs
- 16 days/yr
Wind risk 6/10 · Moderate
- Chance of severe wind over 30 yrs
- 27.0%
Air-quality risk 2/10 · Minimal
- Unhealthy air days now
- 1 days/yr
- Unhealthy air days in 30 yrs
- 2 days/yr
Risk factors via First Street. Map © Google.
Why this score? — see what drove the F grade
The composite is a weighted blend of 9 inputs, each scored 0–100. Each bar is that input's sub-score; the figure is the points it added to the 100-point composite (weight × sub-score).
- Cash flow +13.8/30.0
- DSCR +4.2/10.0
- Schools +4.2/10.0
- Livability +3.6/5.0
- 1% rule +2.8/10.0
- Rent growth +2.8/5.0
- Condition / age +2.5/5.0
- ARV discount +0.0/15.0
- Appreciation +0.0/10.0
$335,000
🖨 Deal sheet 📄 Offer letter ✓ Due diligence
Listing remarks MLS
Welcome to this newly renovated home in the Appoquinimink School District. This is a 3 bedroom 1 and half bath, with hardwoods throughout the whole first floor. Home is ready for its new owner! Schedule you appointments today!
Key facts
- Covered front porch
- Remodeled kitchen
- Stainless appliances
Tags
Property features AI
Exterior
- Parking: Paved driveway parking; Three total driveway/garage/parking spaces
- Utilities: 200+ amp electric service with circuit breakers; Electric heating fuel; Electric hot water; Public water; Public sewer
- Home design: Semi-detached home; Single-family style with above-grade finished living area
- Construction: Vinyl siding; Block foundation; Built (year estimated)
- Exterior features: Deck(s); Not in a federal flood zone; Public water and public sewer
Interior
- Kitchen: Dishwasher; Disposal; Electric oven/range
- Bedrooms: Three bedrooms on the upper level
- Flooring: Hardwood; Vinyl
- Bathrooms: One full bathroom (upper level); One half bathroom (main level)
- Heating & cooling: Heat pump with electric backup; Central air
- Interior features: Attic; Formal separate dining room; Kitchen island; Pantry; Wood floors
- Laundry & utility: Laundry on upper floor
Neighborhood map
What this means for you Summary
Snapshot
- This is a 3-bed/1.0-bath townhouse listed at $335k.
Deal economics
- At list price, monthly cash flow is $30 ($363/yr) — positive.
- The deal already cash-flows at list — no discount required.
- To meet the 1% rule (rent ≥ 1% of price), the offer needs to be $260k (22.3% below list).
- Recommended offer: $260k (22.3% below list) — sets the bar for 1% rule.
- Cap rate 6.4% vs local median 3.0% in Middletown — top-decile yield for the area; either an underpriced asset or a hidden risk that comps aren't pricing in. Stress-test before assuming the spread holds.
Location & tenants
- Location reads 71/100 on livability (#17 in DE) — a middle-class / working-renter tenant base. Strengths: employment A+, housing A+, crime A-; Watch: cost of living C-, commute F.
- Appoquinimink School District (rural): math 37% / reading 52% proficiency, ranked #6 of 26 in DE (top 23%) — families likely to look elsewhere, expect single-tenant / working-renter base with shorter leases; only 18% free/reduced lunch — higher-income household profile.
- Zoned schools: Silver Lake Elementary School (math 30% / reading 38%, grade F, #40 of 105 statewide, top 38%, 602 students, 0% FRL); Meredith (Everett) Middle School (math 25% / reading 45%, grade F, #11 of 36 statewide, top 29%, 810 students, 0% FRL); Middletown High School (math 41% / reading 61%, grade D+, #5 of 40 statewide, top 10%, 1,355 students, 0% FRL) — zoned schools average 0% FRL vs 18% district-wide (18 pts lower); this property's tenant base skews higher-income than the district average.
- Market conditions: Rents rising (+1.1%/yr); 451 active listings in the ZIP; 9 comparable units currently listed for rent nearby; rentals at typical pace (median 20d on market — plan ~3-4 weeks tenant-placement turnaround); high-income renter base; 1,367 units permitted in New Castle County in 2024 (201 in 5+ unit buildings).
Forward outlook
- Local home prices are declining (-3.0%/yr); year-one equity from $2k of loan paydown is wiped out by about $10k of value loss. Plan a longer hold.
- New Castle County population projected at +9% by 2050 — modest demand growth; plan on rents tracking national, not racing it.
Negotiation context
- Only 6 days on market — expect competitive offers; lowballing is unlikely to land.
- 4 sale attempts since 23y ago with the ask held roughly flat each time — persistent listings suggest the price (not the market) is what's stuck; bring a comps-based counter.
- Current owner paid $270k; 24% above their basis — modest negotiation headroom, anchor on the comps not their cost.
Risks & watch-outs
- Watch-outs: built in 1935 — expect roof / HVAC / electrical / plumbing capex.
- Climate carrying-cost: major wind risk, 27% chance of damaging wind over 30y; extreme-heat days projected 7→16/yr by 2055 (HVAC capex compounding) — expect insurance premiums to compound above CPI over the hold.
Questions for the listing agent
- Built in 1935 — when were the roof, HVAC, electrical panel, plumbing, and water heater last replaced?
- Is there a deadline driving the sale (1031 exchange, divorce, estate, relocation)? That informs how much negotiation room exists.
- Schools are B-rated — typically a magnet for longer-tenancy family renters. What's the average tenant stay here, and is there a school-zone premium baked into asking?
- The area grade is low — what's the realistic commute time and amenity access for the typical tenant pool here? Any planned neighborhood developments (good or bad) we should know about?
- What's the average days-on-market for RENTAL listings here right now (not sales)? A rising rental-DOM trend means longer vacancies and softer asking-rent achievability than the comps imply.
- What's the recent tenant-quality profile in this submarket — average credit score on applications, eviction rate, late-payment / NSF rate, and stable-employment percentage? A property-management company in the area should have these aggregated.
- How much new for-sale + rental construction is in the pipeline within 1–3 miles? Heavy new supply typically softens prices + rents 12–24 months out; constrained supply supports both.
Investment metrics
- 1% rule
- 0.78% ✗
- Cap rate
- 6.40%
- Cash-on-cash
- 0.39%
- DSCR
- 1.02
- GRM
- 10.7
CMA / ARV
- ARV (on-the-fly)
- $275,500
- Comps found
- 5
Show comp detail 5 sales within ~0.75 mi
| Address | Dist | Beds/Ba | Sqft | Sold | Price | $/sf | Match |
|---|---|---|---|---|---|---|---|
| 106 E Main St | 0.31mi | 3/2.0 | 1,575 (+9%) | 19mo | $201,000 | $128 | 51 |
| 84 Franklin Dr | 0.66mi | 3/1.5 | 1,650 (+14%) | 6mo | $250,000 | $152 | 40 |
| 31 Franklin Dr | 0.72mi | 3/1.5 | 1,625 (+12%) | 16mo | $325,200 | $200 | 31 |
| 114 Littondale Ct | 0.54mi | 3/2.5 | 1,650 (+14%) | 19mo | $357,000 | $216 | 30 |
| 46 Franklin Dr | 0.73mi | 2/1.5 (-1) | 1,650 (+14%) | 18mo | $314,000 | $190 | 21 |
Match score weights: distance 35% · size 25% · config 20% · recency 20%. Top-matched comps best support the ARV.
Projected returns pro-forma
-3.0% appreciation · 1.07% rent growth · sell at horizon
- IRR
- -17.7%
- Equity multiple
- 0.39×
- Total profit
- $-57,455
- Equity at exit
- $49,950
- IRR
- -13.4%
- Equity multiple
- 0.28×
- Total profit
- $-67,685
- Equity at exit
- $28,965
Cash invested: $93,800 (down + closing). Projections, not guarantees.
Landlord ↔ Tenant lean methodology
- Overall (STATE)
- 70 Landlord-Friendly
- State Delaware
- 70 Landlord-Friendly · D+7
- County
- — inherits STATE
- City
- — inherits STATE
ZIP-level market 19709
- Home prices YoY
- -21.4%
- Rents YoY
- 1.1%
- Active inventory
- 451
- Price-to-rent
- 10.7×
Monthly cashflow live
- Estimated rent
- $2,602 high interval (Pro) →
- Mortgage (P&I)
- −$1,757
- Tax from tax record
- −$129 /mo · $1,551/yr
- Insurance
- −$140
- HOA
- −$0
- Vacancy / Maint / Mgmt
- −$546
- Net cashflow
- $30
Break-even live
UW: 25.0% down · 7.5% · 30yr · 1.5% tax · 5.0% vac · 8.0% maint · 8.0% mgmt
Financing live
Cash to close
- Down payment
- $83,750
- Closing costs
- $10,050
- Reserves months
- —
- Total cash needed
- —
Loan-product check · same deal, 3 products live
Conventional
25% down · 7.5% · 30yr
- Down + closing
- —
- Monthly P&I
- —
- Monthly cashflow
- —
- DSCR
- —
- Eligible?
- —
Personal DTI + credit; lowest rate.
DSCR
20% down · 8.5% · 30yr
- Down + closing
- —
- Monthly P&I
- —
- Monthly cashflow
- —
- DSCR
- —
- Eligible?
- —
No personal income docs; deal must DSCR.
Hard money
10% down · 12.0% · 12mo
- Down + closing
- —
- Monthly P&I
- —
- Monthly cashflow
- —
- DSCR
- —
- Eligible?
- —
Short-term bridge; refi at stabilization.
Rent comps 9 comps
| Address | Beds | Baths | Sqft | Rent | $/sqft | DOM | Units | Dist |
|---|---|---|---|---|---|---|---|---|
| 407 Champs Ln Middletown, DE | 2.0 | 2.5 | 1250 | $2,000 | $1.60 | 43d | 1 | 0.86mi |
| 1600 Lake Seymour Dr Middletown, DE | 1.0–3.0 | 1.0–2.0 | 1267 | $2,495 | $1.97 | 1d | 1 | 0.92mi |
| 274 Vincent Cir Middletown, DE | 3.0 | 1.5 | 1670 | $2,000 | $1.20 | 4d | 1 | 0.96mi |
| 132 Rosie Dr Middletown, DE | 2.0 | 2.5 | 1450 | $1,990 | $1.37 | 20d | 1 | 0.96mi |
| 138 Rosie Dr Middletown, DE | 3.0 | 2.5 | 1510 | $2,150 | $1.42 | 19d | 1 | 0.97mi |
| 511 Sally Ln Unit 511 Middletown, DE | 3.0 | 1.5 | 1835 | $2,450 | $1.34 | 43d | 1 | 1.06mi |
| 404 Naughty Ln Unit 404 Middletown, DE | 3.0 | 3.0 | 1200 | $2,600 | $2.17 | 24d | 1 | 1.06mi |
| 500 Westown Way Middletown, DE | 1.0–3.0 | 1.0–2.0 | 1267 | $2,595 | $2.05 | 1d | 1 | 1.21mi |
| 250 Celebration Ct Middletown, DE | 1.0–2.0 | 1.0–2.0 | 1125 | $2,320 | $2.06 | 1d | 5 | 1.50mi |
Listing history 6 events
-
2026-06-18days on market $335,000 Active 6 DOM
-
2026-06-17days on market $335,000 Active 5 DOM
-
2026-06-16days on market $335,000 Active 4 DOM
-
2026-06-15days on market $335,000 Active 3 DOM
-
2026-06-13remarks 699-char remark
-
2026-06-13$335,000 Active 1 DOM
ⓘ Source: listings_history table (triggers on properties + properties_extension) + one-shot
backfill from property_details.listing_events for pre-trigger history.
Tax reassessment forecast DE · Partial reset (capped growth)
- Current annual tax
- $1,551 · $129/mo
- Projected year-2 tax
- $1,747 · $146/mo
- Expected delta
- +$196/yr (+$16/mo · 12.6%)
ⓘ Screening estimate from a state-policy table — verify with the county assessor before closing.
Climate risk First Street
- Flood 1/10 Low FEMA zone X (unshaded) · 0% chance over 30 yrs
- Wildfire 1/10 Low
- Heat 8/10 Severe 7 d/yr ≥102°F today · 16 d/yr by 30 yrs out
- Wind 6/10 Major 27% chance of damaging wind over 30 yrs
- Air quality 2/10 Low 1 unhealthy d/yr today · 2 by 30 yrs out
Nearby sold comps map
Loading sold comps map…
Walkable amenities ~0.75 mi
Loading nearby amenities…
Taxation est. · year 1
- Rental income
- $31,228
- − Mortgage interest
- −$18,765
- − Property taxes
- −$1,551
- − Insurance
- −$1,675
- − Repairs & maintenance
- −$2,498
- − Management
- −$2,498
- − Depreciation
- −$9,745
- Taxable loss
- −$5,505
- Est. tax savings @ 24.0%
- +$1,321
- After-tax cash flow
- $1,684/yr
For passive investors: Depreciation is non-cash, so a rental often shows a tax loss while cash-flowing — sheltering income. Rental losses are passive: they offset passive income freely, and up to $25,000/yr can offset ordinary (W-2) income if you actively participate and your MAGI is under $100k (phasing out to $0 by $150k); unused losses carry forward. On sale, claimed depreciation is recaptured at up to 25%, and gains may owe capital-gains tax (a 1031 exchange can defer both). Figures are a year-1 estimate at your 24.0% rate — not tax advice; consult a CPA.
Schools (NCES district)
- District
- Appoquinimink School District
- NCES district ID
- 1000080
- Math proficiency
- 37% ▼ -13.00%
- Reading proficiency
- 52% ▼ -13.00%
- Median HH income
- $93,397
- Composite
- 42.32/100
- National rank
- #3256
- State rank
- #6 of 26 in DE
Livability — Middletown
- Score
- 71/100
- State rank
- #17
- US rank
- #6446
Category grades
Schools grade is shown separately in the Schools card above.
Census & demographics
- Census place
- Middletown, DE
- County
- New Castle County · 483,412 people
- City population
- 53,234
- Metro
- Philadelphia-Camden-Wilmington, PA-NJ-DE-MD
- Population (ZIP)
- 53,234
- Household income
- $132,956
- Rent vs Own
- Severe rent burden
- 268.0
Population outlook (New Castle County) Hauer SSP2
- Today (2025)
- 594,686 people
- By 2030
- 609,164 · +2.4%
- By 2040
- 632,154 · +6.3%
- By 2050
- 649,068 · +9.1%
- By 2075
- 687,771 · +15.7%
- By 2100
- 694,961 · +16.9%
Race, ethnicity, and origin ACS 2023
- Neighborhood character
- Diverse neighborhood (Simpson 0.59)
- Race & ethnicity
- White 59% Black 23% Asian 7% Two or more races 6% Hispanic / Latino 6%
- Hispanic origin (detail)
- Mexican 1% Puerto Rican 3%
- Common ancestry
- Romanian 5% Slovak 1% Iranian 1%
- Foreign-born
- 11% · Canada, China
- Languages at home
- 87% English-only · Other Indo-European 4% Spanish 3% French/Haitian/Cajun 1%
Political lean MEDSL · New Castle
- 2024 margin
- Solid D (+32.6) · D 65.5% · R 32.9% · Other 1.6%
- 2008→2024 swing
- -8.1pp toward R · 2008: 40.6pp · 2024: 32.6pp
- All cycles
- 2024: D+32.6 2020: D+37.1 2016: D+29.6 2012: D+34.1 2008: D+40.6
Not yet ingested
- Civics
- —
Market trends
- HPI YoY
- ▼ -86.40%
- Current HPI
- 317.1386
- Rent YoY
- ▲ 1.07%
- Metro
- Philadelphia-Camden-Wilmington, PA-NJ-DE-MD
- State GDP YoY
- —
- F500 in state
- 0
Price history
+781.6% since first listed12 events — show timeline
- 2026-06-12 Listed $335,000 BRIGHT MLS
- 2023-05-05 Sold (MLS) $270,000 BRIGHT MLS
- 2023-05-03 Sold (Public Records) $270,000 Public Records
- 2023-04-06 Contingent — BRIGHT MLS
- 2023-03-08 Relisted — BRIGHT MLS
- 2023-03-04 Contingent — BRIGHT MLS
- 2023-02-27 Listed $274,900 BRIGHT MLS
- 2004-02-03 Sold (Public Records) $125,000 Public Records
- 2004-01-15 Sold (MLS) $125,000 BRIGHT MLS
- 2003-11-07 Listing Removed — BRIGHT MLS
- 2003-11-04 Listed $125,000 BRIGHT MLS
- 1986-05-01 Sold (Public Records) $38,000 Public Records
Property tax history
+5.1%/yrLatest (2024): $1,551 · +19.6% YoY. Source: county tax records.
Cash-flow waterfall
monthlySold comps — $/sqft
last 12 mo · ≤1 miLoading sold comps…