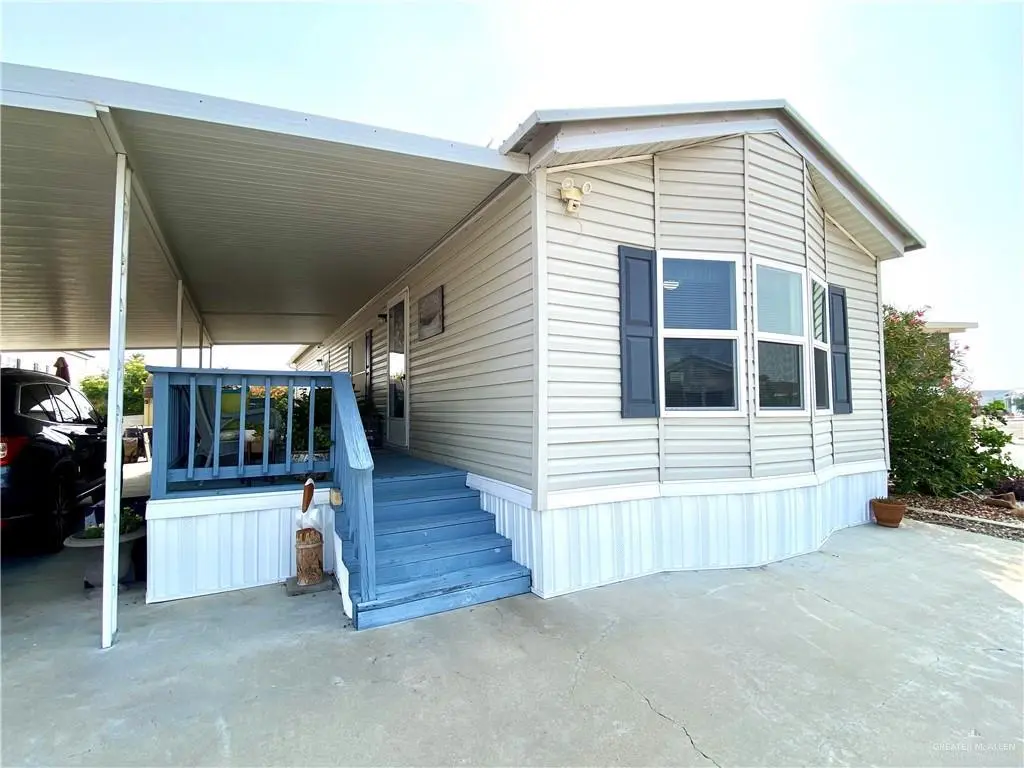
7511 Birdie Dr · Perezville, TX
Flood risk 1/10 · Minimal
- FEMA flood zone
- X
- Chance of flooding over 30 yrs
- 0.0%
- Est. flood insurance / yr
- $507 – $1,088
Fire risk 7/10 · Major
- Est. fire insurance / yr
- $1,222 – $2,270
Heat risk 9/10 · Severe
- Hot days now (above 112°F)
- 6 days/yr
- Hot days in 30 yrs
- 19 days/yr
Wind risk 8/10 · Major
- Chance of severe wind over 30 yrs
- 94.0%
Air-quality risk 1/10 · Minimal
- Unhealthy air days now
- 0 days/yr
- Unhealthy air days in 30 yrs
- 0 days/yr
Risk factors via First Street. Map © Google.
Why this score? — see what drove the D- grade
The composite is a weighted blend of 9 inputs, each scored 0–100. Each bar is that input's sub-score; the figure is the points it added to the 100-point composite (weight × sub-score).
- Cash flow +18.2/30.0
- DSCR +5.7/10.0
- 1% rule +4.9/10.0
- Livability +3.2/5.0
- Rent growth +2.7/5.0
- Condition / age +2.5/5.0
- Schools +1.9/10.0
- ARV discount +0.0/15.0
- Appreciation +0.0/10.0
$114,900
🖨 Deal sheet 📄 Offer letter ✓ Due diligence
Listing remarks MLS
This beautifully maintained, 2-bedroom, 2-bathroom home has a front kitchen that provides lots of natural lighting, cabinet and counter space, a farm sink, and the microwave and dishwasher replaced 2024! Beautiful built-in designer glass cabinets in the kitchen provide extra storage. Spacious living room. Decorative ceilings with fans throughout. In-house laundry. The master suite is comfortable with plenty of closet space as well as built-in drawers, a bidet toilet, new sinks, a step-in shower, a double vanity, and lots of cabinets for linens. Cozy guest bedroom with large closet. Guest bathroom has a shower/tub combo, a new high-rise toilet, and a new sink. The home offers keyless entry, Alexa smart home devices, and new tip-out windows (2023). The exterior provides a deck, carport, low maintenance rock yard, security camera, dusk to dawn exterior lighting, gutters, storage shed, and even shades on west side of the carport. With the roof and AC installed in 2018.
Key facts
- Double vanity
- In-house laundry
- Front kitchen
Tags
Neighborhood map
What this means for you Summary
Snapshot
- This is a 2-bed/2.0-bath manufactured listed at $115k.
Deal economics
- At list price, monthly cash flow is $102 ($1k/yr) — positive.
- The deal already cash-flows at list — no discount required.
- To meet the 1% rule (rent ≥ 1% of price), the offer needs to be $113k (1.3% below list).
- Recommended offer: $111k (3.0% below list) — sets the bar for market timing.
Location & tenants
- Location reads 64/100 on livability (#743 in TX) — a middle-class / working-renter tenant base. Strengths: cost of living A+, housing A+, crime A-; Watch: schools F, amenities F, commute F.
- La Joya ISD (suburban): math 18% / reading 29% proficiency, ranked #759 of 826 in TX (top 92%) — low school quality limits family demand, transient renter base, plan for 1-2y turnover.
- Market conditions: Rents flat; 852 active listings in the ZIP; 13 comparable units currently listed for rent nearby; rentals lingering (median 44d on market — plan ~5-8 weeks vacancy on turnover, expect pricing pressure); 69% of comp listings sitting > 30 days — soft ceiling on asking rent; 7,378 units permitted in Hidalgo County in 2024 (641 in 5+ unit buildings).
Forward outlook
- Local home prices are declining (-3.0%/yr); year-one equity from $794 of loan paydown is wiped out by about $3k of value loss. Plan a longer hold.
- Hidalgo County population projected at +28% by 2050 — long-run rental-demand tailwind backs the buy-and-hold thesis.
Negotiation context
- It's been on market 53 days — a 3% lower offer ($111k) is reasonable based on typical stale-listing flexibility.
- 3 sale attempts since 9y ago with the ask held roughly flat each time — persistent listings suggest the price (not the market) is what's stuck; bring a comps-based counter.
Risks & watch-outs
- Climate carrying-cost: severe wind risk, 94% chance of damaging wind over 30y; major wildfire risk; extreme-heat days projected 6→19/yr by 2055 (HVAC capex compounding) — expect insurance premiums to compound above CPI over the hold.
Questions for the listing agent
- It's been on market 53 days. Have you received any prior offers? Is the seller open to a 3% concession, seller financing, or rate buy-down credit?
- What does the HOA fee cover, when was the last increase, and are there any pending special assessments or reserve-fund shortfalls?
- Is there a deadline driving the sale (1031 exchange, divorce, estate, relocation)? That informs how much negotiation room exists.
- Schools are F-rated, which usually means shorter tenancies and higher turnover. Who's the typical renter profile here, and what's been the actual vacancy rate?
- The area grade is low — what's the realistic commute time and amenity access for the typical tenant pool here? Any planned neighborhood developments (good or bad) we should know about?
- What's the average days-on-market for RENTAL listings here right now (not sales)? A rising rental-DOM trend means longer vacancies and softer asking-rent achievability than the comps imply.
- What's the recent tenant-quality profile in this submarket — average credit score on applications, eviction rate, late-payment / NSF rate, and stable-employment percentage? A property-management company in the area should have these aggregated.
- How much new for-sale + rental construction is in the pipeline within 1–3 miles? Heavy new supply typically softens prices + rents 12–24 months out; constrained supply supports both.
Investment metrics
- 1% rule
- 0.99% ✗
- Cap rate
- 7.36%
- Cash-on-cash
- 3.81%
- DSCR
- 1.17
- GRM
- 8.4
CMA / ARV
- ARV (median comp)
- $90,928
- List price
- $114,900
- Delta
- 26.36%
- Verdict
- OVERPRICED
- Comps
- 12 within 1.0 mi
Show comp detail 12 sales within ~0.75 mi
| Address | Dist | Beds/Ba | Sqft | Sold | Price | $/sf | Match |
|---|---|---|---|---|---|---|---|
| 2404 W Bogey Dr | 0.13mi | 2/2.0 | 896 (-7%) | 3mo | $89,900 | $100 | 81 |
| 7410 Birdie Dr | 0.07mi | 2/2.0 | 960 (0%) | 20mo | $99,900 | $104 | 80 |
| 7613 Bunker Dr | 0.06mi | 2/2.0 | 909 (-5%) | 15mo | $112,900 | $124 | 76 |
| 7211 Bogey Dr | 0.27mi | 2/2.0 | 896 (-7%) | 6mo | $94,000 | $105 | 71 |
| 7305 Bogey Dr | 0.25mi | 1/1.0 (-1) | 976 (+2%) | 9mo | $78,000 | $80 | 69 |
| 2307 W Bogey Dr | 0.20mi | 2/1.0 | 840 (-12%) | 1mo | $112,900 | $134 | 65 |
| 2408 Double Eagle Dr | 0.22mi | 2/1.5 | 832 (-13%) | 2mo | $94,500 | $114 | 64 |
| 7706 Bunker Dr | 0.09mi | 2/2.0 | 1,078 (+12%) | 14mo | $115,500 | $107 | 63 |
| 7521 Par Dr | 0.06mi | 2/2.0 | 1,080 (+12%) | 16mo | $112,900 | $105 | 63 |
| 7414 Birdie Dr | 0.06mi | 2/2.0 | 1,082 (+13%) | 24mo | $87,000 | $80 | 56 |
| 2507 W Bogey Dr | 0.26mi | 2/2.0 | 832 (-13%) | 20mo | $88,000 | $106 | 49 |
| 7225 Monroe St | 0.74mi | 2/2.0 | 816 (-15%) | 10mo | $84,999 | $104 | 32 |
Match score weights: distance 35% · size 25% · config 20% · recency 20%. Top-matched comps best support the ARV.
Projected returns pro-forma
-3.0% appreciation · 0.93% rent growth · sell at horizon
- IRR
- -12.7%
- Equity multiple
- 0.55×
- Total profit
- $-14,405
- Equity at exit
- $17,132
- IRR
- -7.1%
- Equity multiple
- 0.59×
- Total profit
- $-13,201
- Equity at exit
- $9,934
Cash invested: $32,172 (down + closing). Projections, not guarantees.
Landlord ↔ Tenant lean methodology
- Overall (STATE)
- 87 Strongly Landlord-Friendly
- State Texas
- 87 Strongly Landlord-Friendly · R+5
- County
- — inherits STATE
- City
- — inherits STATE
ZIP-level market 78572
- Home prices YoY
- -22.9%
- Rents YoY
- 0.9%
- Active inventory
- 852
- Price-to-rent
- 8.4×
Monthly cashflow live
- Estimated rent
- $1,134 high interval (Pro) →
- Mortgage (P&I)
- −$603
- Tax from tax record
- −$108 /mo · $1,299/yr
- Insurance
- −$48
- HOA
- −$35
- Vacancy / Maint / Mgmt
- −$238
- Net cashflow
- $102
Break-even live
UW: 25.0% down · 7.5% · 30yr · 1.5% tax · 5.0% vac · 8.0% maint · 8.0% mgmt
Financing live
Cash to close
- Down payment
- $28,725
- Closing costs
- $3,447
- Reserves months
- —
- Total cash needed
- —
Loan-product check · same deal, 3 products live
Conventional
25% down · 7.5% · 30yr
- Down + closing
- —
- Monthly P&I
- —
- Monthly cashflow
- —
- DSCR
- —
- Eligible?
- —
Personal DTI + credit; lowest rate.
DSCR
20% down · 8.5% · 30yr
- Down + closing
- —
- Monthly P&I
- —
- Monthly cashflow
- —
- DSCR
- —
- Eligible?
- —
No personal income docs; deal must DSCR.
Hard money
10% down · 12.0% · 12mo
- Down + closing
- —
- Monthly P&I
- —
- Monthly cashflow
- —
- DSCR
- —
- Eligible?
- —
Short-term bridge; refi at stabilization.
Rent comps 13 comps
| Address | Beds | Baths | Sqft | Rent | $/sqft | DOM | Units | Dist |
|---|---|---|---|---|---|---|---|---|
| 2503 Double Eagle Dr Mission, TX | 2.0 | 2.0 | 840 | $1,300 | $1.55 | 43d | 1 | 0.23mi |
| 1908 Kennedy St Mission, TX | 2.0 | 2.0 | 1062 | $1,300 | $1.22 | 23d | 1 | 0.66mi |
| 7220 W Interstate Highway 2 Unit 20 Mission, TX | 2.0 | 2.0 | 1104 | $995 | $0.90 | 43d | 1 | 0.82mi |
| 7220 W Interstate Highway 2 Unit 15 Mission, TX | 1.0 | 1.0 | 945 | $925 | $0.98 | 43d | 1 | 0.82mi |
| 7220 W Interstate Highway 2 Fl STW 1 WITH BALCONY) FRONT UNIT Mission, TX | 1.0 | 1.0 | 945 | $895 | $0.95 | 43d | 1 | 0.82mi |
| 7220 W Interstate Highway 2 Unit 12 Mission, TX | 2.0 | 2.0 | 1104 | $995 | $0.90 | 21d | 1 | 0.82mi |
| 7220 W Interstate Highway 2 Fl STW 3 WITH NO BALCONY) Mission, TX | 1.0 | 1.0 | 945 | $895 | $0.95 | 19d | 1 | 0.82mi |
| 7220 W Interstate Highway 2 Fl STW 4 WITH PORCH) FRONT UNIT Mission, TX | 2.0 | 2.0 | 1104 | $1,150 | $1.04 | 43d | 1 | 0.82mi |
| 109 Ash St Mission, TX | 1.0 | 1.0 | 560 | $800 | $1.43 | 43d | 1 | 0.85mi |
| 3717 Clavel St Unit 8 Palmview, TX | 2.0 | 1.0 | 1005 | $800 | $0.80 | 43d | 1 | 0.89mi |
| 3711 Chapa AVE Palmview, TX | 3.0 | 2.0 | 1050 | $1,300 | $1.24 | 43d | 1 | 0.96mi |
| 3711 Chapa AVE Palmview, TX | 2.0 | 2.0 | 995 | $1,150 | $1.16 | 14d | 1 | 0.96mi |
| 3706 Chapa AVE Palmview, TX | 2.0 | 2.0 | 864 | $1,100 | $1.27 | 43d | 1 | 1.00mi |
HOA detail
- Monthly dues
- $35 · $420/yr
- Likely covers
- security
Listing history 16 events
-
2026-06-08days on market $114,900 Active 53 DOM
-
2026-06-07days on market $114,900 Active 52 DOM
-
2026-06-05days on market $114,900 Active 49 DOM
-
2026-06-03days on market $114,900 Active 48 DOM
-
2026-06-02days on market $114,900 Active 47 DOM
-
2026-06-01days on market $114,900 Active 46 DOM
-
2026-05-31days on market $114,900 Active 45 DOM
-
2026-05-31days on market $114,900 Active 44 DOM
-
2026-04-16$114,900 Active 979-char remark
Show marketing remark (979 chars)
This beautifully maintained, 2-bedroom, 2-bathroom home has a front kitchen that provides lots of natural lighting, cabinet and counter space, a farm sink, and the microwave and dishwasher replaced 2024! Beautiful built-in designer glass cabinets in the kitchen provide extra storage. Spacious living room. Decorative ceilings with fans throughout. In-house laundry. The master suite is comfortable with plenty of closet space as well as built-in drawers, a bidet toilet, new sinks, a step-in shower, a double vanity, and lots of cabinets for linens. Cozy guest bedroom with large closet. Guest bathroom has a shower/tub combo, a new high-rise toilet, and a new sink. The home offers keyless entry, Alexa smart home devices, and new tip-out windows (2023). The exterior provides a deck, carport, low maintenance rock yard, security camera, dusk to dawn exterior lighting, gutters, storage shed, and even shades on west side of the carport. With the roof and AC installed in 2018.
-
2024-05-24$102,000 Active
-
2017-12-27soldstatus
-
2017-12-22soldstatus Sold
-
2017-12-09historical
-
2017-11-18$59,900 Active
-
2011-03-24soldstatus
-
2010-04-08soldstatus
ⓘ Source: listings_history table (triggers on properties + properties_extension) + one-shot
backfill from property_details.listing_events for pre-trigger history.
Tax reassessment forecast TX · Resets to sale price
- Current annual tax
- $1,299 · $108/mo
- Projected year-2 tax
- $2,103 · $175/mo
- Expected delta
- +$804/yr (+$67/mo · 61.9%)
ⓘ Screening estimate from a state-policy table — verify with the county assessor before closing.
Climate risk First Street
- Flood 1/10 Low FEMA zone X · 0% chance over 30 yrs
- Wildfire 7/10 Severe
- Heat 9/10 Extreme 6 d/yr ≥112°F today · 19 d/yr by 30 yrs out
- Wind 8/10 Severe 94% chance of damaging wind over 30 yrs
- Air quality 1/10 Low 0 unhealthy d/yr today · 0 by 30 yrs out
Nearby sold comps map
Loading sold comps map…
Walkable amenities ~0.75 mi
Loading nearby amenities…
Taxation est. · year 1
- Rental income
- $13,608
- − Mortgage interest
- −$6,436
- − Property taxes
- −$1,299
- − Insurance
- −$574
- − Repairs & maintenance
- −$1,089
- − Management
- −$1,089
- − HOA
- −$420
- − Depreciation
- −$3,343
- Taxable loss
- −$641
- Est. tax savings @ 24.0%
- +$154
- After-tax cash flow
- $1,381/yr
For passive investors: Depreciation is non-cash, so a rental often shows a tax loss while cash-flowing — sheltering income. Rental losses are passive: they offset passive income freely, and up to $25,000/yr can offset ordinary (W-2) income if you actively participate and your MAGI is under $100k (phasing out to $0 by $150k); unused losses carry forward. On sale, claimed depreciation is recaptured at up to 25%, and gains may owe capital-gains tax (a 1031 exchange can defer both). Figures are a year-1 estimate at your 24.0% rate — not tax advice; consult a CPA.
Schools (NCES district)
- District
- La Joya ISD
- NCES district ID
- 4826130
- Math proficiency
- 18% ▼ -35.00%
- Reading proficiency
- 29% ▼ -10.00%
- Median HH income
- $27,845
- Composite
- 18.65/100
- National rank
- #8891
- State rank
- #759 of 826 in TX
Livability — Perezville
- Score
- 64/100
- State rank
- #743
- US rank
- #13748
Category grades
Schools grade is shown separately in the Schools card above.
Census & demographics
- County
- Hidalgo County · 623,128 people
- City population
- 78,024
- Metro
- McAllen-Edinburg-Mission, TX
- Population (ZIP)
- 78,024
- Household income
- $54,298
- Rent vs Own
- Severe rent burden
- 1714.0
Population outlook (Hidalgo County) Hauer SSP2
- Today (2025)
- 955,232 people
- By 2030
- 1,009,774 · +5.7%
- By 2040
- 1,120,332 · +17.3%
- By 2050
- 1,225,036 · +28.2%
- By 2075
- 1,439,189 · +50.7%
- By 2100
- 1,533,429 · +60.5%
Race, ethnicity, and origin ACS 2023
- Neighborhood character
- Predominantly Hispanic (85%)
- Race & ethnicity
- Hispanic / Latino 85% Two or more races 47% White 12% Asian 2%
- Hispanic origin (detail)
- Mexican 80%
- Common ancestry
- Slovak 1% Portuguese 0%
- Foreign-born
- 28% · Canada, South Korea
- Languages at home
- 22% English-only · Spanish 76%
Political lean MEDSL · Hidalgo
- 2024 margin
- Toss-up / Even · D 48.1% · R 51.0%
- 2008→2024 swing
- -41.6pp toward R · 2008: 38.7pp · 2024: -2.9pp
- All cycles
- 2024: R+2.9 2020: D+17.1 2016: D+40.5 2012: D+41.8 2008: D+38.7
Not yet ingested
- Civics
- —
Market trends
- HPI YoY
- ▼ -62.35%
- Current HPI
- 209.3573
- Rent YoY
- ▲ 0.93%
- Metro
- McAllen-Edinburg-Mission, TX
- State GDP YoY
- ▲ 3.95%
- F500 in state
- 110
Industry mix (Fortune 500 HQ in TX)
| Industry | F500 HQs | Revenue |
|---|---|---|
| Energy | 16 | $1,198B |
|
||
| Technology | 5 | $198B |
|
||
| Engineering / Construction | 4 | $72B |
|
||
| Energy Services | 3 | $60B |
|
||
| Utilities | 3 | $41B |
|
||
| Healthcare | 2 | $330B |
|
||
Price history
+91.8% since first listed8 events — show timeline
- 2026-04-16 Listed $114,900 MCALLENMLS
- 2024-05-24 Listed $102,000 MCALLENMLS
- 2017-12-27 Sold (Public Records) — Public Records
- 2017-12-22 Sold (MLS) — MCALLENMLS
- 2017-12-09 Delisted — MCALLENMLS
- 2017-11-18 Listed $59,900 MCALLENMLS
- 2011-03-24 Sold (Public Records) — Public Records
- 2010-04-08 Sold (Public Records) — Public Records
Property tax history
+1.3%/yrLatest (2025): $1,299 · +7.1% YoY. Source: county tax records.
Cash-flow waterfall
monthlySold comps — $/sqft
last 12 mo · ≤1 miLoading sold comps…