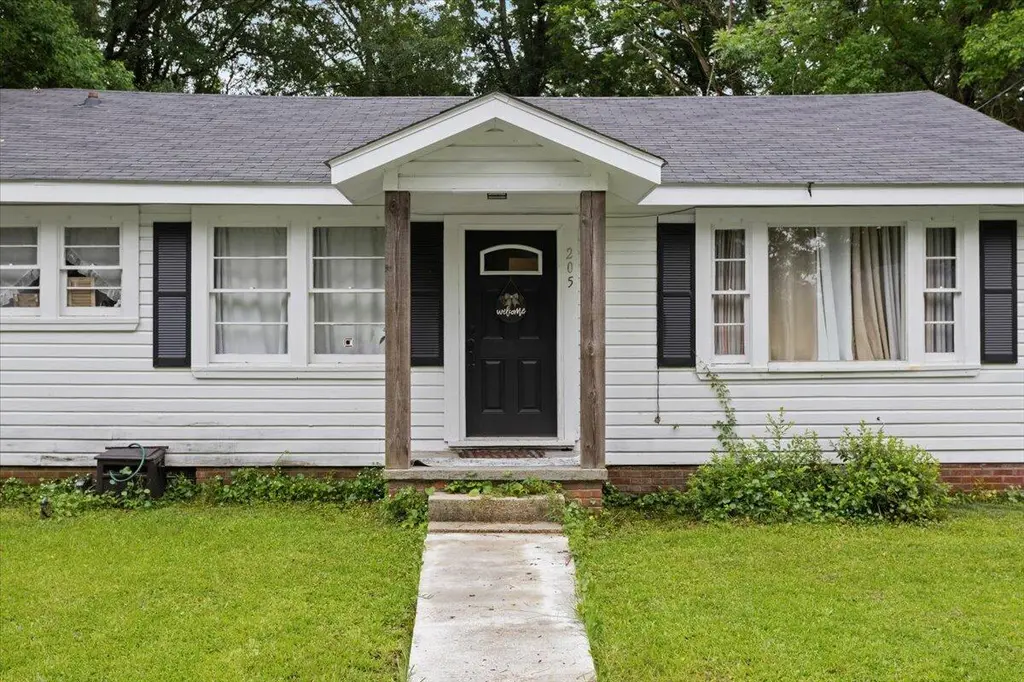
205 E 4th Ave · Petal, MS
Flood risk 1/10 · Minimal
- FEMA flood zone
- X (unshaded)
- Chance of flooding over 30 yrs
- 0.0%
- Est. flood insurance / yr
- $507 – $1,088
Fire risk 2/10 · Minimal
- Est. fire insurance / yr
- $1,241 – $2,305
Heat risk 8/10 · Major
- Hot days now (above 106°F)
- 7 days/yr
- Hot days in 30 yrs
- 21 days/yr
Wind risk 8/10 · Major
- Chance of severe wind over 30 yrs
- 99.0%
Air-quality risk 1/10 · Minimal
- Unhealthy air days now
- 0 days/yr
- Unhealthy air days in 30 yrs
- 0 days/yr
Risk factors via First Street. Map © Google.
Why this score? — see what drove the C grade
The composite is a weighted blend of 9 inputs, each scored 0–100. Each bar is that input's sub-score; the figure is the points it added to the 100-point composite (weight × sub-score).
- Cash flow +20.3/30.0
- ARV discount +10.5/15.0
- DSCR +6.4/10.0
- Schools +5.3/10.0
- 1% rule +4.6/10.0
- Livability +3.7/5.0
- Rent growth +2.5/5.0
- Condition / age +2.5/5.0
- Appreciation +0.0/10.0
$141,000
🖨 Deal sheet 📄 Offer letter ✓ Due diligence
Listing remarks MLS
Completely renovated 3BR 1BA home.
Key facts
- Spacious backyard
- Stainless appliances
- Painted cabinetry
Tags
Property features AI
Exterior
- Parking: Attached 1-car carport
- Utilities: Public water; Public sewer
- Home design: Single-family residence; One story; Raised foundation
- Construction: Wood siding; Composition roof
- Exterior features: Fenced lot; Level lot
Interior
- Flooring: Vinyl
- Bathrooms: 1 full bathroom
- Heating & cooling: Central heating (natural gas); Central electric air conditioning
- Interior features: Vinyl flooring
Neighborhood map
What this means for you Summary
Snapshot
- This is a 3-bed/1.0-bath single-family listed at $141k.
Deal economics
- At list price, monthly cash flow is $180 ($2k/yr) — positive.
- The deal already cash-flows at list — no discount required.
- To meet the 1% rule (rent ≥ 1% of price), the offer needs to be $136k (3.9% below list).
- Recommended offer: $136k (3.9% below list) — sets the bar for 1% rule.
- Cap rate 7.8% vs local median 4.0% in Petal — top-decile yield for the area; either an underpriced asset or a hidden risk that comps aren't pricing in. Stress-test before assuming the spread holds.
Location & tenants
- Location reads 73/100 on livability (#18 in MS) — a middle-class / working-renter tenant base. Strengths: crime A+, cost of living A+, housing A+; Watch: health & safety D, amenities F, commute F.
- Petal School District (suburban): math 68% / reading 56% proficiency, ranked #2 of 130 in MS (top 2%) — acceptable for families but not a draw, mixed tenant base, ~2y average lease.
- Market conditions: 228 active listings in the ZIP; 2 comparable units currently listed for rent nearby; 121 units permitted in Forrest County in 2024 (30 in 5+ unit buildings).
Forward outlook
- Local home prices are declining (-3.0%/yr); year-one equity from $975 of loan paydown is wiped out by about $4k of value loss. Plan a longer hold.
- Forrest County population projected at +6% by 2050 — modest demand growth; plan on rents tracking national, not racing it.
Negotiation context
- Only 14 days on market — expect competitive offers; lowballing is unlikely to land.
- 2 sale attempts since 4y ago with the ask held roughly flat each time — persistent listings suggest the price (not the market) is what's stuck; bring a comps-based counter.
Risks & watch-outs
- Watch-outs: built in 1950 — expect roof / HVAC / electrical / plumbing capex.
- Climate carrying-cost: severe wind risk, 99% chance of damaging wind over 30y; extreme-heat days projected 7→21/yr by 2055 (HVAC capex compounding) — expect insurance premiums to compound above CPI over the hold.
Questions for the listing agent
- Built in 1950 — when were the roof, HVAC, electrical panel, plumbing, and water heater last replaced?
- Is there a deadline driving the sale (1031 exchange, divorce, estate, relocation)? That informs how much negotiation room exists.
- What's the average days-on-market for RENTAL listings here right now (not sales)? A rising rental-DOM trend means longer vacancies and softer asking-rent achievability than the comps imply.
- What's the recent tenant-quality profile in this submarket — average credit score on applications, eviction rate, late-payment / NSF rate, and stable-employment percentage? A property-management company in the area should have these aggregated.
- How much new for-sale + rental construction is in the pipeline within 1–3 miles? Heavy new supply typically softens prices + rents 12–24 months out; constrained supply supports both.
Investment metrics
- 1% rule
- 0.96% ✗
- Cap rate
- 7.83%
- Cash-on-cash
- 5.48%
- DSCR
- 1.24
- GRM
- 8.7
CMA / ARV
- ARV (on-the-fly)
- $151,200
- Comps found
- 2
Show comp detail 2 sales within ~0.75 mi
| Address | Dist | Beds/Ba | Sqft | Sold | Price | $/sf | Match |
|---|---|---|---|---|---|---|---|
| 310 E Cherry Dr | 0.47mi | 3/2.0 | 1,100 (+9%) | 8mo | $165,000 | $150 | 52 |
| 108 Glenwood Dr | 0.64mi | 3/1.0 | 1,080 (+7%) | 20mo | $139,900 | $130 | 41 |
Match score weights: distance 35% · size 25% · config 20% · recency 20%. Top-matched comps best support the ARV.
Projected returns pro-forma
-3.0% appreciation · 3.0% rent growth · sell at horizon
- IRR
- -7.8%
- Equity multiple
- 0.71×
- Total profit
- $-11,387
- Equity at exit
- $21,024
- IRR
- 1.7%
- Equity multiple
- 1.12×
- Total profit
- $4,756
- Equity at exit
- $12,191
Cash invested: $39,480 (down + closing). Projections, not guarantees.
Landlord ↔ Tenant lean methodology
- Overall (STATE)
- 90 Strongly Landlord-Friendly
- State Mississippi
- 90 Strongly Landlord-Friendly · R+11
- County
- — inherits STATE
- City
- — inherits STATE
ZIP-level market 39465
- Active inventory
- 228
- Price-to-rent
- 8.7×
Monthly cashflow live
- Estimated rent
- $1,355 medium interval (Pro) →
- Mortgage (P&I)
- −$739
- Tax from tax record
- −$92 /mo · $1,106/yr
- Insurance
- −$59
- HOA
- −$0
- Vacancy / Maint / Mgmt
- −$285
- Net cashflow
- $180
Break-even live
UW: 25.0% down · 7.5% · 30yr · 1.5% tax · 5.0% vac · 8.0% maint · 8.0% mgmt
Financing live
Cash to close
- Down payment
- $35,250
- Closing costs
- $4,230
- Reserves months
- —
- Total cash needed
- —
Loan-product check · same deal, 3 products live
Conventional
25% down · 7.5% · 30yr
- Down + closing
- —
- Monthly P&I
- —
- Monthly cashflow
- —
- DSCR
- —
- Eligible?
- —
Personal DTI + credit; lowest rate.
DSCR
20% down · 8.5% · 30yr
- Down + closing
- —
- Monthly P&I
- —
- Monthly cashflow
- —
- DSCR
- —
- Eligible?
- —
No personal income docs; deal must DSCR.
Hard money
10% down · 12.0% · 12mo
- Down + closing
- —
- Monthly P&I
- —
- Monthly cashflow
- —
- DSCR
- —
- Eligible?
- —
Short-term bridge; refi at stabilization.
Rent comps 2 comps
| Address | Beds | Baths | Sqft | Rent | $/sqft | DOM | Units | Dist |
|---|---|---|---|---|---|---|---|---|
| 523 E Fifth Ave Petal, MS | 3.0 | 1.0 | 1098 | $1,500 | $1.37 | 20d | 1 | 0.38mi |
| 120 E First Ave Petal, MS | 2.0 | 1.0 | 1062 | $995 | $0.94 | 43d | 1 | 0.63mi |
Listing history 12 events
-
2026-06-19days on market $141,000 Active 14 DOM
-
2026-06-18days on market $141,000 Active 13 DOM
-
2026-06-17days on market $141,000 Active 12 DOM
-
2026-06-16days on market $141,000 Active 11 DOM
-
2026-06-15days on market $141,000 Active 10 DOM
-
2026-06-14days on market $141,000 Active 8 DOM
-
2026-06-13days on market $141,000 Active 7 DOM
-
2026-06-10days on market $141,000 Active 5 DOM
-
2026-06-09days on market $141,000 Active 4 DOM
-
2026-06-08days on market $141,000 Active 3 DOM
-
2026-06-07remarks 699-char remark
-
2026-06-07$141,000 Active 2 DOM
ⓘ Source: listings_history table (triggers on properties + properties_extension) + one-shot
backfill from property_details.listing_events for pre-trigger history.
Tax reassessment forecast MS · Resets to sale price
- Current annual tax
- $1,106 · $92/mo
- Projected year-2 tax
- $1,114 · $93/mo
- Expected delta
- +$8/yr (+$1/mo · 0.7%)
ⓘ Screening estimate from a state-policy table — verify with the county assessor before closing.
Climate risk First Street
- Flood 1/10 Low FEMA zone X (unshaded) · 0% chance over 30 yrs
- Wildfire 2/10 Low
- Heat 8/10 Severe 7 d/yr ≥106°F today · 21 d/yr by 30 yrs out
- Wind 8/10 Severe 99% chance of damaging wind over 30 yrs
- Air quality 1/10 Low 0 unhealthy d/yr today · 0 by 30 yrs out
Nearby sold comps map
Loading sold comps map…
Walkable amenities ~0.75 mi
Loading nearby amenities…
Taxation est. · year 1
- Rental income
- $16,266
- − Mortgage interest
- −$7,898
- − Property taxes
- −$1,106
- − Insurance
- −$705
- − Repairs & maintenance
- −$1,301
- − Management
- −$1,301
- − Depreciation
- −$4,102
- Taxable loss
- −$148
- Est. tax savings @ 24.0%
- +$36
- After-tax cash flow
- $2,201/yr
For passive investors: Depreciation is non-cash, so a rental often shows a tax loss while cash-flowing — sheltering income. Rental losses are passive: they offset passive income freely, and up to $25,000/yr can offset ordinary (W-2) income if you actively participate and your MAGI is under $100k (phasing out to $0 by $150k); unused losses carry forward. On sale, claimed depreciation is recaptured at up to 25%, and gains may owe capital-gains tax (a 1031 exchange can defer both). Figures are a year-1 estimate at your 24.0% rate — not tax advice; consult a CPA.
Schools (NCES district)
- District
- Petal School District
- NCES district ID
- 2803530
- Math proficiency
- 68% ▼ -8.00%
- Reading proficiency
- 56% ▼ -6.00%
- Median HH income
- $51,872
- Composite
- 52.97/100
- National rank
- #1526
- State rank
- #2 of 130 in MS
Livability — Petal
- Score
- 73/100
- State rank
- #18
- US rank
- #5565
Category grades
Schools grade is shown separately in the Schools card above.
Census & demographics
- Census place
- Petal, MS
- County
- Forrest County · 65,413 people
- City population
- 22,882
- Metro
- Hattiesburg, MS
- Population (ZIP)
- 22,882
- Household income
- $74,035
- Rent vs Own
- Severe rent burden
- 199.0
Population outlook (Forrest County) Hauer SSP2
- Today (2025)
- 79,264 people
- By 2030
- 80,822 · +2.0%
- By 2040
- 82,979 · +4.7%
- By 2050
- 84,324 · +6.4%
- By 2075
- 84,942 · +7.2%
- By 2100
- 80,616 · +1.7%
Race, ethnicity, and origin ACS 2023
- Neighborhood character
- Predominantly White (81%)
- Race & ethnicity
- White 81% Black 13% Two or more races 3% Hispanic / Latino 3%
- Common ancestry
- Lithuanian 4% Slovak 2% Italian 1%
- Foreign-born
- 2% · Canada, Vietnam
- Languages at home
- 98% English-only · Spanish 2%
Political lean MEDSL · Forrest
- 2024 margin
- R (+17.9) · D 40.3% · R 58.2% · Other 1.4%
- 2008→2024 swing
- -4.4pp toward R · 2008: -13.5pp · 2024: -17.9pp
- All cycles
- 2024: R+17.9 2020: R+11.1 2016: R+14.2 2012: R+11.7 2008: R+13.5
Not yet ingested
- Civics
- —
Market trends
- HPI YoY
- ▼ -96.97%
- Current HPI
- 158.6021
- Rent YoY
- —
- Metro
- Hattiesburg, MS
- State GDP YoY
- —
- F500 in state
- 0
Price history
+4.4% since first listed6 events — show timeline
- 2026-06-05 Listed $141,000 HAAR
- 2023-02-23 Sold (MLS) — HAAR
- 2022-07-15 Listed $135,000 HAAR
- 2022-05-16 Sold (Public Records) — Public Records
- 2021-11-29 Sold (Public Records) — Public Records
- 2005-11-07 Sold (Public Records) — Public Records
Property tax history
+9.6%/yrLatest (2025): $1,106 · +20.0% YoY. Source: county tax records.
Cash-flow waterfall
monthlySold comps — $/sqft
last 12 mo · ≤1 miLoading sold comps…