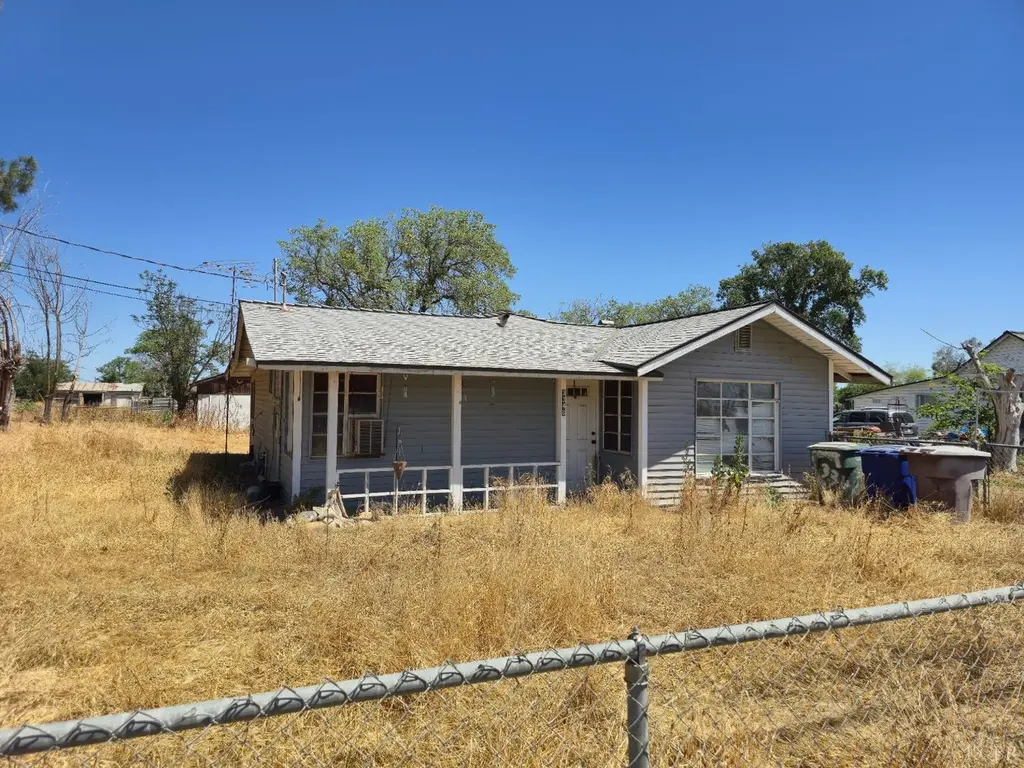
3346 W Kruger Ave · Riverdale, CA
Flood risk 1/10 · Minimal
- FEMA flood zone
- X (unshaded)
- Chance of flooding over 30 yrs
- 0.0%
- Est. flood insurance / yr
- $507 – $1,088
Fire risk 5/10 · Moderate
- Est. fire insurance / yr
- $659 – $1,223
Heat risk 8/10 · Major
- Hot days now (above 105°F)
- 7 days/yr
- Hot days in 30 yrs
- 19 days/yr
Wind risk 1/10 · Minimal
- Chance of severe wind over 30 yrs
- —
Air-quality risk 10/10 · Severe
- Unhealthy air days now
- 30 days/yr
- Unhealthy air days in 30 yrs
- 31 days/yr
Risk factors via First Street. Map © Google.
Why this score? — see what drove the D grade
The composite is a weighted blend of 9 inputs, each scored 0–100. Each bar is that input's sub-score; the figure is the points it added to the 100-point composite (weight × sub-score).
- ARV discount +15.0/15.0
- Appreciation +10.0/10.0
- Cash flow +5.8/30.0
- Livability +2.7/5.0
- Rent growth +2.5/5.0
- Condition / age +2.5/5.0
- Schools +2.4/10.0
- 1% rule +0.5/10.0
- DSCR +0.2/10.0
$200,000
🖨 Deal sheet 📄 Offer letter ✓ Due diligence
Listing remarks
Investor special! This 2bd, 1 bath home located in an established neighborhood of Riverdale. Nice size lot.
Key facts
- 0.71 acre lot
- Built 1950
- Listed 7 days
Property features AI
Exterior
- Parking: No parking listed
- Utilities: Public water; Public sewer
- Home design: Single-family residence; One-story
- Exterior features: Composition roof; City street frontage; Zoned R1
Interior
- Kitchen: Electric range; Electric oven; Range hood
- Bathrooms: 1 full bathroom
- Heating & cooling: Wall/window cooling unit
- Interior features: Range hood; Gas water heater; Electric range and oven; Wall/window cooling unit
- Laundry & utility: Dedicated laundry room
Neighborhood map
What this means for you Summary
Snapshot
- This is a 2-bed/1.0-bath single-family listed at $200k.
Deal economics
- At list price, monthly cash flow is $-398 ($-5k/yr) — negative.
- To cash-flow at today's rent, offer at most $130k (35.2% below list).
- To meet the 1% rule (rent ≥ 1% of price), the offer needs to be $110k (45.0% below list).
- Recommended offer: $110k (45.0% below list) — sets the bar for 1% rule.
Location & tenants
- Location reads 53/100 on livability (#959 in CA) — a working-class tenant base; expect higher turnover. Watch: cost of living C-, commute D, schools F.
- Riverdale Joint Unified (town): math 20% / reading 37% proficiency, ranked #366 of 517 in CA (top 71%) — low school quality limits family demand, transient renter base, plan for 1-2y turnover; 76% free/reduced lunch — lower-income household profile, screen leases tightly.
- Market conditions: 13 active listings in the ZIP; 2 comparable units currently listed for rent nearby; 2,426 units permitted in Fresno County in 2024 (296 in 5+ unit buildings).
Forward outlook
- In year one you build about $21k of equity ($1k loan paydown + $20k appreciation (10.0% local appreciation)).
- Fresno County population projected at +11% by 2050 — modest demand growth; plan on rents tracking national, not racing it.
- By year 2, paydown + projected appreciation supports a ~$34k cash-out refi (75% LTV) — recoverable capital for the next deal without selling this one.
Negotiation context
- Only 7 days on market — expect competitive offers; lowballing is unlikely to land.
Risks & watch-outs
- Watch-outs: built in 1950 — expect roof / HVAC / electrical / plumbing capex.
- Climate carrying-cost: moderate wildfire risk; extreme-heat days projected 7→19/yr by 2055 (HVAC capex compounding) — expect insurance premiums to compound above CPI over the hold.
Questions for the listing agent
- What do current leases actually rent for vs. the listed asking? Can we see a recent rent roll and the last 12 months of T-12 income?
- Built in 1950 — when were the roof, HVAC, electrical panel, plumbing, and water heater last replaced?
- Is there a deadline driving the sale (1031 exchange, divorce, estate, relocation)? That informs how much negotiation room exists.
- Schools are F-rated, which usually means shorter tenancies and higher turnover. Who's the typical renter profile here, and what's been the actual vacancy rate?
- The area grade is low — what's the realistic commute time and amenity access for the typical tenant pool here? Any planned neighborhood developments (good or bad) we should know about?
- What's the average days-on-market for RENTAL listings here right now (not sales)? A rising rental-DOM trend means longer vacancies and softer asking-rent achievability than the comps imply.
- What's the recent tenant-quality profile in this submarket — average credit score on applications, eviction rate, late-payment / NSF rate, and stable-employment percentage? A property-management company in the area should have these aggregated.
- How much new for-sale + rental construction is in the pipeline within 1–3 miles? Heavy new supply typically softens prices + rents 12–24 months out; constrained supply supports both.
Investment metrics
- 1% rule
- 0.55% ✗
- Cap rate
- 3.90%
- Cash-on-cash
- -8.54%
- DSCR
- 0.62
- GRM
- 15.2
CMA / ARV
- ARV (median comp)
- $282,955
- List price
- $200,000
- Delta
- -29.32%
- Verdict
- UNDERPRICED
- Comps
- 20 within 1.0 mi
Show comp detail 10 sales within ~0.75 mi
| Address | Dist | Beds/Ba | Sqft | Sold | Price | $/sf | Match |
|---|---|---|---|---|---|---|---|
| 3346 W Kruger Ave | 0.00mi | 2/1.0 | 1,012 (0%) | 1mo | $220,000 | $217 | 100 |
| 3210 W Kruger Ave | 0.10mi | 2/1.0 | 950 (-6%) | 6mo | $350,000 | $368 | 80 |
| 21173 S Valentine Ave | 0.10mi | 2/1.0 | 984 (-3%) | 22mo | $309,900 | $315 | 72 |
| 3828 Paloma St | 0.54mi | 2/1.0 | 948 (-6%) | 7mo | $280,000 | $295 | 58 |
| 21166 S Valentine Ave | 0.08mi | 3/1.0 (+1) | 1,147 (+13%) | 18mo | $277,200 | $242 | 54 |
| 20720 S Haslam Ave | 0.41mi | 2/1.0 | 900 (-11%) | 12mo | $295,000 | $328 | 53 |
| 21412 S Pleasant Ave | 0.69mi | 3/1.0 (+1) | 1,056 (+4%) | 4mo | $287,000 | $272 | 52 |
| 3230 W Stathem St | 0.44mi | 3/2.0 (+1) | 1,148 (+13%) | 2mo | $347,000 | $302 | 46 |
| 21435 S Pleasant Ave | 0.67mi | 3/1.8 (+1) | 1,104 (+9%) | 3mo | $268,000 | $243 | 43 |
| 21465 S Wyatt Ave | 0.74mi | 3/1.8 (+1) | 1,104 (+9%) | 1mo | $300,000 | $272 | 41 |
Match score weights: distance 35% · size 25% · config 20% · recency 20%. Top-matched comps best support the ARV.
Projected returns pro-forma
10.0% appreciation · 3.0% rent growth · sell at horizon
- IRR
- 18.3%
- Equity multiple
- 2.49×
- Total profit
- $83,501
- Equity at exit
- $180,176
- IRR
- 17.0%
- Equity multiple
- 5.75×
- Total profit
- $265,739
- Equity at exit
- $388,556
Cash invested: $56,000 (down + closing). Projections, not guarantees.
Landlord ↔ Tenant lean methodology
- Overall (STATE)
- 18 Strongly Tenant-Friendly
- State California
- 18 Strongly Tenant-Friendly · D+13
- County
- — inherits STATE
- City
- — inherits STATE
ZIP-level market 93656
- Home prices YoY
- 11.6%
- Active inventory
- 13
- Price-to-rent
- 15.2×
Monthly cashflow live
- Estimated rent
- $1,100 medium interval (Pro) →
- Mortgage (P&I)
- −$1,049
- Tax from tax record
- −$135 /mo · $1,622/yr
- Insurance
- −$83
- HOA
- −$0
- Vacancy / Maint / Mgmt
- −$231
- Net cashflow
- $-398
Break-even live
UW: 25.0% down · 7.5% · 30yr · 1.5% tax · 5.0% vac · 8.0% maint · 8.0% mgmt
Financing live
Cash to close
- Down payment
- $50,000
- Closing costs
- $6,000
- Reserves months
- —
- Total cash needed
- —
Loan-product check · same deal, 3 products live
Conventional
25% down · 7.5% · 30yr
- Down + closing
- —
- Monthly P&I
- —
- Monthly cashflow
- —
- DSCR
- —
- Eligible?
- —
Personal DTI + credit; lowest rate.
DSCR
20% down · 8.5% · 30yr
- Down + closing
- —
- Monthly P&I
- —
- Monthly cashflow
- —
- DSCR
- —
- Eligible?
- —
No personal income docs; deal must DSCR.
Hard money
10% down · 12.0% · 12mo
- Down + closing
- —
- Monthly P&I
- —
- Monthly cashflow
- —
- DSCR
- —
- Eligible?
- —
Short-term bridge; refi at stabilization.
Rent comps 2 comps
| Address | Beds | Baths | Sqft | Rent | $/sqft | DOM | Units | Dist |
|---|---|---|---|---|---|---|---|---|
| 3447 Henson Ave Unit 1 Riverdale, CA | 2.0 | 1.0 | 950 | $1,100 | $1.16 | 14d | 1 | 0.27mi |
| 3447 Henson Ave Unit 2 Riverdale, CA | 2.0 | 1.0 | 950 | $1,100 | $1.16 | 19d | 1 | 0.27mi |
Listing history 2 events
-
2026-05-18status Pending 107-char remark
-
2026-05-11$200,000 Active 107-char remark
ⓘ Source: listings_history table (triggers on properties + properties_extension) + one-shot
backfill from property_details.listing_events for pre-trigger history.
Tax reassessment forecast CA · Resets to sale price
- Current annual tax
- $1,622 · $135/mo
- Projected year-2 tax
- $1,622 · $135/mo
- Expected delta
- $0/yr ($0/mo · 0.0%)
ⓘ Screening estimate from a state-policy table — verify with the county assessor before closing.
Climate risk First Street
- Flood 1/10 Low FEMA zone X (unshaded) · 0% chance over 30 yrs
- Wildfire 5/10 Major
- Heat 8/10 Severe 7 d/yr ≥105°F today · 19 d/yr by 30 yrs out
- Wind 1/10 Low
- Air quality 10/10 Extreme 30 unhealthy d/yr today · 31 by 30 yrs out
Nearby sold comps map
Loading sold comps map…
Walkable amenities ~0.75 mi
Loading nearby amenities…
Taxation est. · year 1
- Rental income
- $13,200
- − Mortgage interest
- −$11,203
- − Property taxes
- −$1,622
- − Insurance
- −$1,000
- − Repairs & maintenance
- −$1,056
- − Management
- −$1,056
- − Depreciation
- −$5,818
- Taxable loss
- −$8,556
- Est. tax savings @ 24.0%
- +$2,053
- After-tax cash flow
- $-2,727/yr
For passive investors: Depreciation is non-cash, so a rental often shows a tax loss while cash-flowing — sheltering income. Rental losses are passive: they offset passive income freely, and up to $25,000/yr can offset ordinary (W-2) income if you actively participate and your MAGI is under $100k (phasing out to $0 by $150k); unused losses carry forward. On sale, claimed depreciation is recaptured at up to 25%, and gains may owe capital-gains tax (a 1031 exchange can defer both). Figures are a year-1 estimate at your 24.0% rate — not tax advice; consult a CPA.
Schools (NCES district)
- District
- Riverdale Joint Unified
- NCES district ID
- 0600040
- Math proficiency
- 20% ▼ -12.00%
- Reading proficiency
- 37% ▼ -5.00%
- Median HH income
- $44,830
- Composite
- 24.4/100
- National rank
- #7685
- State rank
- #366 of 517 in CA
Livability — Riverdale
- Score
- 53/100
- State rank
- #959
- US rank
- #24485
Category grades
Schools grade is shown separately in the Schools card above.
Census & demographics
- Census place
- Riverdale, CA
- Population (ZIP)
- 6,224
Population outlook (Fresno County) Hauer SSP2
- Today (2025)
- 1,042,971 people
- By 2030
- 1,072,198 · +2.8%
- By 2040
- 1,122,408 · +7.6%
- By 2050
- 1,157,251 · +11.0%
- By 2075
- 1,182,575 · +13.4%
- By 2100
- 1,105,899 · +6.0%
Race, ethnicity, and origin ACS 2023
- Neighborhood character
- Predominantly Hispanic (76%)
- Race & ethnicity
- Hispanic / Latino 76% White 22% Two or more races 19%
- Hispanic origin (detail)
- Mexican 76%
- Common ancestry
- Russian 6% Italian 2% Scotch-Irish 1%
- Foreign-born
- 35% · Canada
- Languages at home
- 31% English-only · Spanish 64% Arabic 3% Other Indo-European 1%
Political lean MEDSL · Fresno
- 2024 margin
- Toss-up / Even · D 46.5% · R 50.9% · Other 2.6%
- 2008→2024 swing
- -6.5pp toward R · 2008: 2.1pp · 2024: -4.4pp
- All cycles
- 2024: R+4.4 2020: D+7.8 2016: D+3.9 2012: R+2.9 2008: D+2.1
Not yet ingested
- Civics
- —
Market trends
- HPI YoY
- ▲ 36.64%
- Current HPI
- 353.8029
- Rent YoY
- —
- Metro
- —
- State GDP YoY
- ▲ 3.21%
- F500 in state
- 116
Industry mix (Fortune 500 HQ in CA)
| Industry | F500 HQs | Revenue |
|---|---|---|
| Technology | 27 | $1,492B |
|
||
| Financial Services | 3 | $174B |
|
||
| Retail | 3 | $44B |
|
||
| Insurance | 3 | $26B |
|
||
| Media / Entertainment | 2 | $115B |
|
||
| Pharmaceuticals / Biotech | 2 | $62B |
|
||
Price history
+10.0% since first listed4 events — show timeline
- 2026-06-02 Sold (Public Records) $220,000 Public Records
- 2026-06-02 Sold (MLS) $220,000 KCBOR
- 2026-05-18 Pending — KCBOR
- 2026-05-11 Listed $200,000 KCBOR
Property tax history
+20.1%/yrLatest (2025): $1,622 · +2.4% YoY. Source: county tax records.
Cash-flow waterfall
monthlySold comps — $/sqft
last 12 mo · ≤1 miLoading sold comps…