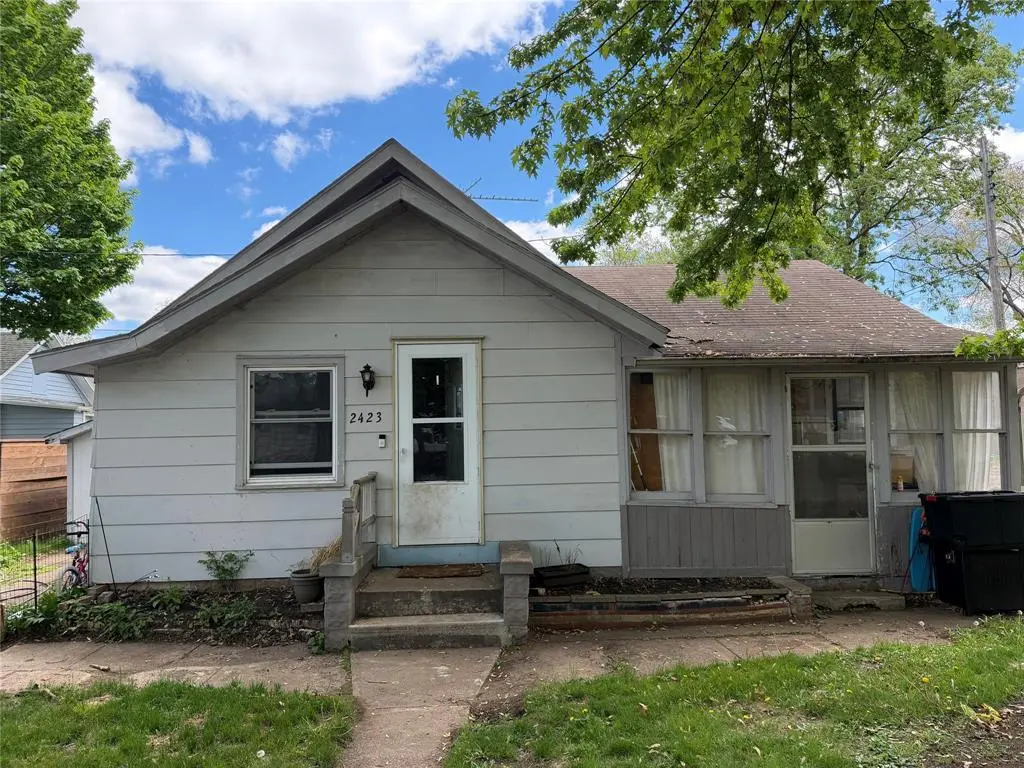
2423 6th St · Eau Claire, WI
Flood risk 5/10 · Moderate
- FEMA flood zone
- X (unshaded)
- Chance of flooding over 30 yrs
- 0.24%
- Est. flood insurance / yr
- $473 – $860
Fire risk 1/10 · Minimal
- Est. fire insurance / yr
- $636 – $1,182
Heat risk 2/10 · Minimal
- Hot days now (above 98°F)
- 7 days/yr
- Hot days in 30 yrs
- 14 days/yr
Wind risk 1/10 · Minimal
- Chance of severe wind over 30 yrs
- —
Air-quality risk 2/10 · Minimal
- Unhealthy air days now
- 1 days/yr
- Unhealthy air days in 30 yrs
- 1 days/yr
Risk factors via First Street. Map © Google.
Why this score? — see what drove the B- grade
The composite is a weighted blend of 9 inputs, each scored 0–100. Each bar is that input's sub-score; the figure is the points it added to the 100-point composite (weight × sub-score).
- Cash flow +23.8/30.0
- ARV discount +15.0/15.0
- DSCR +7.7/10.0
- 1% rule +6.2/10.0
- Livability +4.5/5.0
- Schools +3.5/10.0
- Rent growth +3.0/5.0
- Condition / age +2.5/5.0
- Appreciation +0.0/10.0
$134,999
🖨 Deal sheet 📄 Offer letter ✓ Due diligence
Listing remarks
Why rent when you can own your very own 2 bedroom home right in the middle of Eau Claire! This charming 2 bedroom house offers everything you need in a small package. Featuring 2 bedrooms on the main level a full bath and a good sized kitchen. The basement has plenty of storage plus hook ups for washer and dryer. Come and take a look at this charming house before its gone.
Key facts
- 2,748 sq ft lot
- Built 1928
- Listed 29 days
Property features AI
Finance
- Financial info: Possible income-producing property
Exterior
- Utilities: Municipal water; Municipal sewer; Electric service
- Home design: Single-family, one-story home; Estimated finished above-grade area about 710
- Construction: Poured concrete foundation
- Exterior features: Hardboard siding; Lot under 1/2 acre (approx. 0.0631 acre)
Interior
- Kitchen: Kitchen on main level (approx. 15 x 12)
- Bedrooms: Main-level master bedroom approximately 12 x 12; Main-level second bedroom approximately 12 x 12
- Bathrooms: One full bathroom
- Heating & cooling: Forced-air heating (oil-fired); Central air conditioning
- Interior features: Circuit breakers; Full poured concrete basement
Neighborhood map
What this means for you Summary
Snapshot
- This is a 2-bed/1.0-bath single-family listed at $135k.
Deal economics
- At list price, monthly cash flow is $259 ($3k/yr) — positive.
- The deal already cash-flows at list — no discount required.
- Meets the 1% rule at list price ($2k rent vs $135k).
- Recommended offer: $133k (1.5% below list) — sets the bar for market timing.
- Cap rate 8.6% vs local median 2.4% in Eau Claire — top-decile yield for the area; either an underpriced asset or a hidden risk that comps aren't pricing in. Stress-test before assuming the spread holds.
Location & tenants
- Location reads 89/100 on livability (#10 in WI, #121 nationally) — a professional / high-income tenant draw. Strengths: amenities A+, cost of living A+, housing A+.
- Eau Claire Area School District (urban): math 38% / reading 43% proficiency, ranked #150 of 342 in WI (top 44%) — families likely to look elsewhere, expect single-tenant / working-renter base with shorter leases.
- Market conditions: Rents rising (+2.0%/yr); 212 active listings in the ZIP; 10 comparable units currently listed for rent nearby; rentals lingering (median 44d on market — plan ~5-8 weeks vacancy on turnover, expect pricing pressure); 50% of comp listings sitting > 30 days — soft ceiling on asking rent; 583 units permitted in Eau Claire County in 2024 (325 in 5+ unit buildings).
Forward outlook
- Local home prices are declining (-3.0%/yr); year-one equity from $933 of loan paydown is wiped out by about $4k of value loss. Plan a longer hold.
- Eau Claire County population projected at +14% by 2050 — modest demand growth; plan on rents tracking national, not racing it.
Negotiation context
- It's been on market 30 days — a 2% lower offer ($133k) is reasonable based on typical stale-listing flexibility.
- 2 sale attempts since 16y ago with the ask held roughly flat each time — persistent listings suggest the price (not the market) is what's stuck; bring a comps-based counter.
- Current owner paid $97k; 39% above their basis — modest negotiation headroom, anchor on the comps not their cost.
Risks & watch-outs
- Watch-outs: built in 1928 — expect roof / HVAC / electrical / plumbing capex.
- Climate carrying-cost: moderate flood risk — expect insurance premiums to compound above CPI over the hold.
Questions for the listing agent
- Built in 1928 — when were the roof, HVAC, electrical panel, plumbing, and water heater last replaced?
- Is there a deadline driving the sale (1031 exchange, divorce, estate, relocation)? That informs how much negotiation room exists.
- Schools are B-rated — typically a magnet for longer-tenancy family renters. What's the average tenant stay here, and is there a school-zone premium baked into asking?
- What's the average days-on-market for RENTAL listings here right now (not sales)? A rising rental-DOM trend means longer vacancies and softer asking-rent achievability than the comps imply.
- What's the recent tenant-quality profile in this submarket — average credit score on applications, eviction rate, late-payment / NSF rate, and stable-employment percentage? A property-management company in the area should have these aggregated.
- How much new for-sale + rental construction is in the pipeline within 1–3 miles? Heavy new supply typically softens prices + rents 12–24 months out; constrained supply supports both.
Investment metrics
- 1% rule
- 1.12% ✓
- Cap rate
- 8.59%
- Cash-on-cash
- 8.21%
- DSCR
- 1.37
- GRM
- 7.5
CMA / ARV
- ARV (on-the-fly)
- $173,950
- Comps found
- 7
Show comp detail 7 sales within ~0.75 mi
| Address | Dist | Beds/Ba | Sqft | Sold | Price | $/sf | Match |
|---|---|---|---|---|---|---|---|
| 2124 8th St | 0.27mi | 2/1.0 | 756 (+6%) | 1mo | $185,000 | $245 | 76 |
| 2607 6th St | 0.10mi | 1/1.0 (-1) | 622 (-12%) | 2mo | $160,000 | $257 | 68 |
| 2024 1st St | 0.43mi | 2/1.5 | 780 (+10%) | 3mo | $200,000 | $256 | 60 |
| 418 Cedar St | 0.14mi | 1/1.0 (-1) | 619 (-13%) | 14mo | $145,000 | $234 | 56 |
| 933 James St | 0.56mi | 2/1.0 | 726 (+2%) | 20mo | $177,500 | $244 | 54 |
| 1819 9th St | 0.47mi | 2/1.0 | 769 (+8%) | 13mo | $175,000 | $228 | 54 |
| 109 Oak Park Ave | 0.69mi | 2/1.0 | 624 (-12%) | 15mo | $160,000 | $256 | 35 |
Match score weights: distance 35% · size 25% · config 20% · recency 20%. Top-matched comps best support the ARV.
Projected returns pro-forma
-3.0% appreciation · 2.01% rent growth · sell at horizon
- IRR
- -4.9%
- Equity multiple
- 0.82×
- Total profit
- $-6,871
- Equity at exit
- $20,129
- IRR
- 3.6%
- Equity multiple
- 1.25×
- Total profit
- $9,335
- Equity at exit
- $11,672
Cash invested: $37,800 (down + closing). Projections, not guarantees.
Landlord ↔ Tenant lean methodology
- Overall (STATE)
- 73 Landlord-Friendly
- State Wisconsin
- 73 Landlord-Friendly · R+2
- County
- — inherits STATE
- City
- — inherits STATE
ZIP-level market 54703
- Rents YoY
- 2.0%
- Active inventory
- 212
- Price-to-rent
- 7.5×
Monthly cashflow live
- Estimated rent
- $1,506 high interval (Pro) →
- Mortgage (P&I)
- −$708
- Tax from tax record
- −$167 /mo · $2,005/yr
- Insurance
- −$56
- HOA
- −$0
- Vacancy / Maint / Mgmt
- −$316
- Net cashflow
- $259
Break-even live
UW: 25.0% down · 7.5% · 30yr · 1.5% tax · 5.0% vac · 8.0% maint · 8.0% mgmt
Financing live
Cash to close
- Down payment
- $33,750
- Closing costs
- $4,050
- Reserves months
- —
- Total cash needed
- —
Loan-product check · same deal, 3 products live
Conventional
25% down · 7.5% · 30yr
- Down + closing
- —
- Monthly P&I
- —
- Monthly cashflow
- —
- DSCR
- —
- Eligible?
- —
Personal DTI + credit; lowest rate.
DSCR
20% down · 8.5% · 30yr
- Down + closing
- —
- Monthly P&I
- —
- Monthly cashflow
- —
- DSCR
- —
- Eligible?
- —
No personal income docs; deal must DSCR.
Hard money
10% down · 12.0% · 12mo
- Down + closing
- —
- Monthly P&I
- —
- Monthly cashflow
- —
- DSCR
- —
- Eligible?
- —
Short-term bridge; refi at stabilization.
Rent comps 10 comps
| Address | Beds | Baths | Sqft | Rent | $/sqft | DOM | Units | Dist |
|---|---|---|---|---|---|---|---|---|
| 1820 Whipple St Eau Claire, WI | 1.0 | 1.0 | 449 | $850 | $1.89 | 43d | 1 | 0.47mi |
| 2016 N Oxford Ave Eau Claire, WI | 2.0 | 1.0–2.0 | 1023 | $2,600 | $2.54 | 13d | 33 | 0.49mi |
| 1206 Pershing St Unit 2 Eau Claire, WI | 2.0 | 1.0 | 670 | $1,050 | $1.57 | 20d | 1 | 0.74mi |
| 1317 1st Ave Eau Claire, WI | 2.0 | 1.0 | 700 | $795 | $1.14 | 43d | 1 | 0.78mi |
| 315 Riverfront Ter Eau Claire, WI | 1.0–2.0 | 1.0–2.0 | 974 | $1,725 | $1.77 | 43d | 10 | 0.91mi |
| 224 N Barstow St Eau Claire, WI | 1.0–2.0 | 1.0–2.0 | 828 | $2,350 | $2.84 | 13d | 20 | 0.99mi |
| 100 N Farwell St Eau Claire, WI | 2.0 | 1.0–2.0 | 787 | $2,950 | $3.75 | 13d | 13 | 1.10mi |
| 920 Oxford Ave Apt 7 Eau Claire, WI | 1.0 | 1.0 | 750 | $725 | $0.97 | 43d | 1 | 1.13mi |
| 131 S Barstow St Unit 303 Eau Claire, WI | 1.0 | 1.0 | 488 | $975 | $2.00 | 13d | 1 | 1.21mi |
| 325 Main St Eau Claire, WI | 2.0 | 1.0–2.0 | 777 | $2,300 | $2.96 | 43d | 39 | 1.36mi |
Listing history 22 events
-
2026-06-19days on market $134,999 Active 30 DOM
-
2026-06-18days on market $134,999 Active 29 DOM
-
2026-06-17days on market $134,999 Active 28 DOM
-
2026-06-16days on market $134,999 Active 27 DOM
-
2026-06-15days on market $134,999 Active 26 DOM
-
2026-06-13days on market $134,999 Active 23 DOM
-
2026-06-10days on market $134,999 Active 21 DOM
-
2026-06-09days on market $134,999 Active 20 DOM
-
2026-06-09price $134,999 Active 19 DOM
-
2026-06-08days on market $137,499 Active 19 DOM
-
2026-06-07days on market $137,499 Active 18 DOM
-
2026-06-05days on market $137,499 Active 15 DOM
-
2026-06-02days on market $137,499 Active 13 DOM
-
2026-06-01days on market $137,499 Active 12 DOM
-
2026-05-31days on market $137,499 Active 11 DOM
-
2026-05-30days on market $137,499 Active 10 DOM
-
2026-05-20$137,499 Active
-
2021-09-15soldstatus $97,000
-
2020-02-04soldstatus $75,000
-
2012-01-18historical
-
2010-09-07$64,500
-
2007-12-04soldstatus $59,000
ⓘ Source: listings_history table (triggers on properties + properties_extension) + one-shot
backfill from property_details.listing_events for pre-trigger history.
Tax reassessment forecast WI · Partial reset (capped growth)
- Current annual tax
- $2,005 · $167/mo
- Projected year-2 tax
- $2,251 · $188/mo
- Expected delta
- +$246/yr (+$21/mo · 12.3%)
ⓘ Screening estimate from a state-policy table — verify with the county assessor before closing.
Climate risk First Street
- Flood 5/10 Major FEMA zone X (unshaded) · 24% chance over 30 yrs
- Wildfire 1/10 Low
- Heat 2/10 Low 7 d/yr ≥98°F today · 14 d/yr by 30 yrs out
- Wind 1/10 Low
- Air quality 2/10 Low 1 unhealthy d/yr today · 1 by 30 yrs out
Nearby sold comps map
Loading sold comps map…
Walkable amenities ~0.75 mi
Loading nearby amenities…
Taxation est. · year 1
- Rental income
- $18,073
- − Mortgage interest
- −$7,562
- − Property taxes
- −$2,005
- − Insurance
- −$675
- − Repairs & maintenance
- −$1,446
- − Management
- −$1,446
- − Depreciation
- −$3,927
- Taxable income
- $1,013
- Est. tax owed @ 24.0%
- −$243
- After-tax cash flow
- $2,860/yr
For passive investors: Depreciation is non-cash, so a rental often shows a tax loss while cash-flowing — sheltering income. Rental losses are passive: they offset passive income freely, and up to $25,000/yr can offset ordinary (W-2) income if you actively participate and your MAGI is under $100k (phasing out to $0 by $150k); unused losses carry forward. On sale, claimed depreciation is recaptured at up to 25%, and gains may owe capital-gains tax (a 1031 exchange can defer both). Figures are a year-1 estimate at your 24.0% rate — not tax advice; consult a CPA.
Schools (NCES district)
- District
- Eau Claire Area School District
- NCES district ID
- 5504050
- Math proficiency
- 38% ▼ -9.00%
- Reading proficiency
- 43% ▬ 0.00%
- Median HH income
- $48,206
- Composite
- 34.72/100
- National rank
- #5135
- State rank
- #150 of 342 in WI
Livability — Eau Claire
- Score
- 89/100
- State rank
- #10
- US rank
- #121
Category grades
Schools grade is shown separately in the Schools card above.
Census & demographics
- Census place
- Eau Claire, WI
- County
- Eau Claire County · 96,114 people
- City population
- 87,167
- Metro
- Eau Claire, WI
- Population (ZIP)
- 44,153
- Household income
- $71,518
- Rent vs Own
- Severe rent burden
- 1614.0
Population outlook (Eau Claire County) Hauer SSP2
- Today (2025)
- 109,006 people
- By 2030
- 112,587 · +3.3%
- By 2040
- 118,674 · +8.9%
- By 2050
- 124,085 · +13.8%
- By 2075
- 135,804 · +24.6%
- By 2100
- 139,875 · +28.3%
Race, ethnicity, and origin ACS 2023
- Neighborhood character
- Predominantly White (85%)
- Race & ethnicity
- White 85% Asian 6% Two or more races 4% Hispanic / Latino 4% Black 2%
- Common ancestry
- Portuguese 16% Romanian 5% Lithuanian 3%
- Foreign-born
- 3% · Canada, China
- Languages at home
- 92% English-only · Other Asian/Pacific 4% Spanish 3%
Political lean MEDSL · Eau Claire
- 2024 margin
- D (+10.6) · D 54.6% · R 44.0% · Other 1.4%
- 2008→2024 swing
- -11.6pp toward R · 2008: 22.1pp · 2024: 10.6pp
- All cycles
- 2024: D+10.6 2020: D+10.8 2016: D+7.3 2012: D+13.6 2008: D+22.1
Not yet ingested
- Civics
- —
Market trends
- HPI YoY
- ▼ -276.20%
- Current HPI
- 218.2747
- Rent YoY
- ▲ 2.01%
- Metro
- Eau Claire, WI
- State GDP YoY
- ▲ 2.10%
- F500 in state
- 20
Industry mix (Fortune 500 HQ in WI)
| Industry | F500 HQs | Revenue |
|---|---|---|
| Industrial Machinery | 4 | $23B |
|
||
| Industrial Technology | 2 | $36B |
|
||
| Insurance | 1 | $36B |
|
||
| Professional Services | 1 | $19B |
|
||
| Utilities | 1 | $9B |
|
||
| Consumer Goods | 1 | $3B |
|
||
Price history
+133.0% since first listed6 events — show timeline
- 2026-05-20 Listed $137,499 RANWW
- 2021-09-15 Sold (Public Records) $97,000 Public Records
- 2020-02-04 Sold (Public Records) $75,000 Public Records
- 2012-01-18 Listing Removed — NORTHSTARMLS as Distributed by MLS Grid
- 2010-09-07 Listed $64,500 NORTHSTARMLS as Distributed by MLS Grid
- 2007-12-04 Sold (Public Records) $59,000 Public Records
Property tax history
+4.9%/yrLatest (2025): $2,005 · +2.2% YoY. Source: county tax records.
Cash-flow waterfall
monthlySold comps — $/sqft
last 12 mo · ≤1 miLoading sold comps…