131 N Fourth St · Wiggins, MS
Flood risk 1/10 · Minimal
- FEMA flood zone
- X (unshaded)
- Chance of flooding over 30 yrs
- 0.0%
- Est. flood insurance / yr
- $507 – $1,088
Fire risk 5/10 · Moderate
- Est. fire insurance / yr
- $1,241 – $2,305
Heat risk 8/10 · Major
- Hot days now (above 108°F)
- 7 days/yr
- Hot days in 30 yrs
- 20 days/yr
Wind risk 9/10 · Severe
- Chance of severe wind over 30 yrs
- 99.0%
Air-quality risk 1/10 · Minimal
- Unhealthy air days now
- 0 days/yr
- Unhealthy air days in 30 yrs
- 0 days/yr
Risk factors via First Street. Map © Google.
Why this score? — see what drove the B+ grade
The composite is a weighted blend of 9 inputs, each scored 0–100. Each bar is that input's sub-score; the figure is the points it added to the 100-point composite (weight × sub-score).
- Cash flow +30.0/30.0
- ARV discount +15.0/15.0
- DSCR +10.0/10.0
- 1% rule +9.2/10.0
- Schools +4.1/10.0
- Livability +3.4/5.0
- Rent growth +2.5/5.0
- Condition / age +2.2/5.0
- Appreciation +0.0/10.0
$95,000
🖨 Deal sheet 📄 Offer letter ✓ Due diligence
Listing remarks MLS
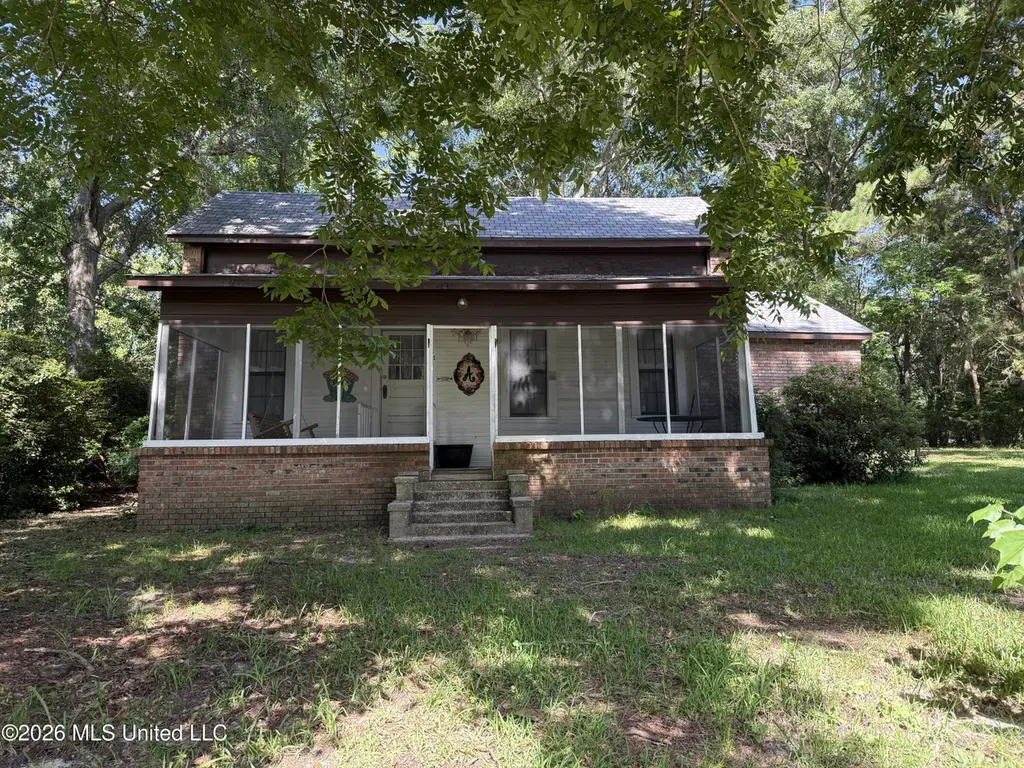
Home located in downtown Wiggins near Blaylock Park, Reynolds Field, and Flint Creek Water Park. Home has central a/c and heat. The majority of the flooring is the original wood floors. Tile flooring is installed in the bath. The exterior walls are brick. A screened porch is located on the front of the home. The yard is large and nicely shaded. Good investment property.
Key facts
- Screened front porch
- Shaded lot
- Brick exterior
Tags
Property features AI
Exterior
- Parking: Driveway
- Utilities: Public water; Public sewer; Electricity connected; Natural gas connected; Cable available
- Home design: Single family residence (house); One level; Move-in ready
- Construction: Brick veneer construction; Shingle roof; Pillar/post/pier foundation; Built area approximately 1,364 (per assessor)
- Exterior features: Porch (screened); Shed(s); See remarks; City lot with many trees; Sloped lot
Interior
- Kitchen: Dishwasher; Free-standing gas range; Free-standing refrigerator; Freezer
- Flooring: Ceramic tile; Vinyl; Wood
- Bathrooms: 1 bathroom (0.75 bath)
- Heating & cooling: Central heating (electric); Central air (electric)
- Interior features: Ceiling fans; Dead bolt locks; See remarks
- Laundry & utility: Laundry room; Washer; Dryer; Water heater
Neighborhood map
What this means for you Summary
Snapshot
- This is a 2-bed/1.0-bath single-family listed at $95k. Condition is rated fair.
Deal economics
- At list price, monthly cash flow is $408 ($5k/yr) — positive.
- The deal already cash-flows at list — no discount required.
- Meets the 1% rule at list price ($1k rent vs $95k).
- Cap rate 11.4% vs local median 4.5% in Wiggins — top-decile yield for the area; either an underpriced asset or a hidden risk that comps aren't pricing in. Stress-test before assuming the spread holds.
Location & tenants
- Location reads 68/100 on livability (#58 in MS) — a middle-class / working-renter tenant base. Strengths: cost of living A+, health & safety A+, housing B+; Watch: crime D, amenities F, commute F.
- Stone County School District (town): math 52% / reading 46% proficiency, ranked #15 of 130 in MS (top 12%) — families likely to look elsewhere, expect single-tenant / working-renter base with shorter leases.
- Zoned schools: Stone Elementary School (math 46% / reading 51%, grade D, #80 of 375 statewide, top 21%, 648 students, 100% FRL); Stone Middle School (math 54% / reading 42%, grade C-, #34 of 179 statewide, top 20%, 599 students, 100% FRL); Stone High School (math 52% / reading 42%, grade D-, #30 of 197 statewide, top 15%, 722 students, 100% FRL) — zoned schools average 100% FRL vs 56% district-wide (44 pts higher); higher-poverty schools than district average — tighter screening recommended.
- Market conditions: 70 active listings in the ZIP; 60 units permitted in Stone County in 2024 (0 in 5+ unit buildings).
Forward outlook
- Local home prices are declining (-3.0%/yr); year-one equity from $657 of loan paydown is wiped out by about $3k of value loss. Plan a longer hold.
- Stone County population projected to shrink 4% by 2050 — rents likely to lag national; underwrite the cash flow, not the appreciation.
- At projected returns (-3.0% appreciation + 3.0% rent growth), your $27k cash investment doubles in ~7 years — after that, you're playing with house money.
Negotiation context
- Only 5 days on market — expect competitive offers; lowballing is unlikely to land.
- 2 sale attempts since 8y ago with the ask held roughly flat each time — persistent listings suggest the price (not the market) is what's stuck; bring a comps-based counter.
Risks & watch-outs
- Climate carrying-cost: severe wind risk, 99% chance of damaging wind over 30y; moderate wildfire risk; extreme-heat days projected 7→20/yr by 2055 (HVAC capex compounding) — expect insurance premiums to compound above CPI over the hold.
Questions for the listing agent
- Have any recent inspections been done? Can we get a copy of the seller's disclosures and any deferred-maintenance estimates?
- Is there a deadline driving the sale (1031 exchange, divorce, estate, relocation)? That informs how much negotiation room exists.
- Crime grade is D in this area — have there been break-ins, vandalism, or insurance claims at this property in the last 3 years? What carrier currently insures it and at what premium?
- What's the average days-on-market for RENTAL listings here right now (not sales)? A rising rental-DOM trend means longer vacancies and softer asking-rent achievability than the comps imply.
- What's the recent tenant-quality profile in this submarket — average credit score on applications, eviction rate, late-payment / NSF rate, and stable-employment percentage? A property-management company in the area should have these aggregated.
- How much new for-sale + rental construction is in the pipeline within 1–3 miles? Heavy new supply typically softens prices + rents 12–24 months out; constrained supply supports both.
Investment metrics
- 1% rule
- 1.42% ✓
- Cap rate
- 11.44%
- Cash-on-cash
- 18.39%
- DSCR
- 1.82
- GRM
- 5.9
CMA / ARV
- ARV (on-the-fly)
- $182,776
- Comps found
- 12
Show comp detail 12 sales within ~0.75 mi
| Address | Dist | Beds/Ba | Sqft | Sold | Price | $/sf | Match |
|---|---|---|---|---|---|---|---|
| 221 N Vardaman St | 0.40mi | 3/1.0 (+1) | 1,384 (+2%) | 3mo | $159,997 | $116 | 71 |
| 412 Madison Ave | 0.20mi | 3/1.0 (+1) | 1,219 (-11%) | 0mo | $119,900 | $98 | 68 |
| 113 N Critz St | 0.47mi | 2/2.0 | 1,382 (+1%) | 8mo | $69,900 | $51 | 65 |
| 700 E Bond Ave | 0.16mi | 3/1.0 (+1) | 1,500 (+10%) | 11mo | $158,888 | $106 | 62 |
| 620 Stevon Moore St | 0.75mi | 3/1.0 (+1) | 1,325 (-3%) | 3mo | $120,000 | $91 | 53 |
| 210 N Mcgregor St | 0.66mi | 3/2.0 (+1) | 1,341 (-2%) | 6mo | $179,900 | $134 | 53 |
| 322 N Third St | 0.20mi | 3/2.0 (+1) | 1,160 (-15%) | 6mo | $167,500 | $144 | 52 |
| 901 Parkway Dr | 0.49mi | 3/2.0 (+1) | 1,203 (-12%) | 4mo | $170,000 | $141 | 45 |
| 315 Guthrie Dr | 0.31mi | 3/2.0 (+1) | 1,550 (+14%) | 14mo | $227,500 | $147 | 42 |
| 515 W Border Ave | 0.67mi | 3/2.0 (+1) | 1,458 (+7%) | 17mo | $242,000 | $166 | 34 |
| 312 W W Pearl Ave | 0.70mi | 3/2.0 (+1) | 1,463 (+7%) | 15mo | $199,000 | $136 | 34 |
| 1008 Rayburn Dr | 0.63mi | 3/2.0 (+1) | 1,196 (-12%) | 12mo | $71,250 | $60 | 31 |
Match score weights: distance 35% · size 25% · config 20% · recency 20%. Top-matched comps best support the ARV.
Projected returns pro-forma
-3.0% appreciation · 3.0% rent growth · sell at horizon
- IRR
- 10.1%
- Equity multiple
- 1.40×
- Total profit
- $10,588
- Equity at exit
- $14,165
- IRR
- 19.2%
- Equity multiple
- 2.61×
- Total profit
- $42,733
- Equity at exit
- $8,214
Cash invested: $26,600 (down + closing). Projections, not guarantees.
Landlord ↔ Tenant lean methodology
- Overall (STATE)
- 90 Strongly Landlord-Friendly
- State Mississippi
- 90 Strongly Landlord-Friendly · R+11
- County
- — inherits STATE
- City
- — inherits STATE
ZIP-level market 39577
- Home prices YoY
- -30.1%
- Active inventory
- 70
- Price-to-rent
- 5.9×
Monthly cashflow live
- Estimated rent
- $1,347 medium interval (Pro) →
- Mortgage (P&I)
- −$498
- Tax est. 1.5%
- −$119 /mo · $1,425/yr
- Insurance
- −$40
- HOA
- −$0
- Vacancy / Maint / Mgmt
- −$283
- Net cashflow
- $408
Break-even live
UW: 25.0% down · 7.5% · 30yr · 1.5% tax · 5.0% vac · 8.0% maint · 8.0% mgmt
Financing live
Cash to close
- Down payment
- $23,750
- Closing costs
- $2,850
- Reserves months
- —
- Total cash needed
- —
Loan-product check · same deal, 3 products live
Conventional
25% down · 7.5% · 30yr
- Down + closing
- —
- Monthly P&I
- —
- Monthly cashflow
- —
- DSCR
- —
- Eligible?
- —
Personal DTI + credit; lowest rate.
DSCR
20% down · 8.5% · 30yr
- Down + closing
- —
- Monthly P&I
- —
- Monthly cashflow
- —
- DSCR
- —
- Eligible?
- —
No personal income docs; deal must DSCR.
Hard money
10% down · 12.0% · 12mo
- Down + closing
- —
- Monthly P&I
- —
- Monthly cashflow
- —
- DSCR
- —
- Eligible?
- —
Short-term bridge; refi at stabilization.
Listing history 5 events
-
2026-06-15statusdays on market $95,000 Pending 5 DOM
-
2026-06-13days on market $95,000 Active 4 DOM
-
2026-06-12days on market $95,000 Active 3 DOM
-
2026-06-09remarks 699-char remark
-
2026-06-09$95,000 Active 1 DOM
ⓘ Source: listings_history table (triggers on properties + properties_extension) + one-shot
backfill from property_details.listing_events for pre-trigger history.
Climate risk First Street
- Flood 1/10 Low FEMA zone X (unshaded) · 0% chance over 30 yrs
- Wildfire 5/10 Major
- Heat 8/10 Severe 7 d/yr ≥108°F today · 20 d/yr by 30 yrs out
- Wind 9/10 Extreme 99% chance of damaging wind over 30 yrs
- Air quality 1/10 Low 0 unhealthy d/yr today · 0 by 30 yrs out
Nearby sold comps map
Loading sold comps map…
Walkable amenities ~0.75 mi
Loading nearby amenities…
Taxation est. · year 1
- Rental income
- $16,164
- − Mortgage interest
- −$5,321
- − Property taxes
- −$1,425
- − Insurance
- −$475
- − Repairs & maintenance
- −$1,293
- − Management
- −$1,293
- − Depreciation
- −$2,764
- Taxable income
- $3,593
- Est. tax owed @ 24.0%
- −$862
- After-tax cash flow
- $4,029/yr
For passive investors: Depreciation is non-cash, so a rental often shows a tax loss while cash-flowing — sheltering income. Rental losses are passive: they offset passive income freely, and up to $25,000/yr can offset ordinary (W-2) income if you actively participate and your MAGI is under $100k (phasing out to $0 by $150k); unused losses carry forward. On sale, claimed depreciation is recaptured at up to 25%, and gains may owe capital-gains tax (a 1031 exchange can defer both). Figures are a year-1 estimate at your 24.0% rate — not tax advice; consult a CPA.
Condition & rehab AI · 12 photos
This home requires moderate renovations to improve its condition and increase its value. Key areas for improvement include the kitchen and bathroom, as well as some exterior and interior painting.
Repairs flagged
- Moderate kitchen cabinets — dated and in need of replacement
- Moderate bathroom fixtures — dated and in need of replacement
- Minor paint — peeling in some areas
Value-add opportunities
- Both kitchen renovation — modernizing the kitchen would increase both resale and rental value
- Both bathroom renovation — modernizing the bathroom would increase both resale and rental value
- Both painting — fresh paint would improve the home's curb appeal and interior aesthetics
Renovation cost estimate screening
| Repair item | Severity | Est. cost |
|---|---|---|
| kitchen cabinets · dated and in need of replacement | Moderate | $3,000–15,000 |
| bathroom fixtures · dated and in need of replacement | Moderate | $3,000–15,000 |
| paint · peeling in some areas | Minor | $500–3,000 |
| Total estimated repair cost · 3 items | $6,500–33,000 |
Value-add ROI direction
- Both kitchen renovation — modernizing the kitchen would increase both resale and rental value ↑
- Both bathroom renovation — modernizing the bathroom would increase both resale and rental value ↑
- Both painting — fresh paint would improve the home's curb appeal and interior aesthetics ↑
ⓘ Cost ranges are severity-bucket heuristics (US national rule-of-thumb). Get contractor quotes + a written scope before underwriting a rehab budget.
Schools (NCES district)
- District
- Stone County School District
- NCES district ID
- 2804170
- Math proficiency
- 52% ▼ -8.00%
- Reading proficiency
- 46% ▼ -7.00%
- Median HH income
- $43,785
- Composite
- 41.4/100
- National rank
- #3476
- State rank
- #15 of 130 in MS
Livability — Wiggins
- Score
- 68/100
- State rank
- #58
- US rank
- #9290
Category grades
Schools grade is shown separately in the Schools card above.
Census & demographics
- Census place
- Wiggins, MS
- Population (ZIP)
- 10,488
Population outlook (Stone County) Hauer SSP2
- Today (2025)
- 18,528 people
- By 2030
- 18,585 · +0.3%
- By 2040
- 18,429 · -0.5%
- By 2050
- 17,825 · -3.8%
- By 2075
- 16,095 · -13.1%
- By 2100
- 14,276 · -22.9%
Race, ethnicity, and origin ACS 2023
- Neighborhood character
- Predominantly White (67%)
- Race & ethnicity
- White 67% Black 27% Two or more races 4% Hispanic / Latino 3%
- Common ancestry
- Lithuanian 4% Serbian 1% Italian 1%
- Foreign-born
- 1% · Canada
- Languages at home
- 99% English-only · Spanish 1%
Political lean MEDSL · Stone
- 2024 margin
- Solid R (+58.0) · D 20.5% · R 78.5% · Other 1.1%
- 2008→2024 swing
- -14.5pp toward R · 2008: -43.5pp · 2024: -58.0pp
- All cycles
- 2024: R+58.0 2020: R+52.8 2016: R+53.5 2012: R+45.9 2008: R+43.5
Not yet ingested
- Civics
- —
Market trends
- HPI YoY
- ▼ -68.19%
- Current HPI
- 158.2419
- Rent YoY
- —
- Metro
- —
- State GDP YoY
- —
- F500 in state
- 0
Price history
+63.8% since first listed3 events — show timeline
- 2026-06-09 Listed $95,000 MLSU
- 2018-04-17 Sold (MLS) — MLSU
- 2018-02-15 Listed $58,000 MLSU
Cash-flow waterfall
monthlySold comps — $/sqft
last 12 mo · ≤1 miLoading sold comps…