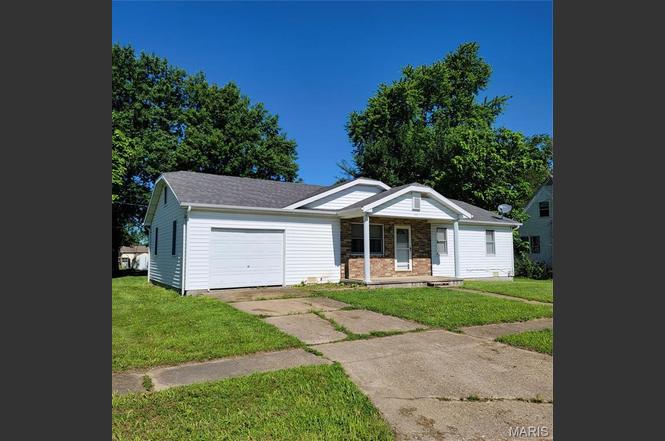
310 Linn St · Belle, MO
Flood risk No data
- FEMA flood zone
- —
- Chance of flooding over 30 yrs
- —
- Est. flood insurance / yr
- —
Fire risk No data
- Est. fire insurance / yr
- —
Heat risk No data
- Hot days now (above threshold)
- —
- Hot days in 30 yrs
- —
Wind risk No data
- Chance of severe wind over 30 yrs
- —
Air-quality risk No data
- Unhealthy air days now
- —
- Unhealthy air days in 30 yrs
- —
Risk factors via First Street. Map © Google.
Why this score? — see what drove the D+ grade
The composite is a weighted blend of 9 inputs, each scored 0–100. Each bar is that input's sub-score; the figure is the points it added to the 100-point composite (weight × sub-score).
- Cash flow +15.5/30.0
- ARV discount +7.5/15.0
- Appreciation +7.5/10.0
- DSCR +4.8/10.0
- 1% rule +3.4/10.0
- Livability +2.9/5.0
- Schools +2.8/10.0
- Rent growth +2.5/5.0
- Condition / age +2.5/5.0
$125,000
🖨 Deal sheet 📄 Offer letter ✓ Due diligence
Listing remarks
Welcome home to this 3-bedroom, 1-bath ranch-style residence built in 1990. Offering convenient one-level living, this home features a functional floor plan with comfortable living spaces. Situated on a spacious corner lot, the property boasts a large backyard with ample room for outdoor entertaining, gardening, pets, or play. Whether you're a first-time homebuyer, looking to downsize, or seeking an investment opportunity, this home offers both comfort and practicality. Located in the heart of Belle, you'll enjoy small-town living while being just minutes from local schools, the city park, restaurants, and community amenities.
Key facts
- Outdoor entertaining
- Community amenities
- Large backyard
Tags
Property features AI
Exterior
- Parking: Has garage
- Utilities: Public water; Public sewer; Electricity connected (single phase)
- Home design: Single-family residence; One story; Residential property
- Construction: Brick and vinyl siding exterior
- Exterior features: Back yard; Level lot
Interior
- Bedrooms: Three bedrooms, all on the main level
- Bathrooms: One full bathroom (main level)
- Heating & cooling: Forced air heating; Central air conditioning; Ceiling fans
- Interior features: Ceiling fans; Central air; Forced air heating
Neighborhood map
What this means for you Summary
Snapshot
- This is a 3-bed/1.0-bath other listed at $125k.
Deal economics
- At list price, monthly cash flow is $50 ($598/yr) — positive.
- The deal already cash-flows at list — no discount required.
- To meet the 1% rule (rent ≥ 1% of price), the offer needs to be $104k (16.5% below list).
- Recommended offer: $104k (16.5% below list) — sets the bar for 1% rule.
Location & tenants
- Location reads 58/100 on livability (#617 in MO) — a working-class tenant base; expect higher turnover. Strengths: cost of living A+, housing A+, crime A-; Watch: employment D, amenities F, commute F.
- Maries County R-II (rural): math 29% / reading 39% proficiency, ranked #242 of 324 in MO (top 75%) — families likely to look elsewhere, expect single-tenant / working-renter base with shorter leases.
- Zoned schools: Belle Elem. (math 47% / reading 47%, grade D-, #347 of 1,115 statewide, top 35%, 275 students, 98% FRL); Belle High (math 5% / reading 52%, grade F, #409 of 521 statewide, top 79%, 245 students, 38% FRL) — zoned schools average 68% FRL vs 51% district-wide (17 pts higher); higher-poverty schools than district average — tighter screening recommended.
- Market conditions: 17 active listings in the ZIP.
Forward outlook
- In year one you build about $7k of equity ($864 loan paydown + $6k appreciation (5.1% local appreciation)).
- Maries County population projected at -19% by 2050 — secular population decline; favor cash flow + early exit over multi-decade hold.
- At projected returns (5.1% appreciation + 3.0% rent growth), your $35k cash investment doubles in ~4 years — after that, you're playing with house money.
- By year 5, paydown + projected appreciation supports a ~$32k cash-out refi (75% LTV) — recoverable capital for the next deal without selling this one.
Negotiation context
- Only 4 days on market — expect competitive offers; lowballing is unlikely to land.
Questions for the listing agent
- Is there a deadline driving the sale (1031 exchange, divorce, estate, relocation)? That informs how much negotiation room exists.
- Schools are D-rated, which usually means shorter tenancies and higher turnover. Who's the typical renter profile here, and what's been the actual vacancy rate?
- The area grade is low — what's the realistic commute time and amenity access for the typical tenant pool here? Any planned neighborhood developments (good or bad) we should know about?
- What's the average days-on-market for RENTAL listings here right now (not sales)? A rising rental-DOM trend means longer vacancies and softer asking-rent achievability than the comps imply.
- What's the recent tenant-quality profile in this submarket — average credit score on applications, eviction rate, late-payment / NSF rate, and stable-employment percentage? A property-management company in the area should have these aggregated.
- How much new for-sale + rental construction is in the pipeline within 1–3 miles? Heavy new supply typically softens prices + rents 12–24 months out; constrained supply supports both.
Investment metrics
- 1% rule
- 0.84% ✗
- Cap rate
- 6.77%
- Cash-on-cash
- 1.71%
- DSCR
- 1.08
- GRM
- 10.0
CMA / ARV
No comps found within radius.
Projected returns pro-forma
5.1% appreciation · 3.0% rent growth · sell at horizon
- IRR
- 14.6%
- Equity multiple
- 1.93×
- Total profit
- $32,650
- Equity at exit
- $71,588
- IRR
- 15.1%
- Equity multiple
- 3.73×
- Total profit
- $95,583
- Equity at exit
- $124,177
Cash invested: $35,000 (down + closing). Projections, not guarantees.
Landlord ↔ Tenant lean methodology
- Overall (STATE)
- 81 Strongly Landlord-Friendly
- State Missouri
- 81 Strongly Landlord-Friendly · R+10
- County
- — inherits STATE
- City
- — inherits STATE
ZIP-level market 65013
- Home prices YoY
- 2.7%
- Active inventory
- 17
- Price-to-rent
- 10.0×
Monthly cashflow live
- Estimated rent
- $1,044 medium interval (Pro) →
- Mortgage (P&I)
- −$656
- Tax from tax record
- −$67 /mo · $807/yr
- Insurance
- −$52
- HOA
- −$0
- Vacancy / Maint / Mgmt
- −$219
- Net cashflow
- $50
Break-even live
UW: 25.0% down · 7.5% · 30yr · 1.5% tax · 5.0% vac · 8.0% maint · 8.0% mgmt
Financing live
Cash to close
- Down payment
- $31,250
- Closing costs
- $3,750
- Reserves months
- —
- Total cash needed
- —
Loan-product check · same deal, 3 products live
Conventional
25% down · 7.5% · 30yr
- Down + closing
- —
- Monthly P&I
- —
- Monthly cashflow
- —
- DSCR
- —
- Eligible?
- —
Personal DTI + credit; lowest rate.
DSCR
20% down · 8.5% · 30yr
- Down + closing
- —
- Monthly P&I
- —
- Monthly cashflow
- —
- DSCR
- —
- Eligible?
- —
No personal income docs; deal must DSCR.
Hard money
10% down · 12.0% · 12mo
- Down + closing
- —
- Monthly P&I
- —
- Monthly cashflow
- —
- DSCR
- —
- Eligible?
- —
Short-term bridge; refi at stabilization.
Listing history 5 events
-
2026-06-19days on market $125,000 Coming Soon 4 DOM
-
2026-06-18days on market $125,000 Coming Soon 3 DOM
-
2026-06-17days on market $125,000 Coming Soon 2 DOM
-
2026-06-16remarks 634-char remark
-
2026-06-16$125,000 Coming Soon 1 DOM
ⓘ Source: listings_history table (triggers on properties + properties_extension) + one-shot
backfill from property_details.listing_events for pre-trigger history.
Tax reassessment forecast MO · Resets to sale price
- Current annual tax
- $807 · $67/mo
- Projected year-2 tax
- $1,212 · $101/mo
- Expected delta
- +$405/yr (+$34/mo · 50.2%)
ⓘ Screening estimate from a state-policy table — verify with the county assessor before closing.
Nearby sold comps map
Loading sold comps map…
Walkable amenities ~0.75 mi
Loading nearby amenities…
Taxation est. · year 1
- Rental income
- $12,527
- − Mortgage interest
- −$7,002
- − Property taxes
- −$807
- − Insurance
- −$625
- − Repairs & maintenance
- −$1,002
- − Management
- −$1,002
- − Depreciation
- −$3,636
- Taxable loss
- −$1,548
- Est. tax savings @ 24.0%
- +$372
- After-tax cash flow
- $969/yr
For passive investors: Depreciation is non-cash, so a rental often shows a tax loss while cash-flowing — sheltering income. Rental losses are passive: they offset passive income freely, and up to $25,000/yr can offset ordinary (W-2) income if you actively participate and your MAGI is under $100k (phasing out to $0 by $150k); unused losses carry forward. On sale, claimed depreciation is recaptured at up to 25%, and gains may owe capital-gains tax (a 1031 exchange can defer both). Figures are a year-1 estimate at your 24.0% rate — not tax advice; consult a CPA.
Schools (NCES district)
- District
- Maries County R-II
- NCES district ID
- 2900001
- Math proficiency
- 29% ▼ -11.00%
- Reading proficiency
- 39% ▼ -6.00%
- Median HH income
- $33,578
- Composite
- 27.91/100
- National rank
- #6867
- State rank
- #242 of 324 in MO
Livability — Belle
- Score
- 58/100
- State rank
- #617
- US rank
- #21398
Category grades
Schools grade is shown separately in the Schools card above.
Census & demographics
- Census place
- Belle, MO
- Population (ZIP)
- 2,973
Population outlook (Maries County) Hauer SSP2
- Today (2025)
- 8,458 people
- By 2030
- 8,165 · -3.5%
- By 2040
- 7,523 · -11.1%
- By 2050
- 6,884 · -18.6%
- By 2075
- 5,825 · -31.1%
- By 2100
- 5,245 · -38.0%
Race, ethnicity, and origin ACS 2023
- Neighborhood character
- Predominantly White (96%)
- Race & ethnicity
- White 96% Two or more races 3%
- Common ancestry
- Lithuanian 3% Serbian 1% Romanian 1%
- Foreign-born
- 1%
Political lean MEDSL · Maries
- 2024 margin
- Solid R (+67.5) · D 15.8% · R 83.3%
- 2008→2024 swing
- -40.0pp toward R · 2008: -27.6pp · 2024: -67.5pp
- All cycles
- 2024: R+67.5 2020: R+64.5 2016: R+61.5 2012: R+41.1 2008: R+27.6
Not yet ingested
- Civics
- —
Market trends
- HPI YoY
- ▲ 5.10%
- Current HPI
- 192.1481
- Rent YoY
- —
- Metro
- —
- State GDP YoY
- ▲ 1.84%
- F500 in state
- 20
Industry mix (Fortune 500 HQ in MO)
| Industry | F500 HQs | Revenue |
|---|---|---|
| Healthcare | 1 | $163B |
|
||
| Insurance | 1 | $21B |
|
||
| Industrial Technology | 1 | $17B |
|
||
| Retail | 1 | $16B |
|
||
| Industrial Distribution | 1 | $10B |
|
||
| Utilities | 1 | $9B |
|
||
Price history
3 events — show timeline
- 2026-06-15 Coming Soon $125,000 MARIS as Distributed by MLS Grid
- 2022-04-15 Sold (Public Records) — Public Records
- 2010-12-14 Sold (Public Records) — Public Records
Property tax history
+1.3%/yrLatest (2025): $807 · +9.2% YoY. Source: county tax records.
Cash-flow waterfall
monthlySold comps — $/sqft
last 12 mo · ≤1 miLoading sold comps…