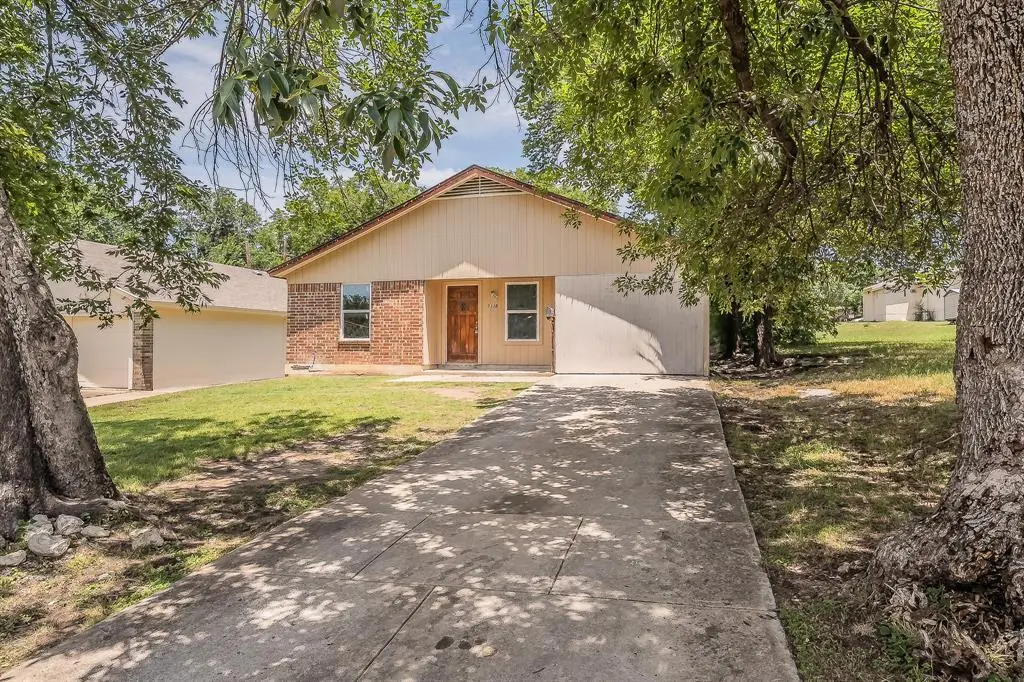
5332 Kilpatrick Ave · Fort Worth, TX
Flood risk 1/10 · Minimal
- FEMA flood zone
- X (unshaded)
- Chance of flooding over 30 yrs
- 0.0%
- Est. flood insurance / yr
- $507 – $1,088
Fire risk 1/10 · Minimal
- Est. fire insurance / yr
- $1,222 – $2,270
Heat risk 7/10 · Major
- Hot days now (above 108°F)
- 7 days/yr
- Hot days in 30 yrs
- 23 days/yr
Wind risk 4/10 · Minor
- Chance of severe wind over 30 yrs
- 24.0%
Air-quality risk 3/10 · Minor
- Unhealthy air days now
- 2 days/yr
- Unhealthy air days in 30 yrs
- 3 days/yr
Risk factors via First Street. Map © Google.
Why this score? — see what drove the B grade
The composite is a weighted blend of 9 inputs, each scored 0–100. Each bar is that input's sub-score; the figure is the points it added to the 100-point composite (weight × sub-score).
- Cash flow +28.4/30.0
- ARV discount +15.0/15.0
- DSCR +10.0/10.0
- 1% rule +9.2/10.0
- Livability +4.0/5.0
- Rent growth +3.2/5.0
- Condition / age +2.5/5.0
- Schools +2.0/10.0
- Appreciation +0.0/10.0
$120,000
🖨 Deal sheet 📄 Offer letter ✓ Due diligence
Listing remarks
INVESTOR SPECIAL! Property is being sold AS-IS. Sellers will not make any repairs prior to closing & price reflects that. Sellers will not accept any termination option period. Potential to convert the single bathroom that has a shower tub combo between two toilets into two full bathrooms. Home square footage is based on public records. But single car garage was converted. So more square footage than listed. Property also includes a shed located in the backyard. Great property that has all new windows. Buyer to verify all information contained herein.
Key facts
- All new windows
- 6,273 sq ft lot
- Built 1985
Tags
Property features AI
Finance
- Financial info: Listing available for cash or 1031 exchange
- HOA & community: No homeowners association
Exterior
- Parking: Concrete driveway
- Utilities: City water; City sewer; Electricity available; Cable available
- Home design: Single-family residence; One story; Residential property
- Construction: Built in 1985; Brick and siding construction
- Exterior features: Lot under 0.5 acre (approximately 0.144 acres); Accessory unit of about 120 sq ft
Interior
- Kitchen: Electric oven
- Bedrooms: 3 bedrooms (primary on level 1)
- Flooring: Concrete floors
- Bathrooms: 1 full bathroom
- Heating & cooling: Central heating (electric); Central air conditioning (electric); Ceiling fan(s)
- Interior features: Cable TV available; One living area; One dining area; Two total rooms
- Laundry & utility: Full-size washer/dryer area
Neighborhood map
What this means for you Summary
Snapshot
- This is a 3-bed/1.0-bath single-family listed at $120k.
Deal economics
- At list price, monthly cash flow is $388 ($5k/yr) — positive.
- The deal already cash-flows at list — no discount required.
- Meets the 1% rule at list price ($2k rent vs $120k).
- Cap rate 10.2% vs local median 3.9% in Fort Worth — top-decile yield for the area; either an underpriced asset or a hidden risk that comps aren't pricing in. Stress-test before assuming the spread holds.
Location & tenants
- Location reads 80/100 on livability (#49 in TX, #1,954 nationally) — a professional / high-income tenant draw. Strengths: amenities A+, cost of living A+, housing A+; Watch: crime F.
- Fort Worth ISD (urban): math 18% / reading 28% proficiency, ranked #742 of 826 in TX (top 90%) — low school quality limits family demand, transient renter base, plan for 1-2y turnover; 73% free/reduced lunch — lower-income household profile, screen leases tightly.
- Zoned schools: Como El (math 22% / reading 22%, grade F, #3,333 of 4,322 statewide, top 80%, 411 students, 92% FRL, charter) — zoned schools average 92% FRL vs 73% district-wide (20 pts higher); higher-poverty schools than district average — tighter screening recommended.
- Market conditions: Rents rising (+2.9%/yr); 271 active listings in the ZIP; 40 comparable units currently listed for rent nearby; rentals at typical pace (median 24d on market — plan ~3-4 weeks tenant-placement turnaround); solid renter incomes; 18,938 units permitted in Tarrant County in 2024 (8,336 in 5+ unit buildings).
Forward outlook
- Local home prices are declining (-3.0%/yr); year-one equity from $830 of loan paydown is wiped out by about $4k of value loss. Plan a longer hold.
- Tarrant County population projected at +41% by 2050 — long-run rental-demand tailwind backs the buy-and-hold thesis.
- At projected returns (-3.0% appreciation + 2.9% rent growth), your $34k cash investment doubles in ~9 years — after that, you're playing with house money.
Negotiation context
- Only 14 days on market — expect competitive offers; lowballing is unlikely to land.
Risks & watch-outs
- Watch-outs: property tax is 2.8% of price.
- Climate carrying-cost: extreme-heat days projected 7→23/yr by 2055 (HVAC capex compounding) — expect insurance premiums to compound above CPI over the hold.
Questions for the listing agent
- Property tax is high relative to price — has the assessment been appealed recently, and will the sale trigger a re-assessment?
- Is there a deadline driving the sale (1031 exchange, divorce, estate, relocation)? That informs how much negotiation room exists.
- Schools are D-rated, which usually means shorter tenancies and higher turnover. Who's the typical renter profile here, and what's been the actual vacancy rate?
- Crime grade is F in this area — have there been break-ins, vandalism, or insurance claims at this property in the last 3 years? What carrier currently insures it and at what premium?
- What's the average days-on-market for RENTAL listings here right now (not sales)? A rising rental-DOM trend means longer vacancies and softer asking-rent achievability than the comps imply.
- What's the recent tenant-quality profile in this submarket — average credit score on applications, eviction rate, late-payment / NSF rate, and stable-employment percentage? A property-management company in the area should have these aggregated.
- How much new for-sale + rental construction is in the pipeline within 1–3 miles? Heavy new supply typically softens prices + rents 12–24 months out; constrained supply supports both.
Investment metrics
- 1% rule
- 1.42% ✓
- Cap rate
- 10.17%
- Cash-on-cash
- 13.85%
- DSCR
- 1.62
- GRM
- 5.9
CMA / ARV
- ARV (on-the-fly)
- $202,581
- Comps found
- 12
Show comp detail 12 sales within ~0.75 mi
| Address | Dist | Beds/Ba | Sqft | Sold | Price | $/sf | Match |
|---|---|---|---|---|---|---|---|
| 5117 Libbey Ave | 0.30mi | 3/1.0 | 1,114 (+1%) | 10mo | $204,000 | $183 | 76 |
| 5101 Humbert Ave | 0.42mi | 3/1.0 | 1,158 (+5%) | 2mo | $200,000 | $173 | 71 |
| 5513 Geddes Ave | 0.40mi | 3/2.0 | 1,050 (-5%) | 5mo | $229,900 | $219 | 64 |
| 5836 Kilpatrick Ave | 0.54mi | 3/1.0 | 1,034 (-7%) | 2mo | $210,000 | $203 | 62 |
| 5629 Farnsworth Ave | 0.47mi | 2/1.0 (-1) | 1,120 (+1%) | 10mo | $190,000 | $170 | 62 |
| 5329 Libbey Ave | 0.17mi | 2/1.0 (-1) | 975 (-12%) | 8mo | $169,000 | $173 | 61 |
| 5818 Fletcher Ave | 0.51mi | 3/2.0 | 1,176 (+6%) | 6mo | $199,000 | $169 | 57 |
| 5321 Lovell | 0.56mi | 3/1.0 | 1,036 (-6%) | 9mo | $211,900 | $205 | 56 |
| 5525 Carver Dr | 0.52mi | 3/2.0 | 1,169 (+6%) | 9mo | $230,000 | $197 | 55 |
| 5729 Blackmore Ave | 0.47mi | 3/2.0 | 1,232 (+11%) | 10mo | $210,000 | $170 | 47 |
| 5308 Carver Dr | 0.46mi | 3/2.0 | 1,265 (+14%) | 7mo | $230,000 | $182 | 45 |
| 4716 Kilpatrick Ave | 0.72mi | 3/2.0 | 1,243 (+12%) | 2mo | $250,000 | $201 | 40 |
Match score weights: distance 35% · size 25% · config 20% · recency 20%. Top-matched comps best support the ARV.
Projected returns pro-forma
-3.0% appreciation · 2.94% rent growth · sell at horizon
- IRR
- 4.1%
- Equity multiple
- 1.16×
- Total profit
- $5,263
- Equity at exit
- $17,892
- IRR
- 13.6%
- Equity multiple
- 2.08×
- Total profit
- $36,398
- Equity at exit
- $10,375
Cash invested: $33,600 (down + closing). Projections, not guarantees.
Landlord ↔ Tenant lean methodology
- Overall (STATE)
- 87 Strongly Landlord-Friendly
- State Texas
- 87 Strongly Landlord-Friendly · R+5
- County
- — inherits STATE
- City
- — inherits STATE
ZIP-level market 76107
- Rents YoY
- 2.9%
- Active inventory
- 271
- Price-to-rent
- 5.9×
Monthly cashflow live
- Estimated rent
- $1,702 high interval (Pro) →
- Mortgage (P&I)
- −$629
- Tax from tax record
- −$277 /mo · $3,324/yr
- Insurance
- −$50
- HOA
- −$0
- Vacancy / Maint / Mgmt
- −$357
- Net cashflow
- $388
Break-even live
UW: 25.0% down · 7.5% · 30yr · 1.5% tax · 5.0% vac · 8.0% maint · 8.0% mgmt
Financing live
Cash to close
- Down payment
- $30,000
- Closing costs
- $3,600
- Reserves months
- —
- Total cash needed
- —
Loan-product check · same deal, 3 products live
Conventional
25% down · 7.5% · 30yr
- Down + closing
- —
- Monthly P&I
- —
- Monthly cashflow
- —
- DSCR
- —
- Eligible?
- —
Personal DTI + credit; lowest rate.
DSCR
20% down · 8.5% · 30yr
- Down + closing
- —
- Monthly P&I
- —
- Monthly cashflow
- —
- DSCR
- —
- Eligible?
- —
No personal income docs; deal must DSCR.
Hard money
10% down · 12.0% · 12mo
- Down + closing
- —
- Monthly P&I
- —
- Monthly cashflow
- —
- DSCR
- —
- Eligible?
- —
Short-term bridge; refi at stabilization.
Rent comps 40 comps
| Address | Beds | Baths | Sqft | Rent | $/sqft | DOM | Units | Dist |
|---|---|---|---|---|---|---|---|---|
| 5108 Kilpatrick Ave Fort Worth, TX | 3.0 | 2.0 | 1298 | $1,975 | $1.52 | 1d | 1 | 0.26mi |
| 5536 Fletcher Ave Fort Worth, TX | 2.0 | 1.0 | 852 | $1,375 | $1.61 | 24d | 1 | 0.26mi |
| 5512 Humbert Ave Fort Worth, TX | 2.0 | 1.0 | 840 | $2,000 | $2.38 | 43d | 1 | 0.33mi |
| 5529 Diaz Ave Fort Worth, TX | 3.0 | 1.0 | 816 | $1,400 | $1.72 | 6d | 1 | 0.36mi |
| 5036 Diaz Ave Fort Worth, TX | 3.0 | 2.5 | 1231 | $1,995 | $1.62 | 5d | 1 | 0.44mi |
| 3602 Eldridge St Fort Worth, TX | 1.0–2.0 | 1.0–2.0 | 916 | $1,600 | $1.75 | 2d | 10 | 0.49mi |
| 5809 Kilpatrick Ave Fort Worth, TX | 2.0 | 1.0 | 814 | $1,395 | $1.71 | 24d | 1 | 0.49mi |
| 5809 Kilpatrick Ave Fort Worth, TX | 2.0 | 1.0 | 814 | $1,395 | $1.71 | 4d | 1 | 0.49mi |
| 5729 Blackmore Ave Fort Worth, TX | 3.0 | 2.0 | 1232 | $1,645 | $1.34 | 43d | 1 | 0.49mi |
| 5002 Geddes Ave Fort Worth, TX | 2.0 | 1.0 | 924 | $1,495 | $1.62 | 43d | 1 | 0.54mi |
| 5020 Donnelly Ave Fort Worth, TX | 3.0 | 2.0 | 1200 | $2,000 | $1.67 | 13d | 1 | 0.56mi |
| 5020 Donnelly Ave #5022 Fort Worth, TX | 3.0 | 2.0 | 1200 | $2,000 | $1.67 | 11d | 1 | 0.56mi |
| 4817 Fletcher Ave Fort Worth, TX | 2.0 | 2.0 | 1195 | $1,850 | $1.55 | 24d | 1 | 0.57mi |
| 4824 Wellesley Ave Apt C Fort Worth, TX | 2.0 | 1.0 | 837 | $1,400 | $1.67 | 19d | 1 | 0.58mi |
| 4824 Wellesley Ave Unit A Fort Worth, TX | 2.0 | 1.0 | 837 | $1,400 | $1.67 | 43d | 1 | 0.58mi |
| 4825 Diaz Ave #3 Fort Worth, TX | 2.0 | 1.5 | 1140 | $1,200 | $1.05 | 43d | 1 | 0.61mi |
| 4811 Houghton Ave Fort Worth, TX | 2.0 | 2.0 | 1000 | $1,395 | $1.40 | 19d | 1 | 0.62mi |
| 4900 Geddes Ave Fort Worth, TX | 2.0 | 1.5 | 1136 | $1,650 | $1.45 | 24d | 1 | 0.62mi |
| 4914 Donnelly Ave Fort Worth, TX | 2.0 | 1.0 | 760 | $1,100 | $1.45 | 21d | 1 | 0.63mi |
| 4933 Curzon Ave Fort Worth, TX | 2.0 | 2.0 | 900 | $1,650 | $1.83 | 43d | 1 | 0.63mi |
| 4720 Wellesley Ave Fort Worth, TX | 1.0–2.0 | 1.0 | 745 | $1,175 | $1.58 | 24d | 1 | 0.66mi |
| 4720 Wellesley Ave Fort Worth, TX | 2.0 | 1.0 | 920 | $1,175 | $1.28 | 20d | 1 | 0.66mi |
| 4727 Wellesley Ave Fort Worth, TX | 2.0 | 1.0–2.0 | 786 | $1,430 | $1.82 | 10d | 15 | 0.67mi |
| 5101 Locke Ave Unit 2900 Fort Worth, TX | 2.0 | 1.0 | 995 | $1,300 | $1.31 | 24d | 1 | 0.67mi |
| 4919 Lovell Ave Unit 4919 Fort Worth, TX | 2.0 | 1.5 | 880 | $1,350 | $1.53 | 43d | 1 | 0.71mi |
| 4628 Bonnell Ave Unit 1545936P Fort Worth, TX | 3.0 | 2.0 | 1291 | $4,516 | $3.50 | 13d | 1 | 0.75mi |
| 4705 Diaz Ave Fort Worth, TX | 2.0 | 2.0 | 1140 | $1,625 | $1.43 | 43d | 1 | 0.75mi |
| 4716 Littlepage St Fort Worth, TX | 2.0 | 1.0 | 748 | $1,195 | $1.60 | 24d | 1 | 0.78mi |
| 3245 Donnelly Cir Fort Worth, TX | 1.0–2.0 | 1.0–2.5 | 1290 | $1,500 | $1.16 | 43d | 1 | 0.78mi |
| 3205 Donnelly Cir #205 Fort Worth, TX | 2.0 | 2.5 | 1206 | $1,700 | $1.41 | 24d | 1 | 0.79mi |
| 4621 Houghton Ave Fort Worth, TX | 3.0 | 1.0 | 1134 | $1,995 | $1.76 | 43d | 1 | 0.79mi |
| 3601 Westridge Ave Unit 2121 Fort Worth, TX | 2.0 | 2.0 | 1146 | $1,537 | $1.34 | 2d | 1 | 0.80mi |
| 3601 Westridge Ave Unit 3121 Fort Worth, TX | 3.0 | 2.0 | 1408 | $1,953 | $1.39 | 2d | 1 | 0.80mi |
| 3601 Westridge Ave Unit 3634 Fort Worth, TX | 3.0 | 2.0 | 1299 | $2,031 | $1.56 | 43d | 1 | 0.80mi |
| 3601 Westridge Ave Unit 3658 Fort Worth, TX | 2.0 | 2.0 | 1146 | $1,526 | $1.33 | 43d | 1 | 0.80mi |
| 4814 Lovell Ave Fort Worth, TX | 2.0 | 1.0 | 900 | $1,400 | $1.56 | 24d | 1 | 0.81mi |
| 3205 Donnelly Cir Fort Worth, TX | 2.0 | 2.0 | 1206 | $1,700 | $1.41 | 24d | 1 | 0.82mi |
| 5832 Locke Ave Fort Worth, TX | 2.0 | 2.0 | 885 | $1,550 | $1.75 | 43d | 1 | 0.84mi |
| 5832 Locke Ave Fort Worth, TX | 2.0 | 1.0 | 884 | $1,450 | $1.64 | 14d | 1 | 0.84mi |
| 4000 Hulen St Fort Worth, TX | 3.0 | 3.0 | 1409 | $2,399 | $1.70 | 19d | 1 | 0.85mi |
Listing history 10 events
-
2026-06-04status $120,000 Pending 14 DOM
-
2026-06-03days on market $120,000 Active 14 DOM
-
2026-06-02remarks 560-char remark
-
2026-06-02pricedays on market $120,000 Active 13 DOM
-
2026-06-01days on market $140,000 Active 12 DOM
-
2026-05-31days on market $140,000 Active 11 DOM
-
2026-05-20$140,000 Active
-
2009-01-05soldstatus
-
1994-02-22soldstatus
-
1991-08-22soldstatus
ⓘ Source: listings_history table (triggers on properties + properties_extension) + one-shot
backfill from property_details.listing_events for pre-trigger history.
Tax reassessment forecast TX · Resets to sale price
- Current annual tax
- $3,324 · $277/mo
- Projected year-2 tax
- $3,324 · $277/mo
- Expected delta
- $0/yr ($0/mo · 0.0%)
ⓘ Screening estimate from a state-policy table — verify with the county assessor before closing.
Climate risk First Street
- Flood 1/10 Low FEMA zone X (unshaded) · 0% chance over 30 yrs
- Wildfire 1/10 Low
- Heat 7/10 Severe 7 d/yr ≥108°F today · 23 d/yr by 30 yrs out
- Wind 4/10 Moderate 24% chance of damaging wind over 30 yrs
- Air quality 3/10 Moderate 2 unhealthy d/yr today · 3 by 30 yrs out
Nearby sold comps map
Loading sold comps map…
Walkable amenities ~0.75 mi
Loading nearby amenities…
Taxation est. · year 1
- Rental income
- $20,419
- − Mortgage interest
- −$6,722
- − Property taxes
- −$3,324
- − Insurance
- −$600
- − Repairs & maintenance
- −$1,633
- − Management
- −$1,633
- − Depreciation
- −$3,491
- Taxable income
- $3,015
- Est. tax owed @ 24.0%
- −$724
- After-tax cash flow
- $3,932/yr
For passive investors: Depreciation is non-cash, so a rental often shows a tax loss while cash-flowing — sheltering income. Rental losses are passive: they offset passive income freely, and up to $25,000/yr can offset ordinary (W-2) income if you actively participate and your MAGI is under $100k (phasing out to $0 by $150k); unused losses carry forward. On sale, claimed depreciation is recaptured at up to 25%, and gains may owe capital-gains tax (a 1031 exchange can defer both). Figures are a year-1 estimate at your 24.0% rate — not tax advice; consult a CPA.
Schools (NCES district)
- District
- Fort Worth ISD
- NCES district ID
- 4819700
- Math proficiency
- 18% ▼ -16.00%
- Reading proficiency
- 28% ▼ -6.00%
- Median HH income
- $42,109
- Composite
- 19.61/100
- National rank
- #8753
- State rank
- #742 of 826 in TX
Livability — Fort Worth
- Score
- 80/100
- State rank
- #49
- US rank
- #1954
Category grades
Schools grade is shown separately in the Schools card above.
Census & demographics
- Census place
- Fort Worth, TX
- County
- Tarrant County · 2,033,669 people
- City population
- 911,619
- Metro
- Dallas-Fort Worth-Arlington, TX
- Population (ZIP)
- 30,994
- Household income
- $79,990
- Rent vs Own
- Severe rent burden
- 2303.0
Population outlook (Tarrant County) Hauer SSP2
- Today (2025)
- 2,380,417 people
- By 2030
- 2,578,900 · +8.3%
- By 2040
- 2,974,995 · +25.0%
- By 2050
- 3,350,489 · +40.8%
- By 2075
- 4,216,909 · +77.2%
- By 2100
- 4,741,527 · +99.2%
Race, ethnicity, and origin ACS 2023
- Neighborhood character
- Diverse neighborhood (Simpson 0.58)
- Race & ethnicity
- White 59% Hispanic / Latino 20% Black 15% Two or more races 8% Asian 3%
- Hispanic origin (detail)
- Mexican 17%
- Common ancestry
- Slovak 3% Lithuanian 2% Romanian 1%
- Foreign-born
- 9% · Canada, China, Vietnam
- Languages at home
- 82% English-only · Spanish 14% French/Haitian/Cajun 1% Chinese 1%
Political lean MEDSL · Tarrant
- 2024 margin
- Lean R (+5.1) · D 46.7% · R 51.9% · Other 1.4%
- 2008→2024 swing
- +6.6pp toward D · 2008: -11.7pp · 2024: -5.1pp
- All cycles
- 2024: R+5.1 2020: D+0.2 2016: R+8.7 2012: R+15.7 2008: R+11.7
Not yet ingested
- Civics
- —
Market trends
- HPI YoY
- ▼ -447.90%
- Current HPI
- 296.4355
- Rent YoY
- ▲ 2.94%
- Metro
- Dallas-Fort Worth-Arlington, TX
- State GDP YoY
- ▲ 3.95%
- F500 in state
- 110
Industry mix (Fortune 500 HQ in TX)
| Industry | F500 HQs | Revenue |
|---|---|---|
| Energy | 16 | $1,198B |
|
||
| Technology | 5 | $198B |
|
||
| Engineering / Construction | 4 | $72B |
|
||
| Energy Services | 3 | $60B |
|
||
| Utilities | 3 | $41B |
|
||
| Healthcare | 2 | $330B |
|
||
Price history
4 events — show timeline
- 2026-05-20 Listed $140,000 NTREIS
- 2009-01-05 Sold (Public Records) — Public Records
- 1994-02-22 Sold (Public Records) — Public Records
- 1991-08-22 Sold (Public Records) — Public Records
Property tax history
+7.6%/yrLatest (2025): $3,324 · -11.3% YoY. Source: county tax records.
Cash-flow waterfall
monthlySold comps — $/sqft
last 12 mo · ≤1 miLoading sold comps…