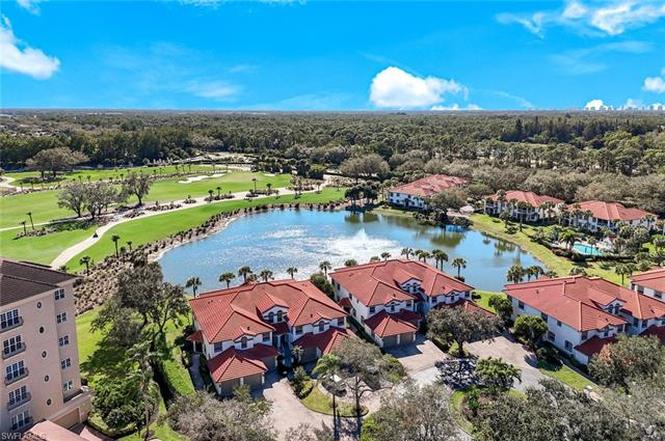
610 Laguna Royale Blvd #1001 · Vineyards, FL
Flood risk 1/10 · Minimal
- FEMA flood zone
- X (unshaded)
- Chance of flooding over 30 yrs
- 0.0%
- Est. flood insurance / yr
- $507 – $1,088
Fire risk 2/10 · Minimal
- Est. fire insurance / yr
- $947 – $1,759
Heat risk 10/10 · Severe
- Hot days now (above 107°F)
- 7 days/yr
- Hot days in 30 yrs
- 26 days/yr
Wind risk 10/10 · Severe
- Chance of severe wind over 30 yrs
- 99.0%
Air-quality risk 2/10 · Minimal
- Unhealthy air days now
- 2 days/yr
- Unhealthy air days in 30 yrs
- 2 days/yr
Risk factors via First Street. Map © Google.
Why this score? — see what drove the D grade
The composite is a weighted blend of 9 inputs, each scored 0–100. Each bar is that input's sub-score; the figure is the points it added to the 100-point composite (weight × sub-score).
- Cash flow +13.2/30.0
- ARV discount +7.5/15.0
- 1% rule +5.7/10.0
- Schools +5.0/10.0
- DSCR +4.0/10.0
- Livability +3.2/5.0
- Condition / age +2.5/5.0
- Rent growth +1.9/5.0
- Appreciation +0.0/10.0
$500,000
🖨 Deal sheet (PDF) 📄 Offer letter ✓ Due diligence
Listing remarks
This meticulously maintained first-floor end unit features an open floor plan, a single-car garage, and impressive views of the lake, fountain, and golf course. The primary suite includes a generous walk-in closet, a spacious bathroom with both a separate tub and shower, and a double-sink vanity. Features include a screened lanai with electric storm shutters, newly painted interiors, tile flooring in living areas, and in-unit laundry with extra storage. The unit is offered tastefully furnished and ready for immediate occupancy. For added peace of mind, a one-year home warranty is provided. Laguna Royale benefits from recently replaced roofs (approximately 2.5 years ago) and newly painted ex
Key facts
- Open floor plan
- Impressive views
- Walk-in closet
Tags
Property features AI
Finance
- Other: Unit is one of 40 units in the complex and one of 4 units in the building; Single-floor unit
- HOA & community: Mandatory HOA; Quarterly master HOA fee of $490; Quarterly condo fee of $2,610; Professional management; HOA maintenance covers cable, internet/Wi-Fi, irrigation water, lawn/land maintenance, manager, pest control (exterior), recreation facilities, reserves, security, street maintenance and water; Community amenities include bike and jog path, community pool, community room, community spa/hot tub, and underground utilities; Total annual recurring fees listed as $12,400
Exterior
- Parking: Attached garage with 1 garage space
- Security: Gated community; Security included in HOA maintenance
- Utilities: Central water; Central sewer; Cable available
- Home design: Residential carriage/coach-style unit in a low-rise building (1–3 stories); Built in 1995; Rear exposure to the south; Located in the Vineyards development
- Construction: Concrete block construction
- Exterior features: Patio; Automatic sprinkler system; Tile roof; Single-hung windows; Electric storm shutters; Stucco exterior; Views of golf course, lake and water features
Interior
- Kitchen: Dishwasher; Disposal; Microwave; Self-cleaning oven; Refrigerator/ice maker
- Bedrooms: 3 bedrooms
- Flooring: Carpet; Tile
- Bathrooms: 2 full bathrooms; Master bath with dual sinks and separate tub and shower
- Heating & cooling: Central electric heat; Central electric cooling; Ceiling fans
- Interior features: Built-in cabinets; Closet cabinets; Fire sprinkler system; Smoke detectors; Walk-in closet; Turnkey furnished; Split bedroom floor plan; Four ceiling fans; Breakfast room and dining/living area; Screened lanai/porch
- Laundry & utility: Washer and dryer; Laundry located in the residence; Auto garage door
Neighborhood map
What this means for you Summary
Snapshot
- This is a 3-bed/2.0-bath condo listed at $500k.
Deal economics
- At list price, monthly cash flow is $-12 ($-149/yr) — negative.
- To cash-flow at today's rent, offer at most $498k (0.4% below list).
- Meets the 1% rule at list price ($5k rent vs $500k).
- Recommended offer: $440k (12.0% below list) — sets the bar for market timing.
Location & tenants
- Location reads 64/100 on livability (#679 in FL) — a middle-class / working-renter tenant base. Strengths: crime A+, employment A+, housing A-; Watch: health & safety D, amenities F, commute F.
- Collier (suburban): math 60% / reading 56% proficiency, ranked #16 of 73 in FL (top 22%) — acceptable for families but not a draw, mixed tenant base, ~2y average lease.
- Zoned schools: Vineyards Elementary School (math 79% / reading 75%, grade A, #170 of 2,144 statewide, top 9%, 845 students, 27% FRL); Oakridge Middle School (math 75% / reading 67%, grade A, #59 of 571 statewide, top 11%, 1,183 students, 26% FRL); Gulf Coast High School (math 57% / reading 68%, grade B-, #93 of 667 statewide, top 14%, 2,447 students, 20% FRL) — zoned schools average 24% FRL vs 55% district-wide (31 pts lower); this property's tenant base skews higher-income than the district average.
- Zoned-school proficiency averages 70% at this address vs 58% district-wide (+12 pts) — the actual schools serving this property are materially stronger than the Collier average implies; a family-tenant draw the district grade alone would hide.
- Market conditions: Rents soft (-2.5%/yr); 590 active listings in the ZIP; 40 comparable units currently listed for rent nearby; rentals at typical pace (median 25d on market — plan ~3-4 weeks tenant-placement turnaround); high-income renter base; 3,520 units permitted in Collier County in 2024 (959 in 5+ unit buildings).
- At $5,332/mo this rent would consume 56% of the median local household income ($113k/yr) (locally 741% of renters already pay >50% of income on rent) — very limited rent-growth headroom before tenants either downsize or default.
Forward outlook
- Local home prices are declining (-3.0%/yr); year-one equity from $3k of loan paydown is wiped out by about $15k of value loss. Plan a longer hold.
- Collier County population projected at +30% by 2050 — long-run rental-demand tailwind backs the buy-and-hold thesis.
Negotiation context
- It's been on market 136 days — a 12% lower offer ($440k) is reasonable based on typical stale-listing flexibility.
- Current owner paid $215k; list at $500k implies a 133% gain — meaningful room to come down on a strong offer.
Risks & watch-outs
- Climate carrying-cost: severe wind risk, 99% chance of damaging wind over 30y; extreme-heat days projected 7→26/yr by 2055 (HVAC capex compounding) — expect insurance premiums to compound above CPI over the hold.
Questions for the listing agent
- What do current leases actually rent for vs. the listed asking? Can we see a recent rent roll and the last 12 months of T-12 income?
- It's been on market 136 days. Have you received any prior offers? Is the seller open to a 12% concession, seller financing, or rate buy-down credit?
- What does the HOA fee cover, when was the last increase, and are there any pending special assessments or reserve-fund shortfalls?
- Any open or pending special assessments — roof, HVAC, plumbing, elevator, façade? What's the per-unit balance and payoff schedule, and is the seller paying it off at close or rolling it to the buyer?
- Why hasn't it sold? Are there any deal-killer items the seller is aware of (foundation, flood, title, zoning, code violations)?
- Is there a deadline driving the sale (1031 exchange, divorce, estate, relocation)? That informs how much negotiation room exists.
- The area grade is low — what's the realistic commute time and amenity access for the typical tenant pool here? Any planned neighborhood developments (good or bad) we should know about?
- What's the average days-on-market for RENTAL listings here right now (not sales)? A rising rental-DOM trend means longer vacancies and softer asking-rent achievability than the comps imply.
- What's the recent tenant-quality profile in this submarket — average credit score on applications, eviction rate, late-payment / NSF rate, and stable-employment percentage? A property-management company in the area should have these aggregated.
- How much new apartment / multifamily construction is in the pipeline within 1–3 miles? Heavy new supply (>2% of stock underway) typically softens rents 12–24 months out; light construction supports rent growth.
Investment metrics
- 1% rule
- 1.07% ✓
- Cap rate
- 6.26%
- Cash-on-cash
- -0.11%
- DSCR
- 1.00
- GRM
- 7.8
CMA / ARV
No comps found within radius.
Projected returns pro-forma
-3.0% appreciation · 0.0% rent growth · sell at horizon
- IRR
- -20.6%
- Equity multiple
- 0.31×
- Total profit
- $-96,885
- Equity at exit
- $74,552
- IRR
- -25.2%
- Equity multiple
- -0.03×
- Total profit
- $-143,522
- Equity at exit
- $43,231
Cash invested: $140,000 (down + closing). Projections, not guarantees.
Landlord ↔ Tenant lean methodology
- Overall (STATE)
- 87 Strongly Landlord-Friendly
- State Florida
- 87 Strongly Landlord-Friendly · R+3
- County
- — inherits STATE
- City
- — inherits STATE
ZIP-level market 34119
- Rents YoY
- -2.5%
- Active inventory
- 590
- Price-to-rent
- 7.8×
Monthly cashflow live
- Estimated rent
- $5,332 high interval (Pro) →
- Mortgage (P&I)
- −$2,622
- Tax from tax record
- −$361 /mo · $4,331/yr
- Insurance
- −$208
- HOA
- −$1,033
- Vacancy / Maint / Mgmt
- −$1,120
- Net cashflow
- $-12
Break-even live
Sensitivity live
| Price | -10% $271 | -5% $129 | +0% $-12 | +5% $-154 | +10% $-295 |
|---|---|---|---|---|---|
| Rent | -10% $-434 | -5% $-223 | +0% $-12 | +5% $198 | +10% $409 |
| Rate | -1.0pp $239 | -0.5pp $115 | base $-12 | +0.5pp $-142 | +1.0pp $-274 |
UW: 25.0% down · 7.5% · 30yr · 1.5% tax · 5.0% vac · 8.0% maint · 8.0% mgmt
Financing live
Cash to close
- Down payment
- $125,000
- Closing costs
- $15,000
- Reserves months
- —
- Total cash needed
- —
Loan-product check · same deal, 3 products live
Conventional
25% down · 7.5% · 30yr
- Down + closing
- —
- Monthly P&I
- —
- Monthly cashflow
- —
- DSCR
- —
- Eligible?
- —
Personal DTI + credit; lowest rate.
DSCR
20% down · 8.5% · 30yr
- Down + closing
- —
- Monthly P&I
- —
- Monthly cashflow
- —
- DSCR
- —
- Eligible?
- —
No personal income docs; deal must DSCR.
Hard money
10% down · 12.0% · 12mo
- Down + closing
- —
- Monthly P&I
- —
- Monthly cashflow
- —
- DSCR
- —
- Eligible?
- —
Short-term bridge; refi at stabilization.
Rent comps 40 comps
| Address | Beds | Baths | Sqft | Rent | $/sqft | DOM | Units | Dist |
|---|---|---|---|---|---|---|---|---|
| 575 El Camino Real Unit 6 Naples, FL | 2.0 | 2.0 | 2050 | $3,700 | $1.80 | 15d | 1 | 0.08mi |
| 515 Laguna Royale Blvd #102 Naples, FL | 3.0 | 2.0 | 1900 | $2,995 | $1.58 | 15d | 1 | 0.12mi |
| 580 El Camino Real #3805 Naples, FL | 2.0 | 2.0 | 1772 | $13,500 | $7.62 | 25d | 1 | 0.14mi |
| 6115 Reserve Cir #2004 Naples, FL | 3.0 | 3.0 | 2337 | $7,000 | $3.00 | 23d | 1 | 0.25mi |
| 538 Avellino Isles Cir #9201 Naples, FL | 3.0 | 3.5 | 2717 | $9,850 | $3.63 | 23d | 1 | 0.30mi |
| 6260 Bellerive Ave #402 Naples, FL | 3.0 | 2.0 | 1708 | $7,000 | $4.10 | 23d | 1 | 0.40mi |
| 734 Regency Reserve Cir #2701 Naples, FL | 2.0 | 2.0 | 2058 | $7,900 | $3.84 | 25d | 1 | 0.41mi |
| 730 Regency Reserve Cir #2802 Naples, FL | 2.0 | 2.0 | 2050 | $8,000 | $3.90 | 25d | 1 | 0.42mi |
| 583 Avellino Isles Cir #24102 Naples, FL | 3.0 | 3.5 | 2845 | $5,000 | $1.76 | 15d | 1 | 0.45mi |
| 713 Regency Reserve Cir #5902 Naples, FL | 3.0 | 2.0 | 2050 | $7,200 | $3.51 | 25d | 1 | 0.53mi |
| 713 Regency Reserve Cir #5901 Naples, FL | 2.0 | 2.0 | 2050 | $3,295 | $1.61 | 15d | 1 | 0.53mi |
| 801 Regency Reserve Cir #4301 Naples, FL | 3.0 | 2.0 | 2050 | $6,800 | $3.32 | 25d | 1 | 0.53mi |
| 709 Regency Reserve Cir #6003 Naples, FL | 3.0 | 3.5 | 2494 | $7,900 | $3.17 | 25d | 1 | 0.54mi |
| 817 Regency Reserve Cir #3901 Naples, FL | 2.0 | 2.0 | 2058 | $7,000 | $3.40 | 25d | 1 | 0.59mi |
| 817 Regency Reserve Cir #3901 Naples, FL | 2.0 | 2.0 | 2058 | $7,000 | $3.40 | 15d | 1 | 0.59mi |
| 5895 Sonoma Ct Naples, FL | 3.0 | 4.0 | 2730 | $5,000 | $1.83 | 25d | 1 | 0.60mi |
| 271 Perignon Pl Unit 16-1 Naples, FL | 2.0 | 2.0 | 1449 | $2,700 | $1.86 | 25d | 1 | 0.61mi |
| 4681 Rio Poco Ct Naples, FL | 3.0 | 2.0 | 1547 | $3,000 | $1.94 | 25d | 1 | 0.65mi |
| 224 Via Perignon Unit 5-4 Naples, FL | 2.0 | 2.5 | 2085 | $6,000 | $2.88 | 23d | 1 | 0.69mi |
| 200 Vintage Cir Unit D304 Naples, FL | 3.0 | 2.0 | 1492 | $2,800 | $1.88 | 15d | 1 | 0.79mi |
| 210 Vintage Cir Unit C401 Naples, FL | 3.0 | 2.0 | 1520 | $6,500 | $4.28 | 15d | 1 | 0.82mi |
| 172 Vintage Cir #202 Naples, FL | 3.0 | 2.0 | 1774 | $5,195 | $2.93 | 15d | 1 | 0.88mi |
| 152 Napa Ridge Way Naples, FL | 3.0 | 2.0 | 1775 | $7,000 | $3.94 | 25d | 1 | 0.89mi |
| 155 Vintage Cir #103 Naples, FL | 2.0 | 2.0 | 1500 | $5,000 | $3.33 | 15d | 1 | 0.91mi |
| 1154 Augusta Falls Way Unit 1520030P Naples, FL | 3.0 | 2.0 | 1819 | $4,426 | $2.43 | 15d | 1 | 0.93mi |
| 6941 Hunters Rd Naples, FL | 4.0 | 2.0 | 1866 | $7,500 | $4.02 | 25d | 1 | 0.96mi |
| 5950 Almaden Dr Naples, FL | 3.0 | 2.0 | 1762 | $6,500 | $3.69 | 25d | 1 | 0.99mi |
| 102 Tuscana Ct #901 Naples, FL | 2.0 | 2.0 | 1631 | $2,300 | $1.41 | 25d | 1 | 0.99mi |
| 106 Siena Way #1508 Naples, FL | 2.0 | 2.0 | 1414 | $4,500 | $3.18 | 25d | 1 | 1.00mi |
| 103 Tuscana Ct #1107 Naples, FL | 2.0 | 2.0 | 1412 | $5,000 | $3.54 | 25d | 1 | 1.01mi |
| 104 Siena Way #1407 Naples, FL | 2.0 | 2.0 | 1450 | $7,000 | $4.83 | 25d | 1 | 1.02mi |
| 3687 El Segundo Ct Naples, FL | 2.0 | 2.0 | 1680 | $5,000 | $2.98 | 25d | 1 | 1.06mi |
| 116 Fountain Cir Naples, FL | 3.0 | 2.0 | 1561 | $4,500 | $2.88 | 25d | 1 | 1.07mi |
| 6025 Chardonnay Ln Unit 1Unit 102 Naples, FL | 2.0 | 2.0 | 1414 | $2,195 | $1.55 | 25d | 1 | 1.08mi |
| 3664 El Segundo Ct Naples, FL | 2.0 | 2.0 | 1680 | $5,500 | $3.27 | 25d | 1 | 1.11mi |
| 1156 Oakes Blvd Naples, FL | 3.0 | 2.0 | 1554 | $7,500 | $4.83 | 25d | 1 | 1.22mi |
| 3780 Fieldstone Blvd #301 Naples, FL | 3.0 | 2.0 | 1500 | $2,800 | $1.87 | 15d | 1 | 1.22mi |
| 3740 Fieldstone Blvd Unit 104 Naples, FL | 3.0 | 2.0 | 1456 | $2,300 | $1.58 | 15d | 1 | 1.23mi |
| 3320 Bermuda Isle Cir Naples, FL | 1.0–3.0 | 1.0–2.0 | 1134 | $3,270 | $2.88 | 15d | 45 | 1.36mi |
| 3049 Driftwood Way #3806 Naples, FL | 3.0 | 2.5 | 1818 | $4,700 | $2.59 | 25d | 1 | 1.37mi |
HOA detail condo
- Monthly dues
- $1,033 · $12,396/yr
- Likely covers
- electric
- Assessments
- None detected in remarks — confirm with the listing agent.
Listing history 19 events
-
2026-06-21days on market $500,000 Active 136 DOM
-
2026-06-18days on market $500,000 Active 133 DOM
-
2026-06-17days on market $500,000 Active 132 DOM
-
2026-06-16days on market $500,000 Active 131 DOM
-
2026-06-15days on market $500,000 Active 130 DOM
-
2026-06-14days on market $500,000 Active 128 DOM
-
2026-06-10days on market $500,000 Active 125 DOM
-
2026-06-09days on market $500,000 Active 124 DOM
-
2026-06-08days on market $500,000 Active 123 DOM
-
2026-06-07days on market $500,000 Active 122 DOM
-
2026-06-03days on market $500,000 Active 118 DOM
-
2026-06-02days on market $500,000 Active 117 DOM
-
2026-06-01days on market $500,000 Active 116 DOM
-
2026-05-31days on market $500,000 Active 115 DOM
-
2026-05-30days on market $500,000 Active 114 DOM
-
2026-03-17price $500,000
-
2026-02-05$525,000 Active
-
2002-01-11soldstatus $215,000
-
1995-05-24soldstatus $249,000
ⓘ Source: listings_history table (triggers on properties + properties_extension) + one-shot
backfill from property_details.listing_events for pre-trigger history.
Tax reassessment forecast FL · Resets to sale price
- Current annual tax
- $4,331 · $361/mo
- Projected year-2 tax
- $4,331 · $361/mo
- Expected delta
- $0/yr ($0/mo · 0.0%)
ⓘ Screening estimate from a state-policy table — verify with the county assessor before closing.
Climate risk First Street
- Flood 1/10 Low FEMA zone X (unshaded) · 0% chance over 30 yrs
- Wildfire 2/10 Low
- Heat 10/10 Extreme 7 d/yr ≥107°F today · 26 d/yr by 30 yrs out
- Wind 10/10 Extreme 99% chance of damaging wind over 30 yrs
- Air quality 2/10 Low 2 unhealthy d/yr today · 2 by 30 yrs out
Nearby sold comps map
Loading sold comps map…
Walkable amenities ~0.75 mi
Loading nearby amenities…
Taxation est. · year 1
- Rental income
- $63,978
- − Mortgage interest
- −$28,008
- − Property taxes
- −$4,331
- − Insurance
- −$2,500
- − Repairs & maintenance
- −$5,118
- − Management
- −$5,118
- − HOA
- −$12,396
- − Depreciation
- −$14,545
- Taxable loss
- −$8,039
- Est. tax savings @ 24.0%
- +$1,929
- After-tax cash flow
- $1,780/yr
For passive investors: Depreciation is non-cash, so a rental often shows a tax loss while cash-flowing — sheltering income. Rental losses are passive: they offset passive income freely, and up to $25,000/yr can offset ordinary (W-2) income if you actively participate and your MAGI is under $100k (phasing out to $0 by $150k); unused losses carry forward. On sale, claimed depreciation is recaptured at up to 25%, and gains may owe capital-gains tax (a 1031 exchange can defer both). Figures are a year-1 estimate at your 24.0% rate — not tax advice; consult a CPA.
Schools (NCES district)
- District
- Collier
- NCES district ID
- 1200330
- Math proficiency
- 60% ▼ -4.00%
- Reading proficiency
- 56% ▼ -2.00%
- Median HH income
- $58,275
- Composite
- 50.23/100
- National rank
- #1892
- State rank
- #16 of 73 in FL
Livability — Vineyards
- Score
- 64/100
- State rank
- #679
- US rank
- #14101
Category grades
Schools grade is shown separately in the Schools card above.
Census & demographics
- Census place
- Vineyards, FL
- County
- Collier County · 396,295 people
- Metro
- Naples-Marco Island, FL
- Population (ZIP)
- 36,807
- Household income
- $113,391
- Rent vs Own
- Severe rent burden
- 741.0
Population outlook (Collier County) Hauer SSP2
- Today (2025)
- 420,858 people
- By 2030
- 450,054 · +6.9%
- By 2040
- 502,232 · +19.3%
- By 2050
- 544,932 · +29.5%
- By 2075
- 627,203 · +49.0%
- By 2100
- 659,015 · +56.6%
Race, ethnicity, and origin ACS 2023
- Neighborhood character
- Predominantly White (74%)
- Race & ethnicity
- White 74% Hispanic / Latino 20% Two or more races 14% Black 1%
- Hispanic origin (detail)
- Mexican 6% Puerto Rican 2% Cuban 4% Dominican 2%
- Common ancestry
- Romanian 4% Lithuanian 2% Italian 2%
- Foreign-born
- 17% · Canada, Jamaica, Dominican Republic
- Languages at home
- 78% English-only · Spanish 15% Other Indo-European 3% Russian/Polish/Slavic 1%
Political lean MEDSL · Collier
- 2024 margin
- Solid R (+33.1) · D 33.1% · R 66.2%
- 2008→2024 swing
- -10.6pp toward R · 2008: -22.5pp · 2024: -33.1pp
- All cycles
- 2024: R+33.1 2020: R+24.7 2016: R+26.0 2012: R+30.1 2008: R+22.5
Not yet ingested
- Civics
- —
Market trends
- HPI YoY
- ▼ -243.12%
- Current HPI
- 269.3208
- Rent YoY
- ▼ -2.51%
- Metro
- Naples-Marco Island, FL
- State GDP YoY
- ▲ 3.28%
- F500 in state
- 36
Industry mix (Fortune 500 HQ in FL)
| Industry | F500 HQs | Revenue |
|---|---|---|
| Industrial Technology | 2 | $29B |
|
||
| Insurance | 2 | $17B |
|
||
| Retail | 1 | $60B |
|
||
| Technology Distribution | 1 | $58B |
|
||
| Homebuilding | 1 | $35B |
|
||
| Technology Manufacturing | 1 | $35B |
|
||
Price history
+100.8% since first listed4 events — show timeline
- 2026-03-17 Price Changed $500,000 NAPLESMLS
- 2026-02-05 Listed $525,000 NAPLESMLS
- 2002-01-11 Sold (Public Records) $215,000 Public Records
- 1995-05-24 Sold (Public Records) $249,000 Public Records
Property tax history
+8.8%/yrLatest (2025): $4,331 · +133.5% YoY. Source: county tax records.
Cash-flow waterfall
monthlySold comps — $/sqft
last 12 mo · ≤1 miLoading sold comps…