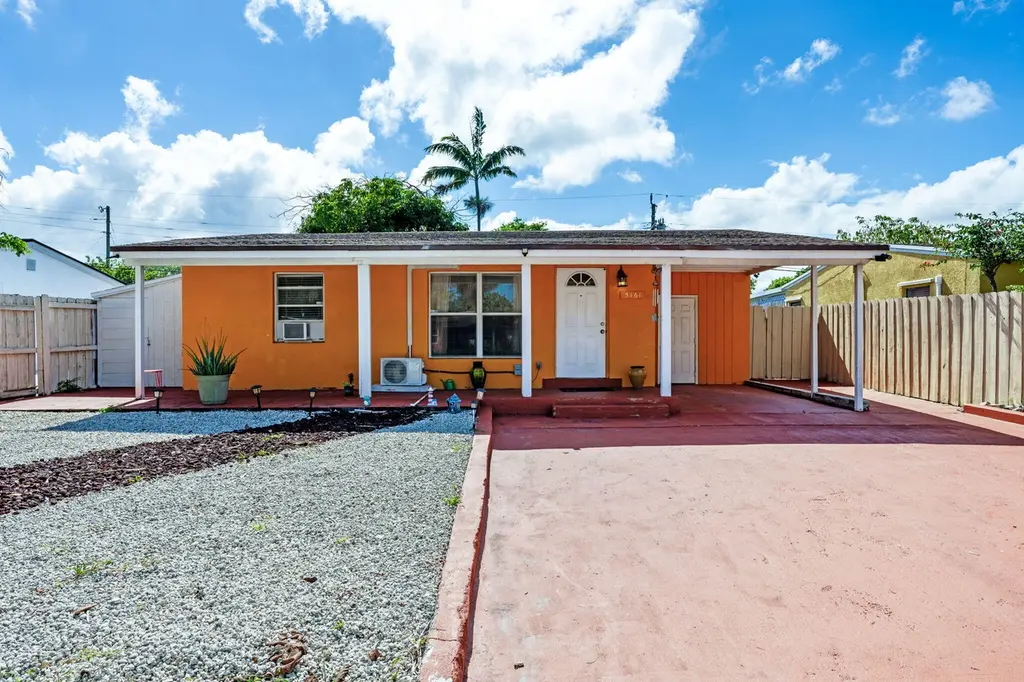
5161 N Andrews Ave · Oakland Park, FL
Flood risk 1/10 · Minimal
- FEMA flood zone
- X (shaded)
- Chance of flooding over 30 yrs
- 0.0%
- Est. flood insurance / yr
- $507 – $1,088
Fire risk 1/10 · Minimal
- Est. fire insurance / yr
- $947 – $1,759
Heat risk 10/10 · Severe
- Hot days now (above 106°F)
- 7 days/yr
- Hot days in 30 yrs
- 26 days/yr
Wind risk 10/10 · Severe
- Chance of severe wind over 30 yrs
- 99.0%
Air-quality risk 2/10 · Minimal
- Unhealthy air days now
- 1 days/yr
- Unhealthy air days in 30 yrs
- 2 days/yr
Risk factors via First Street. Map © Google.
Why this score? — see what drove the C grade
The composite is a weighted blend of 9 inputs, each scored 0–100. Each bar is that input's sub-score; the figure is the points it added to the 100-point composite (weight × sub-score).
- Cash flow +20.5/30.0
- ARV discount +15.0/15.0
- DSCR +6.5/10.0
- 1% rule +5.2/10.0
- Schools +4.1/10.0
- Livability +3.9/5.0
- Condition / age +2.5/5.0
- Rent growth +2.4/5.0
- Appreciation +0.0/10.0
$315,000
🖨 Deal sheet 📄 Offer letter ✓ Due diligence
Key facts
- Covered parking
- Fenced yard
- Mango tree
Tags
Property features AI
Finance
- Other: Pets allowed with no restrictions
Exterior
- Parking: 3 total parking spaces; Attached carport (1 covered carport space); Driveway; Concrete surfaces; 2 open parking spaces
- Utilities: Public water; Public sewer; Electricity available; Cable available; Sewer available
- Home design: Single family residence; One story; Resale property; Faces east
- Construction: Stucco and CBS construction
- Exterior features: Shingle roof; Outbuilding / shed for storage; Fenced backyard with gate (wood); Fruit trees; Room for a pool; City street frontage; Not waterfront
Interior
- Kitchen: Electric range; Microwave; Refrigerator
- Bedrooms: 2 bedrooms (main level)
- Flooring: Tile
- Bathrooms: 1 full bathroom (main level)
- Heating & cooling: Heat pump; Window/wall heating; Ductless cooling; Wall/window unit(s); Has heating and cooling
- Interior features: French doors; Tile flooring
- Laundry & utility: Indoor laundry room
Neighborhood map
What this means for you Summary
Snapshot
- This is a 2-bed/1.0-bath single-family listed at $315k.
Deal economics
- At list price, monthly cash flow is $415 ($5k/yr) — positive.
- The deal already cash-flows at list — no discount required.
- Meets the 1% rule at list price ($3k rent vs $315k).
- Cap rate 7.9% vs local median 3.8% in Oakland Park — top-decile yield for the area; either an underpriced asset or a hidden risk that comps aren't pricing in. Stress-test before assuming the spread holds.
Location & tenants
- Location reads 77/100 on livability (#193 in FL, #3,082 nationally) — a middle-class / working-renter tenant base. Strengths: commute A+, housing A+, health & safety A+; Watch: amenities F.
- Broward (suburban): math 42% / reading 53% proficiency, ranked #46 of 73 in FL (top 63%) — families likely to look elsewhere, expect single-tenant / working-renter base with shorter leases.
- Zoned schools: North Andrews Gardens Elementary School (math 40% / reading 48%, grade F, #1,330 of 2,144 statewide, top 63%, 780 students, 77% FRL); James S. Rickards Middle School (math 18% / reading 31%, grade F, #522 of 571 statewide, top 93%, 755 students, 75% FRL); Northeast High School (math 12% / reading 37%, grade F, #505 of 667 statewide, top 79%, 1,552 students, 69% FRL) — zoned schools average 74% FRL vs 51% district-wide (23 pts higher); higher-poverty schools than district average — tighter screening recommended.
- Zoned-school proficiency averages 31% at this address vs 48% district-wide (-16 pts) — the specific schools serving this property underperform the Broward average; the district grade overstates school quality for this exact location.
- Market conditions: Rents soft (-0.5%/yr); 343 active listings in the ZIP; 36 comparable units currently listed for rent nearby; rentals at typical pace (median 24d on market — plan ~3-4 weeks tenant-placement turnaround); solid renter incomes; 2,111 units permitted in Broward County in 2024 (1,265 in 5+ unit buildings).
- At $3,203/mo this rent would consume 50% of the median local household income ($77k/yr) (locally 1596% of renters already pay >50% of income on rent) — very limited rent-growth headroom before tenants either downsize or default.
Forward outlook
- Local home prices are declining (-3.0%/yr); year-one equity from $2k of loan paydown is wiped out by about $9k of value loss. Plan a longer hold.
- Broward County population projected at +34% by 2050 — long-run rental-demand tailwind backs the buy-and-hold thesis.
Negotiation context
- Only 9 days on market — expect competitive offers; lowballing is unlikely to land.
- 2 sale attempts with the ask held roughly flat each time — persistent listings suggest the price (not the market) is what's stuck; bring a comps-based counter.
- Current owner paid $180k; list at $315k implies a 75% gain — meaningful room to come down on a strong offer.
Risks & watch-outs
- Watch-outs: built in 1956 — expect roof / HVAC / electrical / plumbing capex.
- Climate carrying-cost: severe wind risk, 99% chance of damaging wind over 30y; extreme-heat days projected 7→26/yr by 2055 (HVAC capex compounding) — expect insurance premiums to compound above CPI over the hold.
Questions for the listing agent
- Built in 1956 — when were the roof, HVAC, electrical panel, plumbing, and water heater last replaced?
- Is there a deadline driving the sale (1031 exchange, divorce, estate, relocation)? That informs how much negotiation room exists.
- Schools are D-rated, which usually means shorter tenancies and higher turnover. Who's the typical renter profile here, and what's been the actual vacancy rate?
- What's the average days-on-market for RENTAL listings here right now (not sales)? A rising rental-DOM trend means longer vacancies and softer asking-rent achievability than the comps imply.
- What's the recent tenant-quality profile in this submarket — average credit score on applications, eviction rate, late-payment / NSF rate, and stable-employment percentage? A property-management company in the area should have these aggregated.
- How much new for-sale + rental construction is in the pipeline within 1–3 miles? Heavy new supply typically softens prices + rents 12–24 months out; constrained supply supports both.
Investment metrics
- 1% rule
- 1.02% ✓
- Cap rate
- 7.87%
- Cash-on-cash
- 5.64%
- DSCR
- 1.25
- GRM
- 8.2
CMA / ARV
- ARV (on-the-fly)
- $455,070
- Comps found
- 12
Show comp detail 12 sales within ~0.75 mi
| Address | Dist | Beds/Ba | Sqft | Sold | Price | $/sf | Match |
|---|---|---|---|---|---|---|---|
| 4751 NE 2nd Ave | 0.36mi | 2/2.0 | 1,235 (+7%) | 0mo | $490,000 | $397 | 67 |
| 111 NE 47th St | 0.37mi | 2/2.0 | 1,076 (-7%) | 3mo | $310,000 | $288 | 65 |
| 4801 NE 2nd | 0.32mi | 2/2.0 | 988 (-14%) | 2mo | $519,500 | $526 | 55 |
| 5456 NE 3rd Ter | 0.47mi | 3/2.0 (+1) | 1,250 (+8%) | 2mo | $492,000 | $394 | 54 |
| 5408 NE 3rd Ter | 0.43mi | 3/2.0 (+1) | 1,250 (+8%) | 8mo | $328,500 | $263 | 50 |
| 4581 NE 5th Ave | 0.64mi | 2/1.0 | 1,044 (-10%) | 9mo | $390,000 | $374 | 47 |
| 5911 NE 1st Ave | 0.68mi | 3/1.0 (+1) | 1,169 (+1%) | 18mo | $360,000 | $308 | 46 |
| 631 NE 56th Ct | 0.73mi | 3/2.0 (+1) | 1,208 (+5%) | 3mo | $365,000 | $302 | 46 |
| 4861 NE 8th Ave | 0.64mi | 3/2.0 (+1) | 1,116 (-3%) | 11mo | $567,000 | $508 | 46 |
| 5441 NE 2nd Ave | 0.33mi | 2/1.0 | 1,008 (-13%) | 23mo | $380,000 | $377 | 44 |
| 111 NE 46th St | 0.47mi | 3/3.0 (+1) | 1,308 (+13%) | 3mo | $525,000 | $401 | 40 |
| 5464 NE 3rd Ter | 0.47mi | 3/1.5 (+1) | 1,298 (+12%) | 20mo | $520,000 | $401 | 34 |
Match score weights: distance 35% · size 25% · config 20% · recency 20%. Top-matched comps best support the ARV.
Projected returns pro-forma
-3.0% appreciation · 0.0% rent growth · sell at horizon
- IRR
- -10.9%
- Equity multiple
- 0.61×
- Total profit
- $-34,016
- Equity at exit
- $46,968
- IRR
- -6.5%
- Equity multiple
- 0.64×
- Total profit
- $-31,851
- Equity at exit
- $27,235
Cash invested: $88,200 (down + closing). Projections, not guarantees.
Landlord ↔ Tenant lean methodology
- Overall (STATE)
- 87 Strongly Landlord-Friendly
- State Florida
- 87 Strongly Landlord-Friendly · R+3
- County
- — inherits STATE
- City
- — inherits STATE
ZIP-level market 33309
- Home prices YoY
- -26.6%
- Rents YoY
- -0.5%
- Active inventory
- 343
- Price-to-rent
- 8.2×
Monthly cashflow live
- Estimated rent
- $3,203 high interval (Pro) →
- Mortgage (P&I)
- −$1,652
- Tax from tax record
- −$332 /mo · $3,988/yr
- Insurance
- −$131
- HOA
- −$0
- Vacancy / Maint / Mgmt
- −$673
- Net cashflow
- $415
Break-even live
UW: 25.0% down · 7.5% · 30yr · 1.5% tax · 5.0% vac · 8.0% maint · 8.0% mgmt
Financing live
Cash to close
- Down payment
- $78,750
- Closing costs
- $9,450
- Reserves months
- —
- Total cash needed
- —
Loan-product check · same deal, 3 products live
Conventional
25% down · 7.5% · 30yr
- Down + closing
- —
- Monthly P&I
- —
- Monthly cashflow
- —
- DSCR
- —
- Eligible?
- —
Personal DTI + credit; lowest rate.
DSCR
20% down · 8.5% · 30yr
- Down + closing
- —
- Monthly P&I
- —
- Monthly cashflow
- —
- DSCR
- —
- Eligible?
- —
No personal income docs; deal must DSCR.
Hard money
10% down · 12.0% · 12mo
- Down + closing
- —
- Monthly P&I
- —
- Monthly cashflow
- —
- DSCR
- —
- Eligible?
- —
Short-term bridge; refi at stabilization.
Rent comps 36 comps
| Address | Beds | Baths | Sqft | Rent | $/sqft | DOM | Units | Dist |
|---|---|---|---|---|---|---|---|---|
| 320 NW 51st Ct Fort Lauderdale, FL | 3.0 | 2.0 | 1396 | $3,500 | $2.51 | 24d | 1 | 0.16mi |
| 240 NW 48th Ct Fort Lauderdale, FL | 3.0 | 2.0 | 1240 | $3,100 | $2.50 | 3d | 1 | 0.23mi |
| 5365 N Andrews Ave Fort Lauderdale, FL | 3.0 | 2.0 | 1016 | $3,500 | $3.44 | 24d | 1 | 0.26mi |
| 4650 NE 2nd Ave Fort Lauderdale, FL | 3.0 | 2.0 | 1356 | $3,950 | $2.91 | 24d | 1 | 0.43mi |
| 5157 NE 5th Ave Unit 1 Fort Lauderdale, FL | 3.0 | 2.0 | 1250 | $3,500 | $2.80 | 3d | 1 | 0.43mi |
| 5409 NE 4th Ave Fort Lauderdale, FL | 3.0 | 2.0 | 1178 | $3,200 | $2.72 | 24d | 1 | 0.44mi |
| 4580 NE 3rd Ave Fort Lauderdale, FL | 3.0 | 2.0 | 1192 | $3,300 | $2.77 | 20d | 1 | 0.53mi |
| 4680 NE 5th Ave Fort Lauderdale, FL | 3.0 | 2.0 | 1300 | $3,800 | $2.92 | 7d | 1 | 0.55mi |
| 4601 NE 4th Ave Unit 1261561P Fort Lauderdale, FL | 3.0 | 2.0 | 1097 | $4,430 | $4.04 | 24d | 1 | 0.56mi |
| 261 NE 45th St Fort Lauderdale, FL | 3.0 | 2.0 | 997 | $3,247 | $3.26 | 24d | 1 | 0.59mi |
| 5655 NE 5th Ter Fort Lauderdale, FL | 3.0 | 2.0 | 1178 | $3,250 | $2.76 | 24d | 1 | 0.69mi |
| 5655 NE 5th Ter Fort Lauderdale, FL | 3.0 | 2.0 | 1178 | $3,250 | $2.76 | 16d | 1 | 0.69mi |
| 5841 NE 3rd Ave Fort Lauderdale, FL | 3.0 | 2.0 | 834 | $3,200 | $3.84 | 24d | 1 | 0.71mi |
| 4780 NE 8th Ter Oakland Park, FL | 3.0 | 2.0 | 1130 | $4,200 | $3.72 | 24d | 1 | 0.73mi |
| 540 NE 59th Ct Fort Lauderdale, FL | 3.0 | 2.0 | 964 | $3,400 | $3.53 | 24d | 1 | 0.87mi |
| 351 NE 41st St Oakland Park, FL | 2.0 | 1.0 | 900 | $3,400 | $3.78 | 24d | 1 | 0.90mi |
| 540 NE 61st Ct Fort Lauderdale, FL | 3.0 | 2.0 | 1272 | $3,395 | $2.67 | 3d | 1 | 1.02mi |
| 4564 NW 16th Ave Fort Lauderdale, FL | 2.0 | 2.0 | 1010 | $2,300 | $2.28 | 24d | 1 | 1.10mi |
| 331 NW 38th St Oakland Park, FL | 2.0 | 1.5 | 1040 | $3,900 | $3.75 | 7d | 1 | 1.11mi |
| 331 NW 38th St Oakland Park, FL | 2.0 | 1.5 | 1040 | $3,900 | $3.75 | 17d | 1 | 1.11mi |
| 4511 NE 13th Ave Oakland Park, FL | 2.0 | 2.0 | 1400 | $3,200 | $2.29 | 7d | 1 | 1.12mi |
| 4511 NE 13th Ave Oakland Park, FL | 3.0 | 3.0 | 1416 | $4,300 | $3.04 | 24d | 1 | 1.12mi |
| 4511 NE 13th Ave Oakland Park, FL | 3.0 | 3.0 | 1416 | $4,300 | $3.04 | 4d | 1 | 1.12mi |
| 6500 N Andrews Ave Fort Lauderdale, FL | 2.0 | 1.0–2.0 | 943 | $3,146 | $3.34 | 2d | 31 | 1.16mi |
| 4360 NE 13th Ave Oakland Park, FL | 3.0 | 2.0 | 1459 | $3,700 | $2.54 | 5d | 1 | 1.23mi |
| 4360 NE 13th Ave Oakland Park, FL | 3.0 | 2.0 | 1269 | $3,700 | $2.92 | 24d | 1 | 1.23mi |
| 4360 NE 13th Ave Unit Main Oakland Park, FL | 3.0 | 2.0 | 1269 | $4,500 | $3.55 | 22d | 1 | 1.23mi |
| 1660 NW 42nd St Oakland Park, FL | 3.0 | 2.0 | 1465 | $3,650 | $2.49 | 24d | 1 | 1.29mi |
| 4460 NW 18th Ave Oakland Park, FL | 3.0 | 1.0 | 1240 | $2,500 | $2.02 | 20d | 1 | 1.33mi |
| 4460 NW 18th Ave Oakland Park, FL | 3.0 | 1.0 | 1240 | $2,400 | $1.94 | 5d | 1 | 1.33mi |
| 4764 NE 15th Way Oakland Park, FL | 3.0 | 2.0 | 1218 | $3,500 | $2.87 | 24d | 1 | 1.35mi |
| 1575 NE 47th St Oakland Park, FL | 3.0 | 2.0 | 1358 | $3,700 | $2.72 | 24d | 1 | 1.36mi |
| 1873 NW 46th St Fort Lauderdale, FL | 2.0 | 1.0 | 864 | $1,875 | $2.17 | 24d | 1 | 1.36mi |
| 1421 NE 41st St Oakland Park, FL | 2.0 | 2.0 | 1366 | $4,000 | $2.93 | 24d | 1 | 1.38mi |
| 3801 Dixie Hwy Oakland Park, FL | 2.0 | 1.0–2.0 | 944 | $3,584 | $3.80 | 14d | 45 | 1.43mi |
| 1906 NW 45th Ct Fort Lauderdale, FL | 2.0 | 1.0 | 1008 | $2,400 | $2.38 | 5d | 1 | 1.46mi |
Listing history 14 events
-
2026-04-30status Pending
-
2026-04-20$315,000 Active
-
2026-01-23status Pending
-
2026-01-20historical
-
2026-01-05price $355,000
-
2025-11-10price $390,000
-
2025-09-29price $410,000
-
2025-09-03$420,000 Active
-
2016-12-19soldstatus $180,000
-
2004-08-23soldstatus $165,000
-
2004-06-25soldstatus $165,000
-
2002-02-27soldstatus $98,000
-
1999-03-18soldstatus $50,000
-
1982-09-01soldstatus $45,000
ⓘ Source: listings_history table (triggers on properties + properties_extension) + one-shot
backfill from property_details.listing_events for pre-trigger history.
Tax reassessment forecast FL · Resets to sale price
- Current annual tax
- $3,988 · $332/mo
- Projected year-2 tax
- $3,988 · $332/mo
- Expected delta
- $0/yr ($0/mo · 0.0%)
ⓘ Screening estimate from a state-policy table — verify with the county assessor before closing.
Climate risk First Street
- Flood 1/10 Low FEMA zone X (shaded) · 0% chance over 30 yrs
- Wildfire 1/10 Low
- Heat 10/10 Extreme 7 d/yr ≥106°F today · 26 d/yr by 30 yrs out
- Wind 10/10 Extreme 99% chance of damaging wind over 30 yrs
- Air quality 2/10 Low 1 unhealthy d/yr today · 2 by 30 yrs out
Nearby sold comps map
Loading sold comps map…
Walkable amenities ~0.75 mi
Loading nearby amenities…
Taxation est. · year 1
- Rental income
- $38,430
- − Mortgage interest
- −$17,645
- − Property taxes
- −$3,988
- − Insurance
- −$1,575
- − Repairs & maintenance
- −$3,074
- − Management
- −$3,074
- − Depreciation
- −$9,164
- Taxable loss
- −$90
- Est. tax savings @ 24.0%
- +$22
- After-tax cash flow
- $4,996/yr
For passive investors: Depreciation is non-cash, so a rental often shows a tax loss while cash-flowing — sheltering income. Rental losses are passive: they offset passive income freely, and up to $25,000/yr can offset ordinary (W-2) income if you actively participate and your MAGI is under $100k (phasing out to $0 by $150k); unused losses carry forward. On sale, claimed depreciation is recaptured at up to 25%, and gains may owe capital-gains tax (a 1031 exchange can defer both). Figures are a year-1 estimate at your 24.0% rate — not tax advice; consult a CPA.
Schools (NCES district)
- District
- Broward
- NCES district ID
- 1200180
- Math proficiency
- 42% ▼ -18.00%
- Reading proficiency
- 53% ▼ -5.00%
- Median HH income
- $52,139
- Composite
- 40.88/100
- National rank
- #3621
- State rank
- #46 of 73 in FL
Livability — Oakland Park
- Score
- 77/100
- State rank
- #193
- US rank
- #3082
Category grades
Schools grade is shown separately in the Schools card above.
Census & demographics
- Census place
- Oakland Park, FL
- County
- Broward County · 1,963,430 people
- City population
- 68,410
- Metro
- Miami-Fort Lauderdale-Pompano Beach, FL
- Population (ZIP)
- 37,475
- Household income
- $77,321
- Rent vs Own
- Severe rent burden
- 1596.0
Population outlook (Broward County) Hauer SSP2
- Today (2025)
- 2,207,033 people
- By 2030
- 2,360,704 · +7.0%
- By 2040
- 2,661,208 · +20.6%
- By 2050
- 2,946,698 · +33.5%
- By 2075
- 3,602,273 · +63.2%
- By 2100
- 3,970,984 · +79.9%
Race, ethnicity, and origin ACS 2023
- Neighborhood character
- Diverse neighborhood (Simpson 0.68)
- Race & ethnicity
- Black 43% Hispanic / Latino 28% White 22% Two or more races 20% Asian 2%
- Hispanic origin (detail)
- Mexican 4% Puerto Rican 4% Cuban 3% Dominican 1%
- Common ancestry
- Hispanic 15% Lithuanian 1% Romanian 1%
- Foreign-born
- 38% · Canada, Jamaica, Dominican Republic
- Languages at home
- 55% English-only · Spanish 25% French/Haitian/Cajun 17% Other Indo-European 2%
Political lean MEDSL · Broward
- 2024 margin
- D (+17.0) · D 58.0% · R 41.0%
- 2008→2024 swing
- -17.8pp toward R · 2008: 34.7pp · 2024: 17.0pp
- All cycles
- 2024: D+17.0 2020: D+29.8 2016: D+35.0 2012: D+34.9 2008: D+34.7
Not yet ingested
- Civics
- —
Market trends
- HPI YoY
- ▼ -158.71%
- Current HPI
- 439.091
- Rent YoY
- ▼ -0.50%
- Metro
- Miami-Fort Lauderdale-Pompano Beach, FL
- State GDP YoY
- ▲ 3.28%
- F500 in state
- 36
Industry mix (Fortune 500 HQ in FL)
| Industry | F500 HQs | Revenue |
|---|---|---|
| Industrial Technology | 2 | $29B |
|
||
| Insurance | 2 | $17B |
|
||
| Retail | 1 | $60B |
|
||
| Technology Distribution | 1 | $58B |
|
||
| Homebuilding | 1 | $35B |
|
||
| Technology Manufacturing | 1 | $35B |
|
||
Price history
+600.0% since first listed14 events — show timeline
- 2026-04-30 Pending — Beaches MLS
- 2026-04-20 Listed $315,000 Beaches MLS
- 2026-01-23 Pending — Stellar MLS as Distributed by MLS Grid
- 2026-01-20 Listing Removed — Stellar MLS as Distributed by MLS Grid
- 2026-01-05 Price Changed $355,000 Stellar MLS as Distributed by MLS Grid
- 2025-11-10 Price Changed $390,000 Stellar MLS as Distributed by MLS Grid
- 2025-09-29 Price Changed $410,000 Stellar MLS as Distributed by MLS Grid
- 2025-09-03 Listed $420,000 Stellar MLS as Distributed by MLS Grid
- 2016-12-19 Sold (Public Records) $180,000 Public Records
- 2004-08-23 Sold (Public Records) $165,000 Public Records
- 2004-06-25 Sold (Public Records) $165,000 Public Records
- 2002-02-27 Sold (Public Records) $98,000 Public Records
- 1999-03-18 Sold (Public Records) $50,000 Public Records
- 1982-09-01 Sold (Public Records) $45,000 Public Records
Property tax history
+5.0%/yrLatest (2025): $3,988 · +2.5% YoY. Source: county tax records.
Cash-flow waterfall
monthlySold comps — $/sqft
last 12 mo · ≤1 miLoading sold comps…