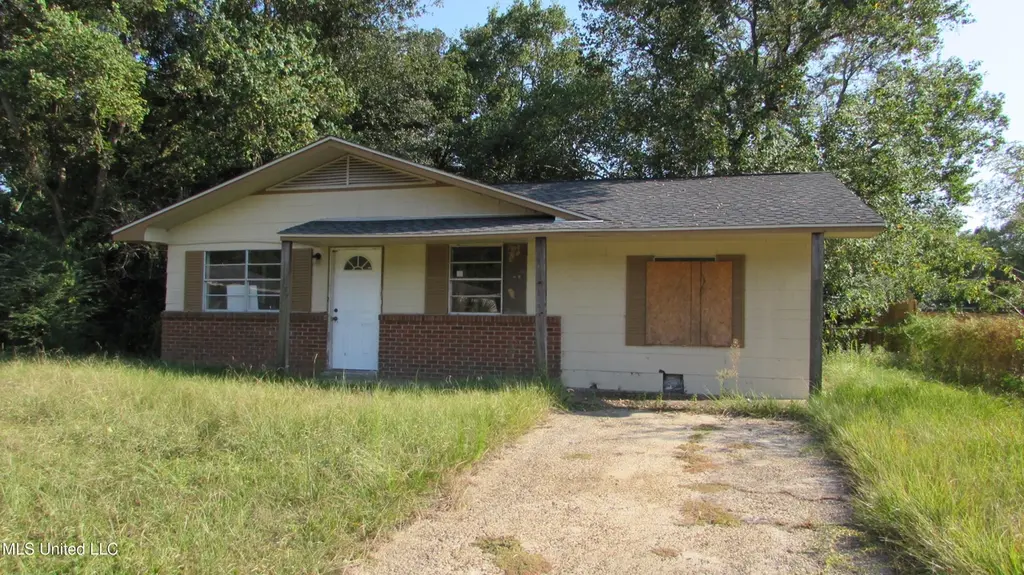
120 Carson Dr · Gulfport, MS
Flood risk 1/10 · Minimal
- FEMA flood zone
- X (unshaded)
- Chance of flooding over 30 yrs
- 0.0%
- Est. flood insurance / yr
- $507 – $1,088
Fire risk 2/10 · Minimal
- Est. fire insurance / yr
- $1,241 – $2,305
Heat risk 10/10 · Severe
- Hot days now (above 107°F)
- 7 days/yr
- Hot days in 30 yrs
- 23 days/yr
Wind risk 9/10 · Severe
- Chance of severe wind over 30 yrs
- 99.0%
Air-quality risk 1/10 · Minimal
- Unhealthy air days now
- 0 days/yr
- Unhealthy air days in 30 yrs
- 0 days/yr
Risk factors via First Street. Map © Google.
Why this score? — see what drove the B+ grade
The composite is a weighted blend of 9 inputs, each scored 0–100. Each bar is that input's sub-score; the figure is the points it added to the 100-point composite (weight × sub-score).
- Cash flow +30.0/30.0
- ARV discount +15.0/15.0
- 1% rule +10.0/10.0
- DSCR +10.0/10.0
- Rent growth +4.2/5.0
- Schools +4.2/10.0
- Livability +3.7/5.0
- Condition / age +2.5/5.0
- Appreciation +0.0/10.0
$76,500
🖨 Deal sheet (PDF) 📄 Offer letter ✓ Due diligence
Listing remarks MLS
Solid 3 bedroom 1 bath home in need of repairs. Sold as-is Located in a cul-de-sac. and no flood zone. Newer roof, enclosed garage. Part of a 28 home pkg.
Key facts
- Enclosed garage
- Newer roof
- Cul-de-sac
Tags
Neighborhood map
What this means for you Summary
Snapshot
- This is a 3-bed/1.0-bath single-family listed at $76k.
Deal economics
- At list price, monthly cash flow is $670 ($8k/yr) — positive.
- The deal already cash-flows at list — no discount required.
- Meets the 1% rule at list price ($1k rent vs $76k).
- Recommended offer: $67k (12.0% below list) — sets the bar for market timing.
- Cap rate 16.8% vs local median 4.9% in Gulfport — top-decile yield for the area; either an underpriced asset or a hidden risk that comps aren't pricing in. Stress-test before assuming the spread holds.
Location & tenants
- Location reads 73/100 on livability (#15 in MS) — a middle-class / working-renter tenant base. Strengths: cost of living A+, housing A+, health & safety A+; Watch: schools D, amenities F, commute F.
- Harrison County School District (rural): math 52% / reading 46% proficiency, ranked #14 of 130 in MS (top 11%) — families likely to look elsewhere, expect single-tenant / working-renter base with shorter leases; 62% free/reduced lunch — lower-income household profile, screen leases tightly.
- Market conditions: Rents rising fast (+7.0%/yr); 769 active listings in the ZIP; 26 comparable units currently listed for rent nearby; rentals lingering (median 45d on market — plan ~5-8 weeks vacancy on turnover, expect pricing pressure); 62% of comp listings sitting > 30 days — soft ceiling on asking rent; 2,194 units permitted in Harrison County in 2024 (0 in 5+ unit buildings).
Forward outlook
- Local home prices are declining (-3.0%/yr); year-one equity from $529 of loan paydown is wiped out by about $2k of value loss. Plan a longer hold.
- Harrison County population projected at +27% by 2050 — long-run rental-demand tailwind backs the buy-and-hold thesis.
- At projected returns (-3.0% appreciation + 7.0% rent growth), your $21k cash investment doubles in ~3 years — after that, you're playing with house money.
Negotiation context
- It's been on market 271 days — a 12% lower offer ($67k) is reasonable based on typical stale-listing flexibility.
- 5 sale attempts since 21y ago; this cycle's ask has dropped $18k (19%) from the opening price — seller is motivated, your offer sets the floor, not the list.
Risks & watch-outs
- Climate carrying-cost: severe wind risk, 99% chance of damaging wind over 30y; extreme-heat days projected 7→23/yr by 2055 (HVAC capex compounding) — expect insurance premiums to compound above CPI over the hold.
Questions for the listing agent
- It's been on market 271 days. Have you received any prior offers? Is the seller open to a 12% concession, seller financing, or rate buy-down credit?
- Built in 1970 — when were the roof, HVAC, electrical panel, plumbing, and water heater last replaced?
- Why hasn't it sold? Are there any deal-killer items the seller is aware of (foundation, flood, title, zoning, code violations)?
- Is there a deadline driving the sale (1031 exchange, divorce, estate, relocation)? That informs how much negotiation room exists.
- Schools are D-rated, which usually means shorter tenancies and higher turnover. Who's the typical renter profile here, and what's been the actual vacancy rate?
- What's the average days-on-market for RENTAL listings here right now (not sales)? A rising rental-DOM trend means longer vacancies and softer asking-rent achievability than the comps imply.
- What's the recent tenant-quality profile in this submarket — average credit score on applications, eviction rate, late-payment / NSF rate, and stable-employment percentage? A property-management company in the area should have these aggregated.
- How much new for-sale + rental construction is in the pipeline within 1–3 miles? Heavy new supply typically softens prices + rents 12–24 months out; constrained supply supports both.
Investment metrics
- 1% rule
- 1.92% ✓
- Cap rate
- 16.80%
- Cash-on-cash
- 37.52%
- DSCR
- 2.67
- GRM
- 4.3
CMA / ARV
- ARV (median comp)
- $121,621
- List price
- $76,500
- Delta
- -37.10%
- Verdict
- UNDERPRICED
- Comps
- 20 within 1.0 mi
Show comp detail 12 sales within ~0.75 mi
| Address | Dist | Beds/Ba | Sqft | Sold | Price | $/sf | Match |
|---|---|---|---|---|---|---|---|
| 201 Tandy Dr | 0.12mi | 3/1.5 | 1,026 (0%) | 9mo | $89,900 | $88 | 85 |
| 305 Lavelle Dr | 0.17mi | 3/2.0 | 1,050 (+2%) | 3mo | $140,000 | $133 | 82 |
| 801 Shirley Dr | 0.19mi | 3/1.5 | 986 (-4%) | 5mo | $80,750 | $82 | 79 |
| 710 Beverly Dr | 0.27mi | 3/2.0 | 1,014 (-1%) | 3mo | $140,000 | $138 | 79 |
| 13517 Artes St | 0.32mi | 2/1.0 (-1) | 1,000 (-2%) | 0mo | $139,900 | $140 | 76 |
| 201 Mary Dr | 0.24mi | 3/1.5 | 1,053 (+3%) | 10mo | $170,000 | $161 | 74 |
| 12104 Three Rivers Rd | 0.32mi | 2/1.0 (-1) | 1,064 (+4%) | 2mo | $39,000 | $37 | 72 |
| 12011 Three Rivers Rd | 0.25mi | 2/1.0 (-1) | 960 (-6%) | 2mo | $125,000 | $130 | 70 |
| 12011 Three Rivers Rd Unit A | 0.25mi | 2/1.0 (-1) | 960 (-6%) | 7mo | $119,900 | $125 | 67 |
| 12095 Highland Ave | 0.39mi | 3/1.0 | 912 (-11%) | 4mo | $79,850 | $88 | 59 |
| 119 Gahan Dr | 0.71mi | 3/1.5 | 1,100 (+7%) | 3mo | $145,000 | $132 | 50 |
| 12297 Windward Dr | 0.69mi | 2/2.0 (-1) | 1,096 (+7%) | 8mo | $159,900 | $146 | 41 |
Match score weights: distance 35% · size 25% · config 20% · recency 20%. Top-matched comps best support the ARV.
Projected returns pro-forma
-3.0% appreciation · 6.99% rent growth · sell at horizon
- IRR
- 37.8%
- Equity multiple
- 2.70×
- Total profit
- $36,397
- Equity at exit
- $11,406
- IRR
- 46.3%
- Equity multiple
- 6.32×
- Total profit
- $113,974
- Equity at exit
- $6,614
Cash invested: $21,420 (down + closing). Projections, not guarantees.
Landlord ↔ Tenant lean methodology
- Overall (STATE)
- 90 Strongly Landlord-Friendly
- State Mississippi
- 90 Strongly Landlord-Friendly · R+11
- County
- — inherits STATE
- City
- — inherits STATE
ZIP-level market 39503
- Home prices YoY
- -21.5%
- Rents YoY
- 7.0%
- Active inventory
- 769
- Price-to-rent
- 4.3×
Monthly cashflow live
- Estimated rent
- $1,471 high interval (Pro) →
- Mortgage (P&I)
- −$401
- Tax from tax record
- −$59 /mo · $708/yr
- Insurance
- −$32
- HOA
- −$0
- Vacancy / Maint / Mgmt
- −$309
- Net cashflow
- $670
Break-even live
Sensitivity live
| Price | -10% $713 | -5% $691 | +0% $670 | +5% $648 | +10% $626 |
|---|---|---|---|---|---|
| Rent | -10% $554 | -5% $612 | +0% $670 | +5% $728 | +10% $786 |
| Rate | -1.0pp $708 | -0.5pp $689 | base $670 | +0.5pp $650 | +1.0pp $630 |
UW: 25.0% down · 7.5% · 30yr · 1.5% tax · 5.0% vac · 8.0% maint · 8.0% mgmt
Financing live
Cash to close
- Down payment
- $19,125
- Closing costs
- $2,295
- Reserves months
- —
- Total cash needed
- —
Loan-product check · same deal, 3 products live
Conventional
25% down · 7.5% · 30yr
- Down + closing
- —
- Monthly P&I
- —
- Monthly cashflow
- —
- DSCR
- —
- Eligible?
- —
Personal DTI + credit; lowest rate.
DSCR
20% down · 8.5% · 30yr
- Down + closing
- —
- Monthly P&I
- —
- Monthly cashflow
- —
- DSCR
- —
- Eligible?
- —
No personal income docs; deal must DSCR.
Hard money
10% down · 12.0% · 12mo
- Down + closing
- —
- Monthly P&I
- —
- Monthly cashflow
- —
- DSCR
- —
- Eligible?
- —
Short-term bridge; refi at stabilization.
Rent comps 26 comps
| Address | Beds | Baths | Sqft | Rent | $/sqft | DOM | Units | Dist |
|---|---|---|---|---|---|---|---|---|
| 1009 Michelle Dr Gulfport, MS | 4.0 | 2.0 | 1254 | $1,650 | $1.32 | 44d | 1 | 0.34mi |
| 12040 Highland Ave Gulfport, MS | 3.0 | 2.0 | 1019 | $950 | $0.93 | 14d | 1 | 0.40mi |
| 125 Clarence Dr Gulfport, MS | 3.0 | 2.0 | 1300 | $1,500 | $1.15 | 14d | 1 | 0.49mi |
| 12147 Prudie Cir Gulfport, MS | 3.0 | 2.0 | 1100 | $975 | $0.89 | 44d | 1 | 0.50mi |
| 11200 Three Rivers Rd Gulfport, MS | 3.0 | 2.0 | 1124 | $1,445 | $1.29 | 14d | 1 | 0.79mi |
| 11200 Three Rivers Rd Gulfport, MS | 2.0 | 2.0 | 1042 | $1,147 | $1.10 | 44d | 1 | 0.79mi |
| 12450 Three Rivers Rd Gulfport, MS | 3.0 | 2.0 | 1098 | $1,295 | $1.18 | 44d | 1 | 0.86mi |
| 101 Fore St Gulfport, MS | 3.0 | 2.0 | 1215 | $1,700 | $1.40 | 14d | 1 | 0.90mi |
| 14180 Oneal Rd Gulfport, MS | 2.0 | 1.0 | 1000 | $1,100 | $1.10 | 44d | 2 | 0.97mi |
| 11502 Camden Court Cir Gulfport, MS | 3.0 | 2.0 | 1495 | $1,775 | $1.19 | 22d | 1 | 1.17mi |
| 11487 Camden Court Cir Gulfport, MS | 3.0 | 2.0 | 1495 | $1,775 | $1.19 | 44d | 1 | 1.24mi |
| 11405 Camden Court Cir Gulfport, MS | 3.0 | 2.0 | 1495 | $1,775 | $1.19 | 44d | 1 | 1.24mi |
| 11425 Camden Court Cir Gulfport, MS | 3.0 | 2.0 | 1495 | $1,775 | $1.19 | 22d | 1 | 1.24mi |
| 11413 Camden Court Cir Gulfport, MS | 3.0 | 2.0 | 1495 | $1,775 | $1.19 | 44d | 1 | 1.24mi |
| 13242 Warren Dr Gulfport, MS | 2.0 | 2.0 | 1012 | $1,100 | $1.09 | 44d | 1 | 1.25mi |
| 13070 Tracewood Dr Gulfport, MS | 3.0 | 2.0 | 1190 | $1,400 | $1.18 | 22d | 1 | 1.26mi |
| 11213 Dobson Rd Gulfport, MS | 2.0 | 1.0 | 900 | $1,200 | $1.33 | 44d | 1 | 1.30mi |
| 10479 Cal Ln Gulfport, MS | 2.0 | 1.5 | 1200 | $950 | $0.79 | 22d | 1 | 1.32mi |
| 14437 Whitney Dr Gulfport, MS | 2.0 | 1.5 | 1200 | $1,200 | $1.00 | 44d | 1 | 1.32mi |
| 10669 E Bay Tree Dr Gulfport, MS | 3.0 | 2.0 | 1200 | $1,425 | $1.19 | 22d | 1 | 1.34mi |
| 13181 Warren Dr Gulfport, MS | 3.0 | 2.0 | 1188 | $1,375 | $1.16 | 44d | 1 | 1.34mi |
| 15251 Parkwood Dr N Gulfport, MS | 3.0 | 2.5 | 1200 | $1,200 | $1.00 | 44d | 1 | 1.37mi |
| 10471 Three Rivers Rd Gulfport, MS | 1.0–2.0 | 1.0–2.0 | 778 | $1,050 | $1.35 | 44d | 1 | 1.38mi |
| 15235 Oneal Rd Gulfport, MS | 2.0 | 2.0 | 1101 | $1,200 | $1.09 | 14d | 1 | 1.39mi |
| 10596 E Bay Tree Dr Gulfport, MS | 2.0 | 2.0 | 1047 | $1,200 | $1.15 | 44d | 1 | 1.40mi |
| 15373 Saint Charles St Gulfport, MS | 3.0 | 1.0–3.0 | 1075 | $1,350 | $1.26 | 44d | 2 | 1.45mi |
Listing history 28 events
-
2026-06-21days on market $76,500 Active 271 DOM
-
2026-06-18days on market $76,500 Active 268 DOM
-
2026-06-17days on market $76,500 Active 267 DOM
-
2026-06-16days on market $76,500 Active 266 DOM
-
2026-06-15days on market $76,500 Active 265 DOM
-
2026-06-14days on market $76,500 Active 263 DOM
-
2026-06-13days on market $76,500 Active 262 DOM
-
2026-06-10days on market $76,500 Active 260 DOM
-
2026-06-09days on market $76,500 Active 259 DOM
-
2026-06-08days on market $76,500 Active 258 DOM
-
2026-06-07days on market $76,500 Active 257 DOM
-
2026-06-02days on market $76,500 Active 252 DOM
-
2026-06-01days on market $76,500 Active 251 DOM
-
2026-05-31days on market $76,500 Active 250 DOM
-
2026-05-30days on market $76,500 Active 249 DOM
-
2026-05-01price $76,500 156-char remark
Show marketing remark (156 chars)
Solid 3 bedroom 1 bath home in need of repairs. Sold as-is Located in a cul-de-sac. and no flood zone. Newer roof, enclosed garage. Part of a 28 home pkg.
-
2025-11-10price $85,000 156-char remark
Show marketing remark (156 chars)
Solid 3 bedroom 1 bath home in need of repairs. Sold as-is Located in a cul-de-sac. and no flood zone. Newer roof, enclosed garage. Part of a 28 home pkg.
-
2025-09-22$95,000 Active 156-char remark
Show marketing remark (156 chars)
Solid 3 bedroom 1 bath home in need of repairs. Sold as-is Located in a cul-de-sac. and no flood zone. Newer roof, enclosed garage. Part of a 28 home pkg.
-
2023-11-15historical
-
2023-01-11status Active
-
2023-01-01historical
-
2022-09-19price $85,000
-
2022-08-19$90,000 Active
-
2015-10-14soldstatus
-
2015-09-28soldstatus
-
2015-07-17$38,000
-
2006-01-30soldstatus
-
2005-12-30$69,900
ⓘ Source: listings_history table (triggers on properties + properties_extension) + one-shot
backfill from property_details.listing_events for pre-trigger history.
Tax reassessment forecast MS · Resets to sale price
- Current annual tax
- $708 · $59/mo
- Projected year-2 tax
- $708 · $59/mo
- Expected delta
- $0/yr ($0/mo · 0.0%)
ⓘ Screening estimate from a state-policy table — verify with the county assessor before closing.
Climate risk First Street
- Flood 1/10 Low FEMA zone X (unshaded) · 0% chance over 30 yrs
- Wildfire 2/10 Low
- Heat 10/10 Extreme 7 d/yr ≥107°F today · 23 d/yr by 30 yrs out
- Wind 9/10 Extreme 99% chance of damaging wind over 30 yrs
- Air quality 1/10 Low 0 unhealthy d/yr today · 0 by 30 yrs out
Nearby sold comps map
Loading sold comps map…
Walkable amenities ~0.75 mi
Loading nearby amenities…
Taxation est. · year 1
- Rental income
- $17,647
- − Mortgage interest
- −$4,285
- − Property taxes
- −$708
- − Insurance
- −$382
- − Repairs & maintenance
- −$1,412
- − Management
- −$1,412
- − Depreciation
- −$2,225
- Taxable income
- $7,222
- Est. tax owed @ 24.0%
- −$1,733
- After-tax cash flow
- $6,303/yr
For passive investors: Depreciation is non-cash, so a rental often shows a tax loss while cash-flowing — sheltering income. Rental losses are passive: they offset passive income freely, and up to $25,000/yr can offset ordinary (W-2) income if you actively participate and your MAGI is under $100k (phasing out to $0 by $150k); unused losses carry forward. On sale, claimed depreciation is recaptured at up to 25%, and gains may owe capital-gains tax (a 1031 exchange can defer both). Figures are a year-1 estimate at your 24.0% rate — not tax advice; consult a CPA.
Schools (NCES district)
- District
- Harrison County School District
- NCES district ID
- 2801770
- Math proficiency
- 52% ▼ -4.00%
- Reading proficiency
- 46% ▼ -4.00%
- Median HH income
- $46,504
- Composite
- 41.66/100
- National rank
- #3419
- State rank
- #14 of 130 in MS
Livability — Gulfport
- Score
- 73/100
- State rank
- #15
- US rank
- #5010
Category grades
Schools grade is shown separately in the Schools card above.
Census & demographics
- Census place
- Gulfport, MS
- County
- Harrison County · 178,171 people
- City population
- 96,188
- Metro
- Gulfport-Biloxi, MS
- Population (ZIP)
- 55,059
- Household income
- $62,641
- Rent vs Own
- Severe rent burden
- 1686.0
Population outlook (Harrison County) Hauer SSP2
- Today (2025)
- 228,444 people
- By 2030
- 241,942 · +5.9%
- By 2040
- 267,531 · +17.1%
- By 2050
- 291,062 · +27.4%
- By 2075
- 346,711 · +51.8%
- By 2100
- 378,165 · +65.5%
Race, ethnicity, and origin ACS 2023
- Neighborhood character
- Diverse neighborhood (Simpson 0.58)
- Race & ethnicity
- White 58% Black 27% Two or more races 9% Hispanic / Latino 6% Asian 2%
- Hispanic origin (detail)
- Mexican 2% Puerto Rican 1%
- Common ancestry
- Lithuanian 5% Slovak 1% Portuguese 1%
- Foreign-born
- 3% · Canada
- Languages at home
- 95% English-only · Spanish 3%
Political lean MEDSL · Harrison
- 2024 margin
- Strong R (+28.9) · D 35.0% · R 63.9% · Other 1.1%
- 2008→2024 swing
- -2.9pp toward R · 2008: -26.0pp · 2024: -28.9pp
- All cycles
- 2024: R+28.9 2020: R+25.2 2016: R+30.7 2012: R+26.6 2008: R+26.0
Not yet ingested
- Civics
- —
Market trends
- HPI YoY
- ▼ -51.39%
- Current HPI
- 187.285
- Rent YoY
- ▲ 6.99%
- Metro
- Gulfport-Biloxi, MS
- State GDP YoY
- —
- F500 in state
- 0
Price history
+9.4% since first listed13 events — show timeline
- 2026-05-01 Price Changed $76,500 MLSU
- 2025-11-10 Price Changed $85,000 MLSU
- 2025-09-22 Listed $95,000 MLSU
- 2023-11-15 Listing Removed — MLSU
- 2023-01-11 Relisted — MLSU
- 2023-01-01 Listing Removed — MLSU
- 2022-09-19 Price Changed $85,000 MLSU
- 2022-08-19 Listed $90,000 MLSU
- 2015-10-14 Sold (Public Records) — Public Records
- 2015-09-28 Sold (MLS) — MLSU
- 2015-07-17 Listed $38,000 MLSU
- 2006-01-30 Sold (MLS) — MLSU
- 2005-12-30 Listed $69,900 MLSU
Property tax history
+3.4%/yrLatest (2025): $708 · +3.9% YoY. Source: county tax records.
Cash-flow waterfall
monthlySold comps — $/sqft
last 12 mo · ≤1 miLoading sold comps…