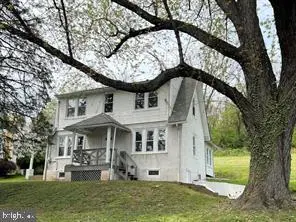
360 Dehaven St · West Conshohocken, PA
Flood risk 1/10 · Minimal
- FEMA flood zone
- X (unshaded)
- Chance of flooding over 30 yrs
- 0.0%
- Est. flood insurance / yr
- $473 – $860
Fire risk 1/10 · Minimal
- Est. fire insurance / yr
- $511 – $949
Heat risk 6/10 · Moderate
- Hot days now (above 101°F)
- 7 days/yr
- Hot days in 30 yrs
- 15 days/yr
Wind risk 6/10 · Moderate
- Chance of severe wind over 30 yrs
- 27.0%
Air-quality risk 4/10 · Minor
- Unhealthy air days now
- 5 days/yr
- Unhealthy air days in 30 yrs
- 8 days/yr
Risk factors via First Street. Map © Google.
Why this score? — see what drove the B- grade
The composite is a weighted blend of 9 inputs, each scored 0–100. Each bar is that input's sub-score; the figure is the points it added to the 100-point composite (weight × sub-score).
- Cash flow +22.5/30.0
- ARV discount +15.0/15.0
- DSCR +7.2/10.0
- 1% rule +5.8/10.0
- Schools +5.2/10.0
- Livability +4.0/5.0
- Rent growth +3.6/5.0
- Condition / age +2.5/5.0
- Appreciation +0.0/10.0
$320,000
🖨 Deal sheet (PDF) 📄 Offer letter ✓ Due diligence
Listing remarks MLS
This home is newly renovated with new wall-to-wall carpet and new vinyl flooring. Has new kitchen with dishwasher, electric range and refrigerator. It has kitchen entrance to rear deck.
Key facts
- 0.37 acre lot
- Built 1900
- Listed 26 days
Property features AI
Exterior
- Parking: Driveway
- Utilities: Public water; Public sewer; Electric hot water
- Home design: Detached home; Above-grade finished area recorded as 2,141 (per assessor)
- Construction: Stucco exterior; Permanent foundation; Above-grade and below-grade structures
- Exterior features: Lot dimensions approximately 114 x 150; No tidal water
Interior
- Bedrooms: Four bedrooms on the upper level
- Bathrooms: Two full bathrooms (one on main level, one on first upper level)
- Heating & cooling: Central heating; Oil-fired heat; Cooling listed as other
- Interior features: Daylight, partial basement; Living area as recorded by assessor
Neighborhood map
What this means for you Summary
Snapshot
- This is a 4-bed/2.0-bath single-family listed at $320k.
Deal economics
- At list price, monthly cash flow is $538 ($6k/yr) — positive.
- The deal already cash-flows at list — no discount required.
- Meets the 1% rule at list price ($3k rent vs $320k).
- Recommended offer: $315k (1.5% below list) — sets the bar for market timing.
- Cap rate 8.3% vs local median 2.0% in West Conshohocken — top-decile yield for the area; either an underpriced asset or a hidden risk that comps aren't pricing in. Stress-test before assuming the spread holds.
Location & tenants
- Location reads 79/100 on livability (#261 in PA, #2,261 nationally) — a middle-class / working-renter tenant base. Strengths: crime A+, employment A+, housing A+; Watch: amenities F, cost of living F.
- Upper Merion Area SD (suburban): math 49% / reading 67% proficiency, ranked #71 of 539 in PA (top 13%) — acceptable for families but not a draw, mixed tenant base, ~2y average lease.
- Zoned schools: Roberts El Sch (math 62% / reading 72%, grade B+, #202 of 1,518 statewide, top 15%, 286 students, 31% FRL); Upper Merion Ms (math 36% / reading 64%, grade C, #129 of 512 statewide, top 26%, 1,282 students, 47% FRL); Upper Merion Hs (math 75% / reading 24%, grade D+, #135 of 437 statewide, top 31%, 1,345 students, 38% FRL).
- Market conditions: Rents rising fast (+4.3%/yr); 19 active listings in the ZIP; 8 comparable units currently listed for rent nearby; rentals leasing fast (median 13d on market — plan ~1-2 weeks tenant-placement turnaround); high-income renter base; 1,936 units permitted in Montgomery County in 2024 (530 in 5+ unit buildings).
- This rent runs 34% of the median local income ($123k/yr) — at the standard rent-burdened threshold; future hikes will face affordability resistance.
Forward outlook
- Local home prices are declining (-3.0%/yr); year-one equity from $2k of loan paydown is wiped out by about $10k of value loss. Plan a longer hold.
- Montgomery County population projected at +5% by 2050 — modest demand growth; plan on rents tracking national, not racing it.
Negotiation context
- It's been on market 26 days — a 2% lower offer ($315k) is reasonable based on typical stale-listing flexibility.
- 3 sale attempts since 7y ago; this cycle's ask has dropped $205k (39%) from the opening price — seller is motivated, your offer sets the floor, not the list.
Risks & watch-outs
- Watch-outs: built in 1900 — expect roof / HVAC / electrical / plumbing capex.
- Climate carrying-cost: major wind risk, 27% chance of damaging wind over 30y; extreme-heat days projected 7→15/yr by 2055 (HVAC capex compounding) — expect insurance premiums to compound above CPI over the hold.
Questions for the listing agent
- Built in 1900 — when were the roof, HVAC, electrical panel, plumbing, and water heater last replaced?
- Is there a deadline driving the sale (1031 exchange, divorce, estate, relocation)? That informs how much negotiation room exists.
- What's the average days-on-market for RENTAL listings here right now (not sales)? A rising rental-DOM trend means longer vacancies and softer asking-rent achievability than the comps imply.
- What's the recent tenant-quality profile in this submarket — average credit score on applications, eviction rate, late-payment / NSF rate, and stable-employment percentage? A property-management company in the area should have these aggregated.
- How much new for-sale + rental construction is in the pipeline within 1–3 miles? Heavy new supply typically softens prices + rents 12–24 months out; constrained supply supports both.
Investment metrics
- 1% rule
- 1.08% ✓
- Cap rate
- 8.31%
- Cash-on-cash
- 7.20%
- DSCR
- 1.32
- GRM
- 7.7
CMA / ARV
- ARV (median comp)
- $606,054
- List price
- $320,000
- Delta
- -47.20%
- Verdict
- UNDERPRICED
- Comps
- 20 within 1.0 mi
Show comp detail 3 sales within ~0.75 mi
| Address | Dist | Beds/Ba | Sqft | Sold | Price | $/sf | Match |
|---|---|---|---|---|---|---|---|
| 215 Lincoln Ave | 0.31mi | 3/2.5 (-1) | 1,893 (-12%) | 10mo | $665,000 | $351 | 51 |
| 982 Mayberry Rd | 0.54mi | 4/2.5 | 2,295 (+7%) | 19mo | $610,000 | $266 | 45 |
| 933 Mayberry Rd | 0.65mi | 4/2.5 | 2,229 (+4%) | 22mo | $700,000 | $314 | 42 |
Match score weights: distance 35% · size 25% · config 20% · recency 20%. Top-matched comps best support the ARV.
Projected returns pro-forma
-3.0% appreciation · 4.34% rent growth · sell at horizon
- IRR
- -3.8%
- Equity multiple
- 0.86×
- Total profit
- $-12,865
- Equity at exit
- $47,713
- IRR
- 7.4%
- Equity multiple
- 1.59×
- Total profit
- $52,892
- Equity at exit
- $27,668
Cash invested: $89,600 (down + closing). Projections, not guarantees.
Landlord ↔ Tenant lean methodology
- Overall (STATE)
- 62 Landlord-Friendly
- State Pennsylvania
- 62 Landlord-Friendly · EVEN
- County
- — inherits STATE
- City
- — inherits STATE
ZIP-level market 19428
- Rents YoY
- 4.3%
- Active inventory
- 19
- Price-to-rent
- 7.7×
Monthly cashflow live
- Estimated rent
- $3,446 high interval (Pro) →
- Mortgage (P&I)
- −$1,678
- Tax from tax record
- −$373 /mo · $4,480/yr
- Insurance
- −$133
- HOA
- −$0
- Vacancy / Maint / Mgmt
- −$724
- Net cashflow
- $538
Break-even live
Sensitivity live
| Price | -10% $719 | -5% $628 | +0% $538 | +5% $447 | +10% $357 |
|---|---|---|---|---|---|
| Rent | -10% $265 | -5% $402 | +0% $538 | +5% $674 | +10% $810 |
| Rate | -1.0pp $699 | -0.5pp $619 | base $538 | +0.5pp $455 | +1.0pp $370 |
UW: 25.0% down · 7.5% · 30yr · 1.5% tax · 5.0% vac · 8.0% maint · 8.0% mgmt
Financing live
Cash to close
- Down payment
- $80,000
- Closing costs
- $9,600
- Reserves months
- —
- Total cash needed
- —
Loan-product check · same deal, 3 products live
Conventional
25% down · 7.5% · 30yr
- Down + closing
- —
- Monthly P&I
- —
- Monthly cashflow
- —
- DSCR
- —
- Eligible?
- —
Personal DTI + credit; lowest rate.
DSCR
20% down · 8.5% · 30yr
- Down + closing
- —
- Monthly P&I
- —
- Monthly cashflow
- —
- DSCR
- —
- Eligible?
- —
No personal income docs; deal must DSCR.
Hard money
10% down · 12.0% · 12mo
- Down + closing
- —
- Monthly P&I
- —
- Monthly cashflow
- —
- DSCR
- —
- Eligible?
- —
Short-term bridge; refi at stabilization.
Rent comps 8 comps
| Address | Beds | Baths | Sqft | Rent | $/sqft | DOM | Units | Dist |
|---|---|---|---|---|---|---|---|---|
| 247 E Matsonford Rd Conshohocken, PA | 3.0 | 1.0 | 2196 | $2,750 | $1.25 | 45d | 1 | 0.28mi |
| 207 Lookout Pl Wayne, PA | 3.0 | 2.5 | 1900 | $3,800 | $2.00 | 0d | 1 | 0.35mi |
| 234 Lookout Pl Wayne, PA | 3.0 | 3.5 | 2300 | $4,250 | $1.85 | 0d | 1 | 0.43mi |
| 22 Balligomingo Rd Conshohocken, PA | 3.0 | 1.5 | 1444 | $2,850 | $1.97 | 3d | 1 | 0.68mi |
| 381 Upper Gulph Rd Wayne, PA | 3.0 | 2.5 | 1974 | $4,595 | $2.33 | 45d | 1 | 1.19mi |
| 10 Woodmont Rd Conshohocken, PA | 3.0 | 1.5 | 2400 | $2,800 | $1.17 | 20d | 1 | 1.38mi |
| 681 Summit St King of Prussia, PA | 3.0 | 2.0 | 1929 | $2,200 | $1.14 | 7d | 1 | 1.46mi |
| 610 Brentwood Ct King of Prussia, PA | 3.0 | 2.5 | 1896 | $3,200 | $1.69 | 13d | 1 | 1.49mi |
Listing history 11 events
-
2026-04-30$525,000 Active 74-char remark
-
2022-06-28soldstatus $382,900 Closed 185-char remark
Show marketing remark (185 chars)
This home is newly renovated with new wall-to-wall carpet and new vinyl flooring. Has new kitchen with dishwasher, electric range and refrigerator. It has kitchen entrance to rear deck.
-
2022-06-28soldstatus $382,900
Show marketing remark (185 chars)
This home is newly renovated with new wall-to-wall carpet and new vinyl flooring. Has new kitchen with dishwasher, electric range and refrigerator. It has kitchen entrance to rear deck.
-
2022-06-01status Pending 185-char remark
Show marketing remark (185 chars)
This home is newly renovated with new wall-to-wall carpet and new vinyl flooring. Has new kitchen with dishwasher, electric range and refrigerator. It has kitchen entrance to rear deck.
-
2022-05-11$395,900 Active 185-char remark
Show marketing remark (185 chars)
This home is newly renovated with new wall-to-wall carpet and new vinyl flooring. Has new kitchen with dishwasher, electric range and refrigerator. It has kitchen entrance to rear deck.
-
2020-03-10historical
-
2019-10-11price $295,000
-
2019-10-07price $309,900
-
2019-08-19price $314,900
-
2019-06-06$324,900 Active
-
1986-12-26soldstatus $70,000
ⓘ Source: listings_history table (triggers on properties + properties_extension) + one-shot
backfill from property_details.listing_events for pre-trigger history.
Tax reassessment forecast PA · Partial reset (capped growth)
- Current annual tax
- $4,480 · $373/mo
- Projected year-2 tax
- $4,768 · $397/mo
- Expected delta
- +$288/yr (+$24/mo · 6.4%)
ⓘ Screening estimate from a state-policy table — verify with the county assessor before closing.
Climate risk First Street
- Flood 1/10 Low FEMA zone X (unshaded) · 0% chance over 30 yrs
- Wildfire 1/10 Low
- Heat 6/10 Major 7 d/yr ≥101°F today · 15 d/yr by 30 yrs out
- Wind 6/10 Major 27% chance of damaging wind over 30 yrs
- Air quality 4/10 Moderate 5 unhealthy d/yr today · 8 by 30 yrs out
Nearby sold comps map
Loading sold comps map…
Walkable amenities ~0.75 mi
Loading nearby amenities…
Taxation est. · year 1
- Rental income
- $41,354
- − Mortgage interest
- −$17,925
- − Property taxes
- −$4,480
- − Insurance
- −$1,600
- − Repairs & maintenance
- −$3,308
- − Management
- −$3,308
- − Depreciation
- −$9,309
- Taxable income
- $1,423
- Est. tax owed @ 24.0%
- −$342
- After-tax cash flow
- $6,111/yr
For passive investors: Depreciation is non-cash, so a rental often shows a tax loss while cash-flowing — sheltering income. Rental losses are passive: they offset passive income freely, and up to $25,000/yr can offset ordinary (W-2) income if you actively participate and your MAGI is under $100k (phasing out to $0 by $150k); unused losses carry forward. On sale, claimed depreciation is recaptured at up to 25%, and gains may owe capital-gains tax (a 1031 exchange can defer both). Figures are a year-1 estimate at your 24.0% rate — not tax advice; consult a CPA.
Schools (NCES district)
- District
- Upper Merion Area SD
- NCES district ID
- 4224480
- Math proficiency
- 49% ▼ -8.00%
- Reading proficiency
- 67% ▼ -2.00%
- Median HH income
- $77,301
- Composite
- 51.96/100
- National rank
- #1645
- State rank
- #71 of 539 in PA
Livability — West Conshohocken
- Score
- 79/100
- State rank
- #261
- US rank
- #2261
Category grades
Schools grade is shown separately in the Schools card above.
Census & demographics
- County
- Montgomery County · 712,331 people
- Metro
- Philadelphia-Camden-Wilmington, PA-NJ-DE-MD
- Population (ZIP)
- 20,411
- Household income
- $122,835
- Rent vs Own
- Severe rent burden
- 466.0
Population outlook (Montgomery County) Hauer SSP2
- Today (2025)
- 856,074 people
- By 2030
- 870,887 · +1.7%
- By 2040
- 891,195 · +4.1%
- By 2050
- 896,417 · +4.7%
- By 2075
- 903,212 · +5.5%
- By 2100
- 843,240 · -1.5%
Race, ethnicity, and origin ACS 2023
- Neighborhood character
- Predominantly White (81%)
- Race & ethnicity
- White 81% Two or more races 6% Asian 6% Black 4% Hispanic / Latino 3%
- Common ancestry
- Romanian 8% Scotch-Irish 3% Slovak 3%
- Foreign-born
- 7% · South Korea, Canada, China
- Languages at home
- 91% English-only · Other Indo-European 3% Spanish 1% Tagalog/Filipino 1%
Political lean MEDSL · Montgomery
- 2024 margin
- Strong D (+22.8) · D 60.9% · R 38.1% · Other 1.1%
- 2008→2024 swing
- +2.0pp toward D · 2008: 20.8pp · 2024: 22.8pp
- All cycles
- 2024: D+22.8 2020: D+26.3 2016: D+21.1 2012: D+14.3 2008: D+20.8
Not yet ingested
- Civics
- —
Market trends
- HPI YoY
- ▼ -467.64%
- Current HPI
- 328.4381
- Rent YoY
- ▲ 4.34%
- Metro
- Philadelphia-Camden-Wilmington, PA-NJ-DE-MD
- State GDP YoY
- ▲ 1.68%
- F500 in state
- 34
Industry mix (Fortune 500 HQ in PA)
| Industry | F500 HQs | Revenue |
|---|---|---|
| Healthcare | 2 | $309B |
|
||
| Insurance | 2 | $27B |
|
||
| Telecommunications / Media | 1 | $124B |
|
||
| Industrial Distribution | 1 | $22B |
|
||
| Financial Services | 1 | $20B |
|
||
| Chemicals / Materials | 1 | $18B |
|
||
Price history
+357.1% since first listed13 events — show timeline
- 2026-05-26 Price Changed $320,000 BRIGHT MLS
- 2026-05-26 Pending — BRIGHT MLS
- 2026-04-30 Listed $525,000 BRIGHT MLS
- 2022-06-28 Sold (Public Records) $382,900 Public Records
- 2022-06-28 Sold (MLS) $382,900 BRIGHT MLS
- 2022-06-01 Pending — BRIGHT MLS
- 2022-05-11 Listed $395,900 BRIGHT MLS
- 2020-03-10 Listing Removed — BRIGHT MLS
- 2019-10-11 Price Changed $295,000 BRIGHT MLS
- 2019-10-07 Price Changed $309,900 BRIGHT MLS
- 2019-08-19 Price Changed $314,900 BRIGHT MLS
- 2019-06-06 Listed $324,900 BRIGHT MLS
- 1986-12-26 Sold (Public Records) $70,000 Public Records
Property tax history
+3.4%/yrLatest (2026): $4,480 · +8.4% YoY. Source: county tax records.
Cash-flow waterfall
monthlySold comps — $/sqft
last 12 mo · ≤1 miLoading sold comps…