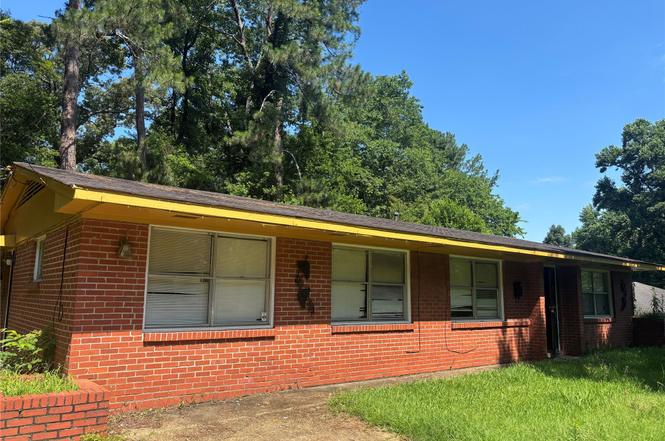
208 Greenridge Rd · Montgomery, AL
Flood risk 1/10 · Minimal
- FEMA flood zone
- X (unshaded)
- Chance of flooding over 30 yrs
- 0.0%
- Est. flood insurance / yr
- $507 – $1,088
Fire risk 1/10 · Minimal
- Est. fire insurance / yr
- $916 – $1,700
Heat risk 7/10 · Major
- Hot days now (above 107°F)
- 7 days/yr
- Hot days in 30 yrs
- 19 days/yr
Wind risk 8/10 · Major
- Chance of severe wind over 30 yrs
- 80.0%
Air-quality risk 3/10 · Minor
- Unhealthy air days now
- 4 days/yr
- Unhealthy air days in 30 yrs
- 4 days/yr
Risk factors via First Street. Map © Google.
Why this score? — see what drove the C grade
The composite is a weighted blend of 9 inputs, each scored 0–100. Each bar is that input's sub-score; the figure is the points it added to the 100-point composite (weight × sub-score).
- Cash flow +25.5/30.0
- DSCR +8.4/10.0
- ARV discount +7.1/15.0
- 1% rule +6.0/10.0
- Rent growth +3.2/5.0
- Livability +3.2/5.0
- Condition / age +2.5/5.0
- Schools +1.7/10.0
- Appreciation +0.0/10.0
$130,000
🖨 Deal sheet (PDF) 📄 Offer letter ✓ Due diligence
Listing remarks MLS
YOU MUST GO INSIDE THIS HOUSE UNBELIEVABLE!/MASTER BEDROOM ENLARGED WITH MASTER BATH FEATURING WHIRLPOOL TUB/ROOF 2002/CENTRAL H & A 1996/ MAYTAG STOVE 1996/TOP OF THE LINE DISHWASHER/SOME HARDWOOD UNDER CARPET LARGE SCREENED PORCH 16X21 THIS HOUSE WILL DEFINITELY NOT LAST
Key facts
- Large screened porch
- 0.31 acre lot
- Parking
Tags
Property features AI
Exterior
- Parking: Driveway
- Utilities: Natural gas available; Public water; Public sewer
- Home design: Single-story home; Brick construction; Slab foundation; Year built per public records
- Construction: Brick exterior; Slab foundation
- Exterior features: Fully fenced yard; Screened porch; Porch; City lot; Lot dimensions approximately 90 x 150
Interior
- Kitchen: Dishwasher; Electric range; Microwave; Refrigerator; Self-cleaning oven
- Flooring: Carpet; Wood
- Bathrooms: 2 full bathrooms
- Heating & cooling: Central heating (gas); Central air; Ceiling fans; Electric cooling
- Interior features: Blinds and window treatments; Storm door(s); Jetted tub; Linen closet
- Laundry & utility: Washer hookup; Dryer hookup; Gas water heater
Neighborhood map
What this means for you Summary
Snapshot
- This is a 3-bed/2.0-bath single-family listed at $130k.
Deal economics
- At list price, monthly cash flow is $302 ($4k/yr) — positive.
- The deal already cash-flows at list — no discount required.
- Meets the 1% rule at list price ($1k rent vs $130k).
- Cap rate 9.1% vs local median 6.0% in Montgomery — top-decile yield for the area; either an underpriced asset or a hidden risk that comps aren't pricing in. Stress-test before assuming the spread holds.
Location & tenants
- Location reads 65/100 on livability (#138 in AL) — a middle-class / working-renter tenant base. Strengths: cost of living A+, housing A+; Watch: schools C-, employment D, crime F.
- Montgomery County (urban): math 9% / reading 31% proficiency, ranked #106 of 129 in AL (top 82%) — low school quality limits family demand, transient renter base, plan for 1-2y turnover; 70% free/reduced lunch — lower-income household profile, screen leases tightly.
- Market conditions: Rents rising (+2.6%/yr); 207 active listings in the ZIP; 40 comparable units currently listed for rent nearby; rentals at typical pace (median 22d on market — plan ~3-4 weeks tenant-placement turnaround); 40% of comp listings sitting > 30 days — soft ceiling on asking rent; 460 units permitted in Montgomery County in 2024 (37 in 5+ unit buildings).
Forward outlook
- Local home prices are declining (-3.0%/yr); year-one equity from $899 of loan paydown is wiped out by about $4k of value loss. Plan a longer hold.
- Montgomery County population projected to shrink 8% by 2050 — rents likely to lag national; underwrite the cash flow, not the appreciation.
Negotiation context
- Only 7 days on market — expect competitive offers; lowballing is unlikely to land.
- 2 sale attempts since 24y ago with the ask held roughly flat each time — persistent listings suggest the price (not the market) is what's stuck; bring a comps-based counter.
Risks & watch-outs
- Watch-outs: built in 1956 — expect roof / HVAC / electrical / plumbing capex.
- Climate carrying-cost: severe wind risk, 80% chance of damaging wind over 30y; extreme-heat days projected 7→19/yr by 2055 (HVAC capex compounding) — expect insurance premiums to compound above CPI over the hold.
Questions for the listing agent
- Built in 1956 — when were the roof, HVAC, electrical panel, plumbing, and water heater last replaced?
- Is there a deadline driving the sale (1031 exchange, divorce, estate, relocation)? That informs how much negotiation room exists.
- Crime grade is F in this area — have there been break-ins, vandalism, or insurance claims at this property in the last 3 years? What carrier currently insures it and at what premium?
- What's the average days-on-market for RENTAL listings here right now (not sales)? A rising rental-DOM trend means longer vacancies and softer asking-rent achievability than the comps imply.
- What's the recent tenant-quality profile in this submarket — average credit score on applications, eviction rate, late-payment / NSF rate, and stable-employment percentage? A property-management company in the area should have these aggregated.
- How much new for-sale + rental construction is in the pipeline within 1–3 miles? Heavy new supply typically softens prices + rents 12–24 months out; constrained supply supports both.
Investment metrics
- 1% rule
- 1.10% ✓
- Cap rate
- 9.08%
- Cash-on-cash
- 9.95%
- DSCR
- 1.44
- GRM
- 7.6
CMA / ARV
- ARV (on-the-fly)
- $128,860
- Comps found
- 12
Show comp detail 12 sales within ~0.75 mi
| Address | Dist | Beds/Ba | Sqft | Sold | Price | $/sf | Match |
|---|---|---|---|---|---|---|---|
| 3326 Vermont Dr | 0.23mi | 3/2.0 | 1,568 (+3%) | 2mo | $80,000 | $51 | 82 |
| 3558 S Georgetown Dr | 0.64mi | 3/2.0 | 1,507 (-1%) | 1mo | $142,000 | $94 | 69 |
| 47 Salem Dr | 0.40mi | 3/2.0 | 1,419 (-6%) | 3mo | $162,500 | $115 | 68 |
| 403 Nottingham Rd | 0.61mi | 3/1.0 | 1,450 (-4%) | 0mo | $39,901 | $28 | 60 |
| 127 Salem Dr | 0.47mi | 3/1.0 | 1,391 (-8%) | 1mo | $118,000 | $85 | 60 |
| 20 Arden Rd | 0.74mi | 3/2.0 | 1,575 (+4%) | 1mo | $165,000 | $105 | 58 |
| 3 Kent St | 0.41mi | 3/2.0 | 1,305 (-14%) | 1mo | $102,750 | $79 | 57 |
| 753 Green Ridge Rd | 0.65mi | 3/2.0 | 1,634 (+8%) | 3mo | $163,600 | $100 | 54 |
| 3592 Pelzer Ave | 0.56mi | 3/1.5 | 1,676 (+11%) | 3mo | $125,000 | $75 | 52 |
| 3553 S Georgetown Dr | 0.66mi | 3/2.0 | 1,674 (+10%) | 0mo | $140,000 | $84 | 52 |
| 45 Kent St | 0.48mi | 3/1.0 | 1,338 (-12%) | 3mo | $94,000 | $70 | 52 |
| 664 Joryne Dr | 0.70mi | 3/2.0 | 1,363 (-10%) | 1mo | $129,000 | $95 | 50 |
Match score weights: distance 35% · size 25% · config 20% · recency 20%. Top-matched comps best support the ARV.
Projected returns pro-forma
-3.0% appreciation · 2.65% rent growth · sell at horizon
- IRR
- -1.7%
- Equity multiple
- 0.93×
- Total profit
- $-2,367
- Equity at exit
- $19,383
- IRR
- 7.6%
- Equity multiple
- 1.56×
- Total profit
- $20,556
- Equity at exit
- $11,240
Cash invested: $36,400 (down + closing). Projections, not guarantees.
Landlord ↔ Tenant lean methodology
- Overall (STATE)
- 90 Strongly Landlord-Friendly
- State Alabama
- 90 Strongly Landlord-Friendly · R+15
- County
- — inherits STATE
- City
- — inherits STATE
ZIP-level market 36109
- Home prices YoY
- -20.1%
- Rents YoY
- 2.6%
- Active inventory
- 207
- Price-to-rent
- 7.6×
Monthly cashflow live
- Estimated rent
- $1,424 high interval (Pro) →
- Mortgage (P&I)
- −$682
- Tax from tax record
- −$88 /mo · $1,051/yr
- Insurance
- −$54
- HOA
- −$0
- Vacancy / Maint / Mgmt
- −$299
- Net cashflow
- $302
Break-even live
Sensitivity live
| Price | -10% $375 | -5% $339 | +0% $302 | +5% $265 | +10% $228 |
|---|---|---|---|---|---|
| Rent | -10% $189 | -5% $246 | +0% $302 | +5% $358 | +10% $414 |
| Rate | -1.0pp $367 | -0.5pp $335 | base $302 | +0.5pp $268 | +1.0pp $234 |
UW: 25.0% down · 7.5% · 30yr · 1.5% tax · 5.0% vac · 8.0% maint · 8.0% mgmt
Financing live
Cash to close
- Down payment
- $32,500
- Closing costs
- $3,900
- Reserves months
- —
- Total cash needed
- —
Loan-product check · same deal, 3 products live
Conventional
25% down · 7.5% · 30yr
- Down + closing
- —
- Monthly P&I
- —
- Monthly cashflow
- —
- DSCR
- —
- Eligible?
- —
Personal DTI + credit; lowest rate.
DSCR
20% down · 8.5% · 30yr
- Down + closing
- —
- Monthly P&I
- —
- Monthly cashflow
- —
- DSCR
- —
- Eligible?
- —
No personal income docs; deal must DSCR.
Hard money
10% down · 12.0% · 12mo
- Down + closing
- —
- Monthly P&I
- —
- Monthly cashflow
- —
- DSCR
- —
- Eligible?
- —
Short-term bridge; refi at stabilization.
Rent comps 40 comps
| Address | Beds | Baths | Sqft | Rent | $/sqft | DOM | Units | Dist |
|---|---|---|---|---|---|---|---|---|
| 239 Forest Hills Dr Montgomery, AL | 4.0 | 1.5 | 1500 | $1,450 | $0.97 | 22d | 1 | 0.07mi |
| 3515 Cottonwood Dr Montgomery, AL | 3.0 | 1.5 | 1246 | $1,350 | $1.08 | 44d | 1 | 0.10mi |
| 3329 Vermont Dr Montgomery, AL | 3.0 | 1.5 | 1465 | $1,395 | $0.95 | 14d | 1 | 0.18mi |
| 118 Nottingham Ct Montgomery, AL | 3.0 | 2.0 | 1344 | $1,275 | $0.95 | 44d | 1 | 0.31mi |
| 3233 Hillcrest Ln Montgomery, AL | 3.0 | 2.0 | 1278 | $1,395 | $1.09 | 22d | 1 | 0.36mi |
| 401 Ridgewood Ln Montgomery, AL | 3.0 | 2.0 | 1513 | $1,195 | $0.79 | 22d | 1 | 0.37mi |
| 67 Holliday Dr Montgomery, AL | 3.0 | 1.0 | 1156 | $1,200 | $1.04 | 44d | 1 | 0.38mi |
| 167 E Salem Dr Montgomery, AL | 3.0 | 2.0 | 1700 | $1,050 | $0.62 | 44d | 1 | 0.46mi |
| 3309 Hillcrest Ln Unit 1043908P Montgomery, AL | 4.0 | 2.0 | 1625 | $2,885 | $1.78 | 22d | 1 | 0.46mi |
| 3602 Little John Dr Montgomery, AL | 4.0 | 1.0 | 1286 | $1,400 | $1.09 | 22d | 1 | 0.46mi |
| 200 Eton Rd Montgomery, AL | 3.0 | 1.5 | 1500 | $895 | $0.60 | 14d | 1 | 0.51mi |
| 3105 Pelzer Ave Montgomery, AL | 4.0 | 2.0 | 1605 | $1,425 | $0.89 | 44d | 1 | 0.51mi |
| 18 Oak Forest Dr Montgomery, AL | 3.0 | 2.0 | 1580 | $1,050 | $0.66 | 22d | 1 | 0.62mi |
| 107 Dalraida Rd Unit A Montgomery, AL | 3.0 | 2.0 | 1237 | $1,200 | $0.97 | 44d | 1 | 0.63mi |
| 19 Calhoun Rd Unit B Montgomery, AL | 2.0 | 1.0 | 2022 | $795 | $0.39 | 44d | 1 | 0.63mi |
| 122 Oak Forest Dr Montgomery, AL | 3.0 | 1.0 | 1092 | $975 | $0.89 | 22d | 1 | 0.63mi |
| 108 Calhoun Rd Unit 108B Montgomery, AL | 2.0 | 1.0 | 1350 | $750 | $0.56 | 44d | 1 | 0.65mi |
| 15 Bradley Dr Montgomery, AL | 3.0 | 2.0 | 1365 | $1,500 | $1.10 | 22d | 1 | 0.66mi |
| 7 Bradley Dr Montgomery, AL | 3.0 | 2.0 | 1529 | $1,500 | $0.98 | 14d | 1 | 0.66mi |
| 688 Joryne Dr Montgomery, AL | 3.0 | 2.0 | 1500 | $1,200 | $0.80 | 44d | 1 | 0.72mi |
| 3692 Fairfield Dr Montgomery, AL | 3.0 | 2.0 | 1524 | $1,400 | $0.92 | 22d | 1 | 0.73mi |
| 311 Bradley Dr Montgomery, AL | 3.0 | 1.0 | 1104 | $825 | $0.75 | 44d | 1 | 0.75mi |
| 3462 Biltmore Ave Montgomery, AL | 3.0 | 2.0 | 1685 | $1,225 | $0.73 | 22d | 1 | 0.77mi |
| 926 Green Ridge Ct Montgomery, AL | 3.0 | 2.0 | 1665 | $1,381 | $0.83 | 14d | 1 | 0.83mi |
| 610 S Georgetown Dr Unit 1386555P Montgomery, AL | 3.0 | 1.0 | 1474 | $3,635 | $2.47 | 14d | 1 | 0.84mi |
| 817 Dumont Dr Montgomery, AL | 3.0 | 2.0 | 1635 | $1,800 | $1.10 | 14d | 1 | 0.86mi |
| 2769 Pelzer Ave Montgomery, AL | 3.0 | 2.0 | 1608 | $1,325 | $0.82 | 44d | 1 | 0.87mi |
| 2814 Ashley Ave Montgomery, AL | 3.0 | 2.0 | 1683 | $1,350 | $0.80 | 14d | 1 | 0.88mi |
| 860 Greg Dr Montgomery, AL | 3.0 | 2.0 | 1400 | $1,295 | $0.93 | 14d | 1 | 0.89mi |
| 4023 Ware Hill Dr Unit 1507324P Montgomery, AL | 2.0 | 2.0 | 1420 | $4,076 | $2.87 | 14d | 1 | 0.89mi |
| 4046 Camellia Dr Unit 1 Montgomery, AL | 3.0 | 2.0 | 1500 | $1,200 | $0.80 | 44d | 1 | 0.91mi |
| 844 Sir Michael Dr Montgomery, AL | 4.0 | 2.0 | 1502 | $1,650 | $1.10 | 44d | 1 | 0.93mi |
| 4056 Wares Ferry Rd Montgomery, AL | 3.0 | 2.0 | 1800 | $1,500 | $0.83 | 14d | 1 | 0.97mi |
| 3737 Dalraida Pkwy Montgomery, AL | 3.0 | 1.0 | 1618 | $1,150 | $0.71 | 44d | 1 | 0.97mi |
| 3760 Dalraida Pkwy Montgomery, AL | 4.0 | 2.5 | 1900 | $1,850 | $0.97 | 44d | 1 | 0.98mi |
| 2822 Sumter Ave Montgomery, AL | 3.0 | 2.5 | 1617 | $1,300 | $0.80 | 22d | 1 | 0.99mi |
| 2310 Yancey Ave Montgomery, AL | 3.0 | 1.0 | 1212 | $1,250 | $1.03 | 44d | 1 | 1.00mi |
| 895 Greg Dr Montgomery, AL | 3.0 | 2.0 | 1489 | $1,600 | $1.07 | 14d | 1 | 1.01mi |
| 804 Hillman St Montgomery, AL | 3.0 | 2.0 | 1356 | $1,295 | $0.96 | 22d | 1 | 1.02mi |
| 804 Hillman St Montgomery, AL | 3.0 | 2.0 | 1370 | $1,295 | $0.95 | 14d | 1 | 1.02mi |
Listing history 7 events
-
2026-06-18days on market $130,000 Active 7 DOM
-
2026-06-17days on market $130,000 Active 6 DOM
-
2026-06-16days on market $130,000 Active 5 DOM
-
2026-06-15days on market $130,000 Active 4 DOM
-
2026-06-14days on market $130,000 Active 2 DOM
-
2026-06-13remarks 248-char remark
-
2026-06-13$130,000 Active 1 DOM
ⓘ Source: listings_history table (triggers on properties + properties_extension) + one-shot
backfill from property_details.listing_events for pre-trigger history.
Tax reassessment forecast AL · Resets to sale price
- Current annual tax
- $1,051 · $88/mo
- Projected year-2 tax
- $1,051 · $88/mo
- Expected delta
- $0/yr ($0/mo · 0.0%)
ⓘ Screening estimate from a state-policy table — verify with the county assessor before closing.
Climate risk First Street
- Flood 1/10 Low FEMA zone X (unshaded) · 0% chance over 30 yrs
- Wildfire 1/10 Low
- Heat 7/10 Severe 7 d/yr ≥107°F today · 19 d/yr by 30 yrs out
- Wind 8/10 Severe 80% chance of damaging wind over 30 yrs
- Air quality 3/10 Moderate 4 unhealthy d/yr today · 4 by 30 yrs out
Nearby sold comps map
Loading sold comps map…
Walkable amenities ~0.75 mi
Loading nearby amenities…
Taxation est. · year 1
- Rental income
- $17,093
- − Mortgage interest
- −$7,282
- − Property taxes
- −$1,051
- − Insurance
- −$650
- − Repairs & maintenance
- −$1,367
- − Management
- −$1,367
- − Depreciation
- −$3,782
- Taxable income
- $1,594
- Est. tax owed @ 24.0%
- −$382
- After-tax cash flow
- $3,239/yr
For passive investors: Depreciation is non-cash, so a rental often shows a tax loss while cash-flowing — sheltering income. Rental losses are passive: they offset passive income freely, and up to $25,000/yr can offset ordinary (W-2) income if you actively participate and your MAGI is under $100k (phasing out to $0 by $150k); unused losses carry forward. On sale, claimed depreciation is recaptured at up to 25%, and gains may owe capital-gains tax (a 1031 exchange can defer both). Figures are a year-1 estimate at your 24.0% rate — not tax advice; consult a CPA.
Schools (NCES district)
- District
- Montgomery County
- NCES district ID
- 0102430
- Math proficiency
- 9% ▼ -21.00%
- Reading proficiency
- 31% ▼ -1.00%
- Median HH income
- $43,902
- Composite
- 17.24/100
- National rank
- #9093
- State rank
- #106 of 129 in AL
Livability — Montgomery
- Score
- 65/100
- State rank
- #138
- US rank
- #13416
Category grades
Schools grade is shown separately in the Schools card above.
Census & demographics
- Census place
- Montgomery, AL
- County
- Montgomery County · 190,016 people
- City population
- 175,913
- Metro
- Montgomery, AL
- Population (ZIP)
- 23,581
- Household income
- $59,193
- Rent vs Own
- Severe rent burden
- 1039.0
Population outlook (Montgomery County) Hauer SSP2
- Today (2025)
- 224,008 people
- By 2030
- 221,460 · -1.1%
- By 2040
- 214,179 · -4.4%
- By 2050
- 204,912 · -8.5%
- By 2075
- 177,821 · -20.6%
- By 2100
- 145,134 · -35.2%
Race, ethnicity, and origin ACS 2023
- Neighborhood character
- Diverse neighborhood (Simpson 0.60)
- Race & ethnicity
- White 49% Black 39% Hispanic / Latino 8% Two or more races 4%
- Hispanic origin (detail)
- Mexican 4%
- Common ancestry
- Slovak 2% Lithuanian 1% Serbian 1%
- Foreign-born
- 4% · Canada, South Korea
- Languages at home
- 94% English-only · Spanish 5%
Political lean MEDSL · Montgomery
- 2024 margin
- Solid D (+30.7) · D 64.8% · R 34.1% · Other 1.1%
- 2008→2024 swing
- +11.5pp toward D · 2008: 19.2pp · 2024: 30.7pp
- All cycles
- 2024: D+30.7 2020: D+31.5 2016: D+26.2 2012: D+24.3 2008: D+19.2
Not yet ingested
- Civics
- —
Market trends
- HPI YoY
- ▼ -37.64%
- Current HPI
- 149.3867
- Rent YoY
- ▲ 2.65%
- Metro
- Montgomery, AL
- State GDP YoY
- ▲ 2.94%
- F500 in state
- 4
Industry mix (Fortune 500 HQ in AL)
| Industry | F500 HQs | Revenue |
|---|---|---|
| Financial Services | 1 | $8B |
|
||
| Healthcare | 1 | $5B |
|
||
Price history
+39.9% since first listed4 events — show timeline
- 2026-06-11 Listed $130,000 MAAR
- 2024-08-30 Sold (Public Records) $171,600 Public Records
- 2002-10-24 Sold (MLS) $89,000 MAAR
- 2002-09-10 Listed $92,900 MAAR
Property tax history
+11.6%/yrLatest (2025): $1,051 · +2.5% YoY. Source: county tax records.
Cash-flow waterfall
monthlySold comps — $/sqft
last 12 mo · ≤1 miLoading sold comps…