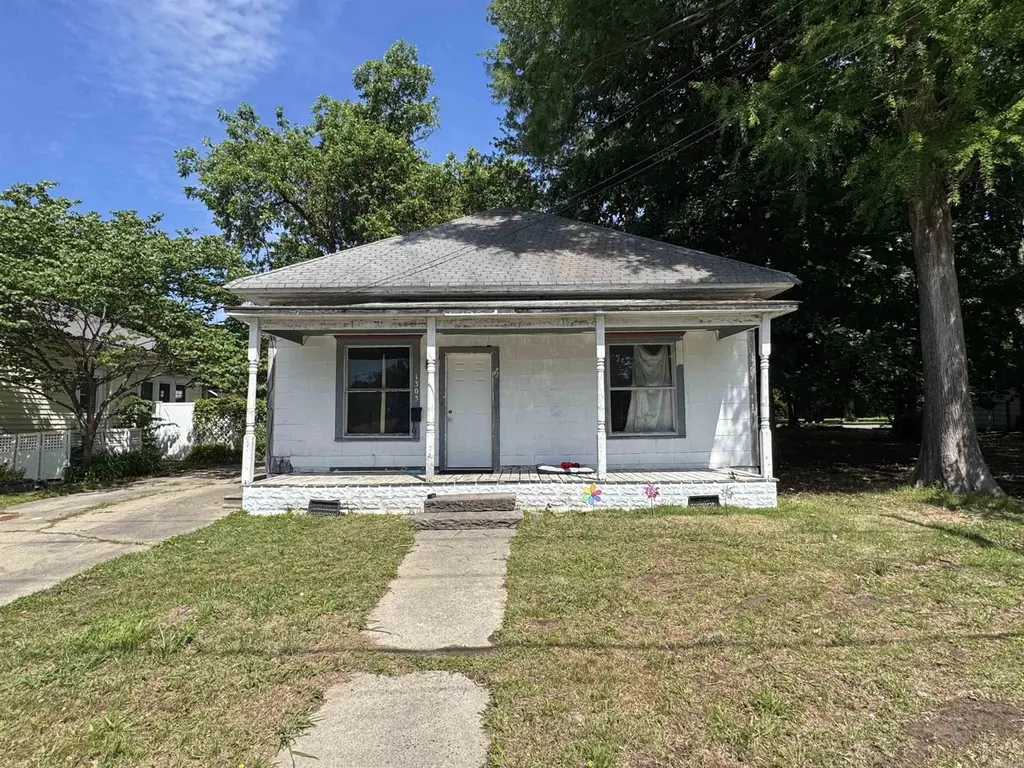
1303 S Buerkle St · Stuttgart, AR
Flood risk 1/10 · Minimal
- FEMA flood zone
- X (unshaded)
- Chance of flooding over 30 yrs
- 0.0%
- Est. flood insurance / yr
- $507 – $1,088
Fire risk 1/10 · Minimal
- Est. fire insurance / yr
- $1,499 – $2,785
Heat risk 6/10 · Moderate
- Hot days now (above 109°F)
- 7 days/yr
- Hot days in 30 yrs
- 19 days/yr
Wind risk 4/10 · Minor
- Chance of severe wind over 30 yrs
- 17.0%
Air-quality risk 1/10 · Minimal
- Unhealthy air days now
- 0 days/yr
- Unhealthy air days in 30 yrs
- 0 days/yr
Risk factors via First Street. Map © Google.
Why this score? — see what drove the B+ grade
The composite is a weighted blend of 9 inputs, each scored 0–100. Each bar is that input's sub-score; the figure is the points it added to the 100-point composite (weight × sub-score).
- Cash flow +30.0/30.0
- ARV discount +15.0/15.0
- 1% rule +10.0/10.0
- DSCR +10.0/10.0
- Livability +3.2/5.0
- Rent growth +2.5/5.0
- Condition / age +2.5/5.0
- Schools +2.2/10.0
- Appreciation +0.0/10.0
$55,000
🖨 Deal sheet 📄 Offer letter ✓ Due diligence
Listing remarks
This cute bungalow-style home has charm! Located on a prominent street in Stuttgart, this 3-bedroom, 1-bath single-story home offers plenty of potential and classic character waiting for your personal touch. Inside, you’ll find a big, roomy kitchen with ample space for cooking, gathering, and entertaining, along with a separate laundry room for added convenience. Enjoy relaxing mornings on the covered front porch, or take advantage of the deep backyard with plenty of room for outdoor living, gardening, pets, or future additions. Whether you’re a first-time buyer, investor, or someone looking for a home to make your own, this property is full of opportunity. Put your own mark on
Key facts
- Covered front porch
- Big roomy kitchen
- Bungalow style
Tags
Property features AI
Finance
- Other: Property inside city limits; Approximate lot dimensions 50' x 228' (about 0.3 acre)
- Financial info:
- HOA & community:
Exterior
- Parking:
- Security:
- Utilities: Public sewer; Public water; Electric service (municipal plus Entergy); Natural gas
- Home design: Frame and wood exterior
- Construction: Crawl space foundation with piers; 3-tab shingle roof
- Exterior features: Front porch; Outside storage area; Paved road access; Level lot
Interior
- Kitchen: Formica counters
- Bedrooms: Includes a formal living room and a laundry room
- Flooring: Carpet; Wood; Vinyl
- Bathrooms: 1 full bathroom
- Heating & cooling: Central gas heat; Central electric cooling
- Interior features: Gas water heater; Formica kitchen counters; Sheetrock and paneling walls/ceilings
- Laundry & utility: Laundry room
Neighborhood map
What this means for you Summary
Snapshot
- This is a 3-bed/1.0-bath single-family listed at $55k.
Deal economics
- At list price, monthly cash flow is $504 ($6k/yr) — positive.
- The deal already cash-flows at list — no discount required.
- Meets the 1% rule at list price ($1k rent vs $55k).
- Recommended offer: $53k (3.0% below list) — sets the bar for market timing.
Location & tenants
- Location reads 64/100 on livability (#163 in AR) — a middle-class / working-renter tenant base. Strengths: cost of living A+, housing A+, health & safety A+; Watch: employment D, schools F, crime F.
- Stuttgart School District (town): math 28% / reading 24% proficiency, ranked #180 of 238 in AR (top 76%) — low school quality limits family demand, transient renter base, plan for 1-2y turnover.
- Market conditions: 39 active listings in the ZIP; 17 units permitted in Arkansas County in 2024 (0 in 5+ unit buildings).
Forward outlook
- Local home prices are declining (-3.0%/yr); year-one equity from $380 of loan paydown is wiped out by about $2k of value loss. Plan a longer hold.
- Arkansas County population projected at -19% by 2050 — secular population decline; favor cash flow + early exit over multi-decade hold.
- At projected returns (-3.0% appreciation + 3.0% rent growth), your $15k cash investment doubles in ~3 years — after that, you're playing with house money.
Negotiation context
- It's been on market 41 days — a 3% lower offer ($53k) is reasonable based on typical stale-listing flexibility.
- Current owner paid $30k; list at $55k implies a 83% gain — meaningful room to come down on a strong offer.
Risks & watch-outs
- Climate carrying-cost: extreme-heat days projected 7→19/yr by 2055 (HVAC capex compounding) — expect insurance premiums to compound above CPI over the hold.
Questions for the listing agent
- It's been on market 41 days. Have you received any prior offers? Is the seller open to a 3% concession, seller financing, or rate buy-down credit?
- Built in 1960 — when were the roof, HVAC, electrical panel, plumbing, and water heater last replaced?
- Is there a deadline driving the sale (1031 exchange, divorce, estate, relocation)? That informs how much negotiation room exists.
- Schools are F-rated, which usually means shorter tenancies and higher turnover. Who's the typical renter profile here, and what's been the actual vacancy rate?
- Crime grade is F in this area — have there been break-ins, vandalism, or insurance claims at this property in the last 3 years? What carrier currently insures it and at what premium?
- What's the average days-on-market for RENTAL listings here right now (not sales)? A rising rental-DOM trend means longer vacancies and softer asking-rent achievability than the comps imply.
- What's the recent tenant-quality profile in this submarket — average credit score on applications, eviction rate, late-payment / NSF rate, and stable-employment percentage? A property-management company in the area should have these aggregated.
- How much new for-sale + rental construction is in the pipeline within 1–3 miles? Heavy new supply typically softens prices + rents 12–24 months out; constrained supply supports both.
Investment metrics
- 1% rule
- 1.98% ✓
- Cap rate
- 17.29%
- Cash-on-cash
- 39.29%
- DSCR
- 2.75
- GRM
- 4.2
CMA / ARV
- ARV (median comp)
- $79,438
- List price
- $55,000
- Delta
- -30.76%
- Verdict
- UNDERPRICED
- Comps
- 20 within 1.0 mi
Show comp detail 7 sales within ~0.75 mi
| Address | Dist | Beds/Ba | Sqft | Sold | Price | $/sf | Match |
|---|---|---|---|---|---|---|---|
| 612 W 13th | 0.10mi | 3/2.0 | 1,268 (+3%) | 12mo | $176,000 | $139 | 76 |
| 1010 S Columbus St | 0.27mi | 3/2.0 | 1,412 (+15%) | 4mo | $80,000 | $57 | 55 |
| 1912 S Lowe St | 0.48mi | 3/2.0 | 1,120 (-9%) | 6mo | $55,000 | $49 | 54 |
| 1706 S College St | 0.45mi | 2/1.0 (-1) | 1,120 (-9%) | 7mo | $22,900 | $20 | 53 |
| 1512 S Porter | 0.21mi | 3/1.0 | 1,066 (-13%) | 23mo | $77,000 | $72 | 49 |
| 1807 Weidner St | 0.55mi | 3/2.0 | 1,116 (-9%) | 23mo | $76,000 | $68 | 36 |
| 324 S Buerkle St | 0.59mi | 2/1.0 (-1) | 1,344 (+9%) | 21mo | $74,900 | $56 | 34 |
Match score weights: distance 35% · size 25% · config 20% · recency 20%. Top-matched comps best support the ARV.
Projected returns pro-forma
-3.0% appreciation · 3.0% rent growth · sell at horizon
- IRR
- 35.5%
- Equity multiple
- 2.51×
- Total profit
- $23,205
- Equity at exit
- $8,201
- IRR
- 42.3%
- Equity multiple
- 5.00×
- Total profit
- $61,567
- Equity at exit
- $4,755
Cash invested: $15,400 (down + closing). Projections, not guarantees.
Landlord ↔ Tenant lean methodology
- Overall (STATE)
- 92 Strongly Landlord-Friendly
- State Arkansas
- 92 Strongly Landlord-Friendly · R+14
- County
- — inherits STATE
- City
- — inherits STATE
ZIP-level market 72160
- Home prices YoY
- -31.9%
- Active inventory
- 39
- Price-to-rent
- 4.2×
Monthly cashflow live
- Estimated rent
- $1,089 medium interval (Pro) →
- Mortgage (P&I)
- −$288
- Tax from tax record
- −$45 /mo · $539/yr
- Insurance
- −$23
- HOA
- −$0
- Vacancy / Maint / Mgmt
- −$229
- Net cashflow
- $504
Break-even live
UW: 25.0% down · 7.5% · 30yr · 1.5% tax · 5.0% vac · 8.0% maint · 8.0% mgmt
Financing live
Cash to close
- Down payment
- $13,750
- Closing costs
- $1,650
- Reserves months
- —
- Total cash needed
- —
Loan-product check · same deal, 3 products live
Conventional
25% down · 7.5% · 30yr
- Down + closing
- —
- Monthly P&I
- —
- Monthly cashflow
- —
- DSCR
- —
- Eligible?
- —
Personal DTI + credit; lowest rate.
DSCR
20% down · 8.5% · 30yr
- Down + closing
- —
- Monthly P&I
- —
- Monthly cashflow
- —
- DSCR
- —
- Eligible?
- —
No personal income docs; deal must DSCR.
Hard money
10% down · 12.0% · 12mo
- Down + closing
- —
- Monthly P&I
- —
- Monthly cashflow
- —
- DSCR
- —
- Eligible?
- —
Short-term bridge; refi at stabilization.
Listing history 18 events
-
2026-06-19days on market $55,000 Active 41 DOM
-
2026-06-18days on market $55,000 Active 40 DOM
-
2026-06-17days on market $55,000 Active 39 DOM
-
2026-06-16days on market $55,000 Active 38 DOM
-
2026-06-15days on market $55,000 Active 37 DOM
-
2026-06-14days on market $55,000 Active 35 DOM
-
2026-06-12days on market $55,000 Active 34 DOM
-
2026-06-09days on market $55,000 Active 31 DOM
-
2026-06-08days on market $55,000 Active 30 DOM
-
2026-06-07days on market $55,000 Active 29 DOM
-
2026-06-07days on market $55,000 Active 28 DOM
-
2026-06-04days on market $55,000 Active 25 DOM
-
2026-06-02days on market $55,000 Active 24 DOM
-
2026-06-01days on market $55,000 Active 23 DOM
-
2026-05-31days on market $55,000 Active 22 DOM
-
2026-05-31days on market $55,000 Active 21 DOM
-
2026-05-08$55,000 New Listing 727-char remark
-
1996-01-19soldstatus $30,000
ⓘ Source: listings_history table (triggers on properties + properties_extension) + one-shot
backfill from property_details.listing_events for pre-trigger history.
Tax reassessment forecast AR · Resets to sale price
- Current annual tax
- $539 · $45/mo
- Projected year-2 tax
- $539 · $45/mo
- Expected delta
- $0/yr ($0/mo · 0.0%)
ⓘ Screening estimate from a state-policy table — verify with the county assessor before closing.
Climate risk First Street
- Flood 1/10 Low FEMA zone X (unshaded) · 0% chance over 30 yrs
- Wildfire 1/10 Low
- Heat 6/10 Major 7 d/yr ≥109°F today · 19 d/yr by 30 yrs out
- Wind 4/10 Moderate 17% chance of damaging wind over 30 yrs
- Air quality 1/10 Low 0 unhealthy d/yr today · 0 by 30 yrs out
Nearby sold comps map
Loading sold comps map…
Walkable amenities ~0.75 mi
Loading nearby amenities…
Taxation est. · year 1
- Rental income
- $13,071
- − Mortgage interest
- −$3,081
- − Property taxes
- −$539
- − Insurance
- −$275
- − Repairs & maintenance
- −$1,046
- − Management
- −$1,046
- − Depreciation
- −$1,600
- Taxable income
- $5,485
- Est. tax owed @ 24.0%
- −$1,316
- After-tax cash flow
- $4,735/yr
For passive investors: Depreciation is non-cash, so a rental often shows a tax loss while cash-flowing — sheltering income. Rental losses are passive: they offset passive income freely, and up to $25,000/yr can offset ordinary (W-2) income if you actively participate and your MAGI is under $100k (phasing out to $0 by $150k); unused losses carry forward. On sale, claimed depreciation is recaptured at up to 25%, and gains may owe capital-gains tax (a 1031 exchange can defer both). Figures are a year-1 estimate at your 24.0% rate — not tax advice; consult a CPA.
Schools (NCES district)
- District
- Stuttgart School District
- NCES district ID
- 0512960
- Math proficiency
- 28% ▼ -15.00%
- Reading proficiency
- 24% ▼ -6.00%
- Median HH income
- $38,851
- Composite
- 21.85/100
- National rank
- #8240
- State rank
- #180 of 238 in AR
Livability — Stuttgart
- Score
- 64/100
- State rank
- #163
- US rank
- #13757
Category grades
Schools grade is shown separately in the Schools card above.
Census & demographics
- Census place
- Stuttgart, AR
- Population (ZIP)
- 8,895
Population outlook (Arkansas County) Hauer SSP2
- Today (2025)
- 17,211 people
- By 2030
- 16,520 · -4.0%
- By 2040
- 15,158 · -11.9%
- By 2050
- 13,916 · -19.1%
- By 2075
- 11,278 · -34.5%
- By 2100
- 8,805 · -48.8%
Race, ethnicity, and origin ACS 2023
- Neighborhood character
- Majority White (57%)
- Race & ethnicity
- White 57% Black 38% Two or more races 4% Hispanic / Latino 2%
- Common ancestry
- Lithuanian 1% Slovak 1% Italian 1%
- Foreign-born
- 1% · Canada
- Languages at home
- 99% English-only · Spanish 1%
Political lean MEDSL · Arkansas
- 2024 margin
- Solid R (+44.1) · D 27.1% · R 71.2% · Other 1.7%
- 2008→2024 swing
- -21.7pp toward R · 2008: -22.4pp · 2024: -44.1pp
- All cycles
- 2024: R+44.1 2020: R+39.5 2016: R+30.6 2012: R+22.2 2008: R+22.4
Not yet ingested
- Civics
- —
Market trends
- HPI YoY
- ▼ -74.76%
- Current HPI
- 159.9216
- Rent YoY
- —
- Metro
- —
- State GDP YoY
- ▲ 3.80%
- F500 in state
- 10
Industry mix (Fortune 500 HQ in AR)
| Industry | F500 HQs | Revenue |
|---|---|---|
| Retail | 1 | $681B |
|
||
| Food / Agriculture | 1 | $53B |
|
||
| Retail / Energy | 1 | $22B |
|
||
| Transportation / Logistics | 1 | $12B |
|
||
| Energy | 1 | $4B |
|
||
Price history
+83.3% since first listed2 events — show timeline
- 2026-05-08 Listed $55,000 CARMLS
- 1996-01-19 Sold (Public Records) $30,000 Public Records
Property tax history
+15.9%/yrLatest (2025): $539 · +0.0% YoY. Source: county tax records.
Cash-flow waterfall
monthlySold comps — $/sqft
last 12 mo · ≤1 miLoading sold comps…