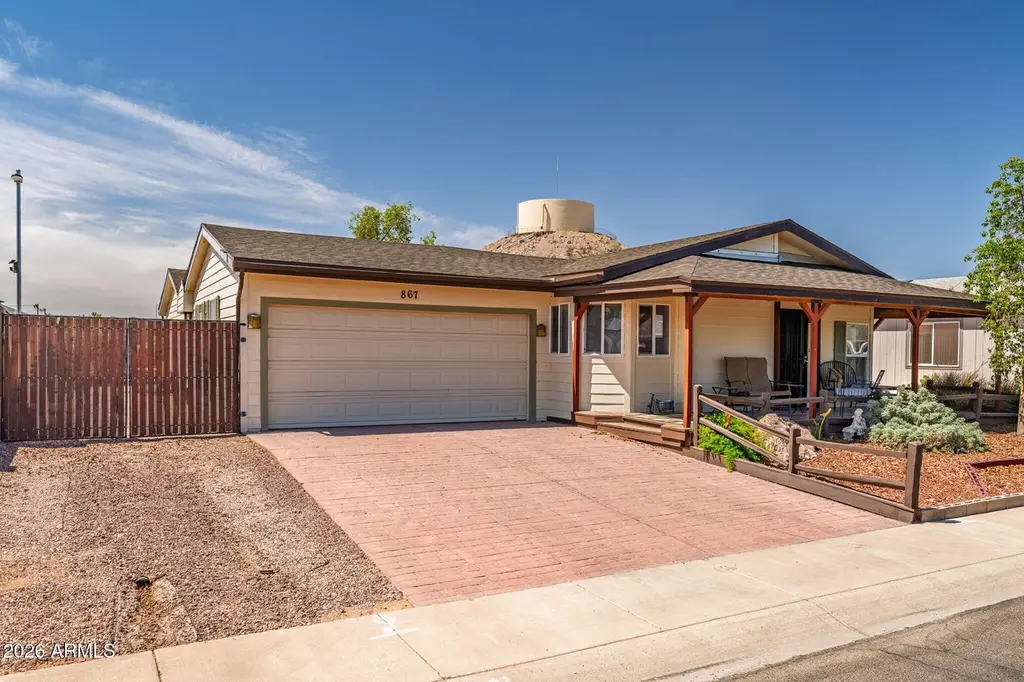
867 W Moon Shadow Dr · Casa Grande, AZ
Flood risk 1/10 · Minimal
- FEMA flood zone
- X (unshaded)
- Chance of flooding over 30 yrs
- 0.0%
- Est. flood insurance / yr
- $507 – $1,088
Fire risk 6/10 · Moderate
- Est. fire insurance / yr
- $610 – $1,132
Heat risk 9/10 · Severe
- Hot days now (above 113°F)
- 6 days/yr
- Hot days in 30 yrs
- 16 days/yr
Wind risk 1/10 · Minimal
- Chance of severe wind over 30 yrs
- —
Air-quality risk 2/10 · Minimal
- Unhealthy air days now
- 1 days/yr
- Unhealthy air days in 30 yrs
- 1 days/yr
Risk factors via First Street. Map © Google.
Why this score? — see what drove the F grade
The composite is a weighted blend of 9 inputs, each scored 0–100. Each bar is that input's sub-score; the figure is the points it added to the 100-point composite (weight × sub-score).
- Cash flow +11.6/30.0
- Rent growth +3.7/5.0
- DSCR +3.4/10.0
- 1% rule +3.3/10.0
- Livability +2.9/5.0
- Condition / age +2.5/5.0
- Schools +1.5/10.0
- ARV discount +0.6/15.0
- Appreciation +0.0/10.0
$269,000
🖨 Deal sheet 📄 Offer letter ✓ Due diligence
Listing remarks
Tucked away in a quiet, well-kept neighborhood with no HOA, this spacious 2,153 sq ft home (measured by professional appraiser) offers character, craftsmanship, and room to truly spread out. All on owned land, not leased land like many manufactured homes in the area. One of the home's most distinctive features is the custom covered front porch, a true conversation piece lovingly built by the seller's late husband, featuring beautiful wood detailing and a welcoming presence rarely found in the subdivision. Inside, you'll find an expansive open-concept layout with multiple living areas, warm wood finishes, and a stunning oversized family room featuring extensive custom woodwork and a lodge-st
Key facts
- 5,844 sq ft lot
- 2 garage spots
- Built 2003
Property features AI
Finance
- HOA & community: No association fees
Exterior
- Parking: 2 covered parking spaces; 2 open parking spaces; RV gate access
- Utilities: Private water company; Public sewer
- Home design: Manufactured / mobile home; Fee simple ownership
- Construction: Wood frame construction; Other roof type
- Exterior features: RV hookup; Natural desert front and back; Fenced (other)
Interior
- Kitchen: Refrigerator; Dishwasher; Pantry storage
- Bedrooms: Up to 3 bedrooms
- Bathrooms: 2 full bathrooms
- Heating & cooling: Natural gas heating; Central air conditioning
- Interior features: Pantry; Full bathroom in the primary bedroom; Solar panels
- Laundry & utility: Laundry area inside
Neighborhood map
What this means for you Summary
Snapshot
- This is a 3-bed/2.0-bath manufactured listed at $269k.
Deal economics
- At list price, monthly cash flow is $-85 ($-1k/yr) — negative.
- To cash-flow at today's rent, offer at most $257k (4.6% below list).
- To meet the 1% rule (rent ≥ 1% of price), the offer needs to be $225k (16.5% below list).
- Recommended offer: $225k (16.5% below list) — sets the bar for 1% rule.
- Cap rate 5.9% vs local median 4.1% in Casa Grande — top-decile yield for the area; either an underpriced asset or a hidden risk that comps aren't pricing in. Stress-test before assuming the spread holds.
Location & tenants
- Location reads 58/100 on livability (#220 in AZ) — a working-class tenant base; expect higher turnover. Strengths: cost of living A+, housing A+; Watch: crime D+, employment D+, amenities F.
- Casa Grande Union High School District (4453) (suburban): math 14% / reading 21% proficiency, ranked #193 of 249 in AZ (top 78%) — low school quality limits family demand, transient renter base, plan for 1-2y turnover.
- Zoned schools: Casa Grande Union High School (math 18% / reading 25%, grade F, #217 of 381 statewide, top 57%, 2,132 students, 52% FRL).
- Market conditions: Rents rising fast (+4.6%/yr); 628 active listings in the ZIP; 18 comparable units currently listed for rent nearby; rentals at typical pace (median 24d on market — plan ~3-4 weeks tenant-placement turnaround); 9,504 units permitted in Pinal County in 2024 (776 in 5+ unit buildings).
- This rent runs 39% of the median local income ($68k/yr) — at the standard rent-burdened threshold; future hikes will face affordability resistance.
Forward outlook
- Local home prices are declining (-3.0%/yr); year-one equity from $2k of loan paydown is wiped out by about $8k of value loss. Plan a longer hold.
Negotiation context
- It's been on market 28 days — a 2% lower offer ($265k) is reasonable based on typical stale-listing flexibility.
Risks & watch-outs
- Climate carrying-cost: major wildfire risk; extreme-heat days projected 6→16/yr by 2055 (HVAC capex compounding) — expect insurance premiums to compound above CPI over the hold.
Questions for the listing agent
- What do current leases actually rent for vs. the listed asking? Can we see a recent rent roll and the last 12 months of T-12 income?
- Is there a deadline driving the sale (1031 exchange, divorce, estate, relocation)? That informs how much negotiation room exists.
- Schools are F-rated, which usually means shorter tenancies and higher turnover. Who's the typical renter profile here, and what's been the actual vacancy rate?
- Crime grade is D in this area — have there been break-ins, vandalism, or insurance claims at this property in the last 3 years? What carrier currently insures it and at what premium?
- The area grade is low — what's the realistic commute time and amenity access for the typical tenant pool here? Any planned neighborhood developments (good or bad) we should know about?
- What's the average days-on-market for RENTAL listings here right now (not sales)? A rising rental-DOM trend means longer vacancies and softer asking-rent achievability than the comps imply.
- What's the recent tenant-quality profile in this submarket — average credit score on applications, eviction rate, late-payment / NSF rate, and stable-employment percentage? A property-management company in the area should have these aggregated.
- How much new for-sale + rental construction is in the pipeline within 1–3 miles? Heavy new supply typically softens prices + rents 12–24 months out; constrained supply supports both.
Investment metrics
- 1% rule
- 0.83% ✗
- Cap rate
- 5.91%
- Cash-on-cash
- -1.36%
- DSCR
- 0.94
- GRM
- 10.0
CMA / ARV
- ARV (on-the-fly)
- $233,280
- Comps found
- 12
Show comp detail 12 sales within ~0.75 mi
| Address | Dist | Beds/Ba | Sqft | Sold | Price | $/sf | Match |
|---|---|---|---|---|---|---|---|
| 1855 N Rim Rock Dr | 0.19mi | 3/2.0 | 1,729 (+0%) | 3mo | $240,000 | $139 | 88 |
| 868 W Desert Sky Dr | 0.07mi | 2/2.0 (-1) | 1,680 (-3%) | 0mo | $207,000 | $123 | 87 |
| 1890 N Ridge Way | 0.10mi | 3/2.0 | 1,624 (-6%) | 3mo | $274,900 | $169 | 83 |
| 962 W Diamond Rim Dr | 0.18mi | 3/2.0 | 1,792 (+4%) | 9mo | $253,000 | $141 | 78 |
| 1820 N Thornton Rd #908 | 0.07mi | 3/2.0 | 1,513 (-12%) | 3mo | $205,000 | $135 | 74 |
| 891 W Moon Shadow Dr | 0.03mi | 2/2.0 (-1) | 1,560 (-10%) | 12mo | $270,000 | $173 | 68 |
| 1869 N Rim Rock Dr | 0.19mi | 2/2.0 (-1) | 1,520 (-12%) | 6mo | $260,000 | $171 | 61 |
| 450 W Sunwest Dr #108 | 0.69mi | 3/2.0 | 1,800 (+4%) | 2mo | $99,000 | $55 | 60 |
| 1682 N Mesa Verde Dr | 0.66mi | 3/2.0 | 1,750 (+1%) | 10mo | $210,000 | $120 | 59 |
| 2054 N Thornton Rd #186 | 0.52mi | 2/2.0 (-1) | 1,545 (-11%) | 0mo | $105,000 | $68 | 52 |
| 450 W Sunwest Dr #98 | 0.69mi | 3/2.0 | 1,568 (-9%) | 12mo | $135,000 | $86 | 42 |
| 450 W Sunwest Dr #143 | 0.69mi | 2/2.0 (-1) | 1,568 (-9%) | 11mo | $75,000 | $48 | 39 |
Match score weights: distance 35% · size 25% · config 20% · recency 20%. Top-matched comps best support the ARV.
Projected returns pro-forma
-3.0% appreciation · 4.6% rent growth · sell at horizon
- IRR
- -16.8%
- Equity multiple
- 0.40×
- Total profit
- $-45,322
- Equity at exit
- $40,109
- IRR
- -5.9%
- Equity multiple
- 0.59×
- Total profit
- $-30,763
- Equity at exit
- $23,258
Cash invested: $75,320 (down + closing). Projections, not guarantees.
Landlord ↔ Tenant lean methodology
- Overall (STATE)
- 87 Strongly Landlord-Friendly
- State Arizona
- 87 Strongly Landlord-Friendly · R+3
- County
- — inherits STATE
- City
- — inherits STATE
ZIP-level market 85122
- Home prices YoY
- -22.4%
- Rents YoY
- 4.6%
- Active inventory
- 628
- Price-to-rent
- 10.0×
Monthly cashflow live
- Estimated rent
- $2,245 high interval (Pro) →
- Mortgage (P&I)
- −$1,411
- Tax est. 1.5%
- −$336 /mo · $4,035/yr
- Insurance
- −$112
- HOA
- −$0
- Vacancy / Maint / Mgmt
- −$471
- Net cashflow
- $-85
Break-even live
UW: 25.0% down · 7.5% · 30yr · 1.5% tax · 5.0% vac · 8.0% maint · 8.0% mgmt
Financing live
Cash to close
- Down payment
- $67,250
- Closing costs
- $8,070
- Reserves months
- —
- Total cash needed
- —
Loan-product check · same deal, 3 products live
Conventional
25% down · 7.5% · 30yr
- Down + closing
- —
- Monthly P&I
- —
- Monthly cashflow
- —
- DSCR
- —
- Eligible?
- —
Personal DTI + credit; lowest rate.
DSCR
20% down · 8.5% · 30yr
- Down + closing
- —
- Monthly P&I
- —
- Monthly cashflow
- —
- DSCR
- —
- Eligible?
- —
No personal income docs; deal must DSCR.
Hard money
10% down · 12.0% · 12mo
- Down + closing
- —
- Monthly P&I
- —
- Monthly cashflow
- —
- DSCR
- —
- Eligible?
- —
Short-term bridge; refi at stabilization.
Rent comps 18 comps
| Address | Beds | Baths | Sqft | Rent | $/sqft | DOM | Units | Dist |
|---|---|---|---|---|---|---|---|---|
| 767 W Barrus Dr Casa Grande, AZ | 3.0 | 2.0 | 1463 | $1,695 | $1.16 | 24d | 1 | 0.19mi |
| 803 W Jardin Dr Casa Grande, AZ | 3.0 | 2.0 | 1491 | $1,725 | $1.16 | 4d | 1 | 0.31mi |
| 736 W Palo Verde Dr Casa Grande, AZ | 3.0 | 2.0 | 1810 | $3,550 | $1.96 | 24d | 1 | 0.34mi |
| 645 W Jardin Dr Casa Grande, AZ | 3.0 | 2.0 | 1309 | $1,650 | $1.26 | 24d | 1 | 0.53mi |
| 776 W Fairlane Ct Casa Grande, AZ | 3.0 | 2.0 | 1489 | $3,200 | $2.15 | 24d | 1 | 0.54mi |
| 750 W Torino Pl Casa Grande, AZ | 3.0 | 2.0 | 2007 | $3,550 | $1.77 | 24d | 1 | 0.66mi |
| 845 W Crooked Stick Dr Casa Grande, AZ | 3.0 | 2.0 | 1601 | $2,000 | $1.25 | 24d | 1 | 0.68mi |
| 520 W Casa Mirage Ct Casa Grande, AZ | 3.0 | 2.0 | 1536 | $1,600 | $1.04 | 4d | 1 | 0.76mi |
| 1584 N Wood St Casa Grande, AZ | 4.0 | 2.0 | 1928 | $1,800 | $0.93 | 14d | 1 | 0.79mi |
| 2094 N Sweetwater Dr Casa Grande, AZ | 3.0 | 2.0 | 1266 | $1,700 | $1.34 | 24d | 1 | 0.95mi |
| 541 W Melrose Dr Casa Grande, AZ | 3.0 | 2.0 | 1101 | $1,600 | $1.45 | 24d | 1 | 1.04mi |
| 1858 N Center Ave Casa Grande, AZ | 2.0 | 2.0 | 1146 | $1,500 | $1.31 | 24d | 1 | 1.07mi |
| 1846 N Princeton Ave Casa Grande, AZ | 4.0 | 2.0 | 1786 | $1,750 | $0.98 | 4d | 1 | 1.28mi |
| 2356 N Sand Hills Ct Casa Grande, AZ | 3.0 | 2.0 | 1209 | $1,995 | $1.65 | 14d | 1 | 1.33mi |
| 1640 N Cameron St Unit 1640 Casa Grande, AZ | 3.0 | 2.5 | 1577 | $3,250 | $2.06 | 24d | 1 | 1.45mi |
| 1640 N Cameron St Casa Grande, AZ | 3.0 | 2.0 | 1577 | $3,250 | $2.06 | 23d | 1 | 1.46mi |
| 1640 N Cameron St Casa Grande, AZ | 3.0 | 2.0 | 1577 | $3,250 | $2.06 | 21d | 1 | 1.46mi |
| 1642 N Cameron St Casa Grande, AZ | 3.0 | 2.5 | 1577 | $3,250 | $2.06 | 24d | 1 | 1.46mi |
Listing history 16 events
-
2026-06-18days on market $269,000 Active 28 DOM
-
2026-06-17days on market $269,000 Active 27 DOM
-
2026-06-16days on market $269,000 Active 26 DOM
-
2026-06-15days on market $269,000 Active 25 DOM
-
2026-06-13days on market $269,000 Active 23 DOM
-
2026-06-13days on market $269,000 Active 22 DOM
-
2026-06-09days on market $269,000 Active 19 DOM
-
2026-06-08days on market $269,000 Active 18 DOM
-
2026-06-07days on market $269,000 Active 17 DOM
-
2026-06-04days on market $269,000 Active 14 DOM
-
2026-06-03days on market $269,000 Active 13 DOM
-
2026-06-02days on market $269,000 Active 12 DOM
-
2026-06-01days on market $269,000 Active 11 DOM
-
2026-05-31days on market $269,000 Active 10 DOM
-
2026-05-22$269,000 Active
-
2026-05-18price $269,000
ⓘ Source: listings_history table (triggers on properties + properties_extension) + one-shot
backfill from property_details.listing_events for pre-trigger history.
Climate risk First Street
- Flood 1/10 Low FEMA zone X (unshaded) · 0% chance over 30 yrs
- Wildfire 6/10 Major
- Heat 9/10 Extreme 6 d/yr ≥113°F today · 16 d/yr by 30 yrs out
- Wind 1/10 Low
- Air quality 2/10 Low 1 unhealthy d/yr today · 1 by 30 yrs out
Nearby sold comps map
Loading sold comps map…
Walkable amenities ~0.75 mi
Loading nearby amenities…
Taxation est. · year 1
- Rental income
- $26,941
- − Mortgage interest
- −$15,068
- − Property taxes
- −$4,035
- − Insurance
- −$1,345
- − Repairs & maintenance
- −$2,155
- − Management
- −$2,155
- − Depreciation
- −$7,825
- Taxable loss
- −$5,643
- Est. tax savings @ 24.0%
- +$1,354
- After-tax cash flow
- $330/yr
For passive investors: Depreciation is non-cash, so a rental often shows a tax loss while cash-flowing — sheltering income. Rental losses are passive: they offset passive income freely, and up to $25,000/yr can offset ordinary (W-2) income if you actively participate and your MAGI is under $100k (phasing out to $0 by $150k); unused losses carry forward. On sale, claimed depreciation is recaptured at up to 25%, and gains may owe capital-gains tax (a 1031 exchange can defer both). Figures are a year-1 estimate at your 24.0% rate — not tax advice; consult a CPA.
Schools (NCES district)
- District
- Casa Grande Union High School District (4453)
- NCES district ID
- 0401740
- Math proficiency
- 14% ▼ -15.00%
- Reading proficiency
- 21% ▼ -10.00%
- Median HH income
- $45,373
- Composite
- 15.38/100
- National rank
- #9319
- State rank
- #193 of 249 in AZ
Livability — Casa Grande
- Score
- 58/100
- State rank
- #220
- US rank
- #21534
Category grades
Schools grade is shown separately in the Schools card above.
Census & demographics
- Census place
- Casa Grande, AZ
- County
- Pinal County · 399,947 people
- City population
- 69,701
- Metro
- Phoenix-Mesa-Chandler, AZ
- Population (ZIP)
- 61,624
- Household income
- $68,443
- Rent vs Own
- Severe rent burden
- 1250.0
Population outlook (Pinal County) Hauer SSP2
- Today (2025)
- 437,574 people
- By 2030
- 446,903 · +2.1%
- By 2040
- 452,589 · +3.4%
- By 2050
- 444,126 · +1.5%
- By 2075
- 430,300 · -1.7%
- By 2100
- 393,536 · -10.1%
Race, ethnicity, and origin ACS 2023
- Neighborhood character
- Diverse neighborhood (Simpson 0.63)
- Race & ethnicity
- Hispanic / Latino 44% White 42% Two or more races 21% Black 4% Native American 4% Asian 1%
- Hispanic origin (detail)
- Mexican 40%
- Common ancestry
- Lithuanian 1% Slovak 1% Portuguese 1%
- Foreign-born
- 12% · Canada
- Languages at home
- 75% English-only · Spanish 23% Tagalog/Filipino 1% Other Indo-European 1%
Political lean MEDSL · Pinal
- 2024 margin
- Strong R (+22.1) · D 38.5% · R 60.6%
- 2008→2024 swing
- -7.6pp toward R · 2008: -14.5pp · 2024: -22.1pp
- All cycles
- 2024: R+22.1 2020: R+17.3 2016: R+19.3 2012: R+17.1 2008: R+14.5
Not yet ingested
- Civics
- —
Market trends
- HPI YoY
- ▼ -67.32%
- Current HPI
- 233.148
- Rent YoY
- ▲ 4.60%
- Metro
- Phoenix-Mesa-Chandler, AZ
- State GDP YoY
- ▲ 4.54%
- F500 in state
- 20
Industry mix (Fortune 500 HQ in AZ)
| Industry | F500 HQs | Revenue |
|---|---|---|
| Technology | 2 | $13B |
|
||
| Mining / Metals | 1 | $23B |
|
||
| Environmental Services | 1 | $16B |
|
||
| Metals / Steel | 1 | $14B |
|
||
| Technology Distribution | 1 | $9B |
|
||
| Homebuilding | 1 | $8B |
|
||
Price history
+0.0% since first listed2 events — show timeline
- 2026-05-22 Listed $269,000 ARMLS
- 2026-05-18 Price Changed $269,000 ARMLS
Property tax history
-6.1%/yrLatest (2025): $523 · -3.0% YoY. Source: county tax records.
Cash-flow waterfall
monthlySold comps — $/sqft
last 12 mo · ≤1 miLoading sold comps…