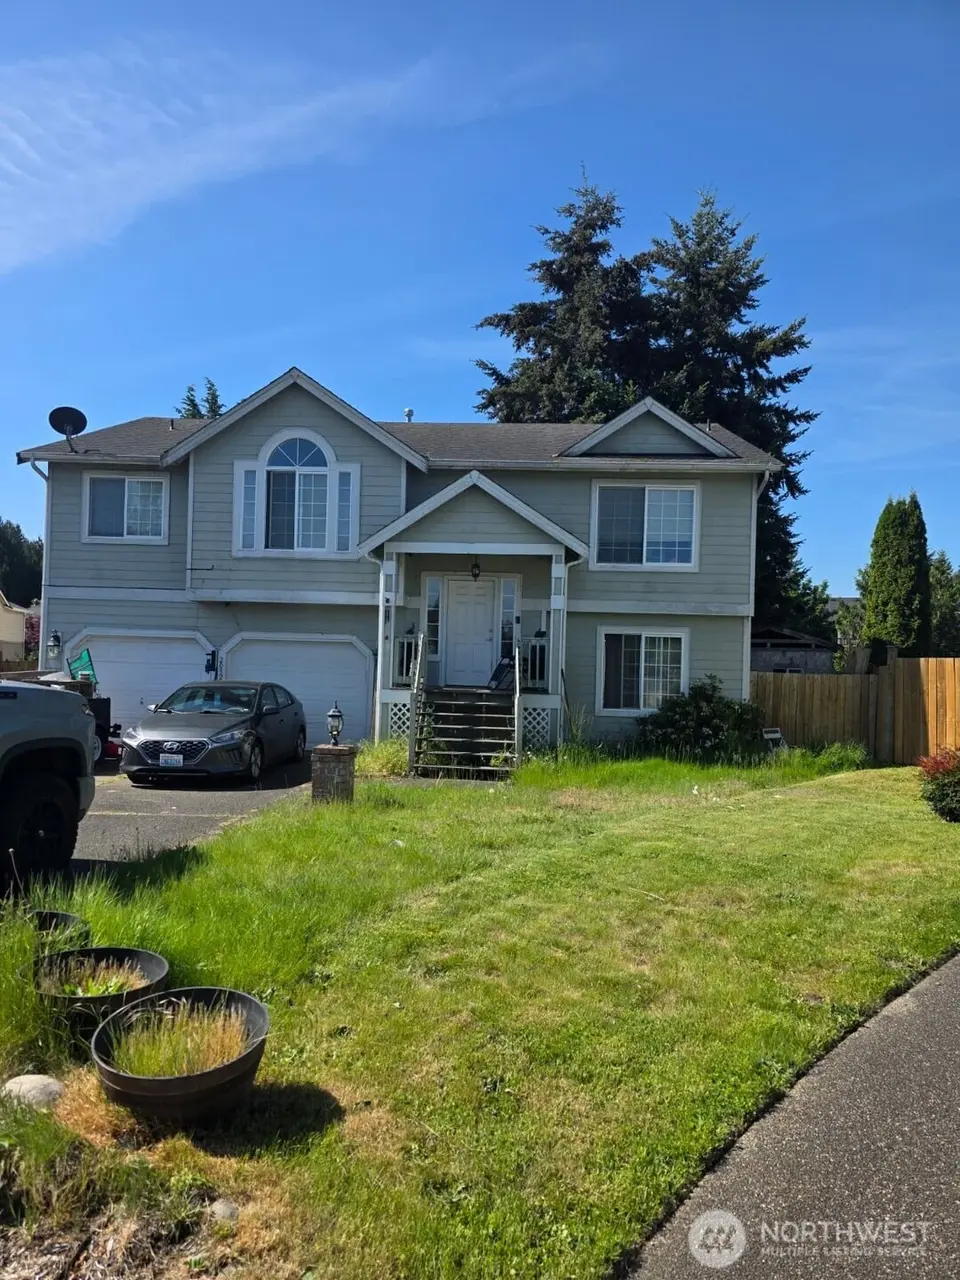
20324 86th Avenue Ct E · Graham, WA
Flood risk 1/10 · Minimal
- FEMA flood zone
- X (unshaded)
- Chance of flooding over 30 yrs
- 0.0%
- Est. flood insurance / yr
- $507 – $1,088
Fire risk 1/10 · Minimal
- Est. fire insurance / yr
- $604 – $1,122
Heat risk 3/10 · Minor
- Hot days now (above 87°F)
- 7 days/yr
- Hot days in 30 yrs
- 15 days/yr
Wind risk 1/10 · Minimal
- Chance of severe wind over 30 yrs
- —
Air-quality risk 7/10 · Major
- Unhealthy air days now
- 10 days/yr
- Unhealthy air days in 30 yrs
- 10 days/yr
Risk factors via First Street. Map © Google.
Why this score? — see what drove the D+ grade
The composite is a weighted blend of 9 inputs, each scored 0–100. Each bar is that input's sub-score; the figure is the points it added to the 100-point composite (weight × sub-score).
- ARV discount +15.0/15.0
- Cash flow +10.0/30.0
- Schools +4.9/10.0
- Rent growth +3.6/5.0
- 1% rule +3.3/10.0
- Livability +3.2/5.0
- DSCR +2.9/10.0
- Condition / age +2.5/5.0
- Appreciation +0.0/10.0
$399,000
🖨 Deal sheet (PDF) 📄 Offer letter ✓ Due diligence
Listing remarks
This is the house you've been working for! Sweat equity will pay off in droves on this house! You can always remodel, but its really hard to change the square footage. This home has over 2500 square feet of a canvas to work with. 2 different living areas with an upstairs living room and another separate area downstairs. Highly desirable area in the south hill area. Huge kitchen and huge master on the main. Impossible to find 5 bedroom. Great neighborhood minutes from i5 and 512 great shopping with Costco, the Southill mall, WinCo and everything you could wish for on Meridian.
Key facts
- Great neighborhood
- Huge kitchen
- 8,634 sq ft lot
Tags
Property features AI
Finance
- Other: Listing is active; Living area approximately 2,370 square feet
- Financial info: Accepted financing: Cash, Conventional, FHA, Rehab Loan
- HOA & community: HOA present with a $99 monthly association fee
Exterior
- Parking: Attached garage (has garage); 2 covered spaces; 2 uncovered parking spaces
- Security: Partially fenced
- Utilities: Electric power; Public water; Sewer connected; Internet: Xfinity
- Home design: Single-family residence; Split-entry / multi-level; Faces northeast; Built on lot
- Construction: Built in 2004 (effective year); Wood construction; Composition roof; Poured concrete foundation
- Exterior features: Wood exterior products; Deck; Partially fenced yard; Cable TV and high-speed internet available; Located on a cul-de-sac with paved streets and sidewalks; Level topography
Interior
- Kitchen: Dishwasher; Microwave; Refrigerator; Stove/Range; Pantry
- Bedrooms: 5 bedrooms total (3 on main level, 2 on lower level)
- Flooring: Vinyl plank; Carpet
- Bathrooms: 2 full bathrooms (1 on main level, 1 on lower level); Includes 1 bathtub and 1 shower
- Heating & cooling: Forced air heating; No central cooling listed
- Interior features: Fireplace; Pantry; Skylights
- Laundry & utility: Washer; Dryer
Neighborhood map
What this means for you Summary
Snapshot
- This is a 5-bed/3.0-bath single-family listed at $399k.
Deal economics
- At list price, monthly cash flow is $-240 ($-3k/yr) — negative.
- To cash-flow at today's rent, offer at most $357k (10.6% below list).
- To meet the 1% rule (rent ≥ 1% of price), the offer needs to be $329k (17.4% below list).
- Recommended offer: $329k (17.4% below list) — sets the bar for 1% rule.
- Cap rate 5.6% vs local median 3.6% in Graham — top-decile yield for the area; either an underpriced asset or a hidden risk that comps aren't pricing in. Stress-test before assuming the spread holds.
Location & tenants
- Location reads 64/100 on livability (#373 in WA) — a middle-class / working-renter tenant base. Strengths: employment A+, housing A+; Watch: crime C-, health & safety C-, amenities F.
- Bethel School District (suburban): math 47% / reading 59% proficiency, ranked #103 of 291 in WA (top 35%) — acceptable for families but not a draw, mixed tenant base, ~2y average lease.
- Zoned schools: Elk Plain School of Choice (570 students, 39% FRL); Liberty Middle School (936 students, 55% FRL); Graham Kapowsin High School (2,011 students, 49% FRL).
- Market conditions: Rents rising fast (+4.2%/yr); 388 active listings in the ZIP; 7 comparable units currently listed for rent nearby; rentals leasing fast (median 13d on market — plan ~1-2 weeks tenant-placement turnaround); solid renter incomes; 3,209 units permitted in Pierce County in 2024 (1,269 in 5+ unit buildings).
- This rent runs 37% of the median local income ($107k/yr) — at the standard rent-burdened threshold; future hikes will face affordability resistance.
Forward outlook
- Local home prices are declining (-3.0%/yr); year-one equity from $3k of loan paydown is wiped out by about $12k of value loss. Plan a longer hold.
- Pierce County population projected at +26% by 2050 — long-run rental-demand tailwind backs the buy-and-hold thesis.
Negotiation context
- It's been on market 27 days — a 2% lower offer ($393k) is reasonable based on typical stale-listing flexibility.
- 4 sale attempts since 23y ago with the ask held roughly flat each time — persistent listings suggest the price (not the market) is what's stuck; bring a comps-based counter.
- Current owner paid $277k; 44% above their basis — modest negotiation headroom, anchor on the comps not their cost.
Questions for the listing agent
- What do current leases actually rent for vs. the listed asking? Can we see a recent rent roll and the last 12 months of T-12 income?
- What does the HOA fee cover, when was the last increase, and are there any pending special assessments or reserve-fund shortfalls?
- Is there a deadline driving the sale (1031 exchange, divorce, estate, relocation)? That informs how much negotiation room exists.
- The area grade is low — what's the realistic commute time and amenity access for the typical tenant pool here? Any planned neighborhood developments (good or bad) we should know about?
- What's the average days-on-market for RENTAL listings here right now (not sales)? A rising rental-DOM trend means longer vacancies and softer asking-rent achievability than the comps imply.
- What's the recent tenant-quality profile in this submarket — average credit score on applications, eviction rate, late-payment / NSF rate, and stable-employment percentage? A property-management company in the area should have these aggregated.
- How much new for-sale + rental construction is in the pipeline within 1–3 miles? Heavy new supply typically softens prices + rents 12–24 months out; constrained supply supports both.
Investment metrics
- 1% rule
- 0.83% ✗
- Cap rate
- 5.57%
- Cash-on-cash
- -2.57%
- DSCR
- 0.89
- GRM
- 10.1
CMA / ARV
- ARV (on-the-fly)
- $571,170
- Comps found
- 12
Show comp detail 12 sales within ~0.75 mi
| Address | Dist | Beds/Ba | Sqft | Sold | Price | $/sf | Match |
|---|---|---|---|---|---|---|---|
| 20618 94th Ave E | 0.54mi | 6/2.5 (+1) | 2,367 (-0%) | 1mo | $611,000 | $258 | 67 |
| 19632 91st Ave E | 0.54mi | 5/3.5 | 2,524 (+6%) | 2mo | $544,000 | $216 | 61 |
| 20307 82nd Avenue Ct E | 0.23mi | 4/2.5 (-1) | 2,098 (-12%) | 4mo | $524,000 | $250 | 60 |
| 19705 88th Ave E | 0.40mi | 4/2.5 (-1) | 2,205 (-7%) | 4mo | $579,999 | $263 | 59 |
| 20522 95th Avenue Ct E | 0.58mi | 5/2.5 | 2,530 (+7%) | 1mo | $599,990 | $237 | 59 |
| 19117 87th Avenue Ct E | 0.75mi | 4/2.5 (-1) | 2,366 (-0%) | 4mo | $569,950 | $241 | 55 |
| 7713 197th Street Ct E | 0.71mi | 4/3.5 (-1) | 2,440 (+3%) | 1mo | $557,000 | $228 | 54 |
| 20404 97th Ave E #1 | 0.67mi | 4/3.0 (-1) | 2,500 (+6%) | 2mo | $599,990 | $240 | 53 |
| 20432 97th Ave E #8 | 0.67mi | 4/3.0 (-1) | 2,500 (+6%) | 2mo | $599,990 | $240 | 53 |
| 21114 94th Avenue Ct E | 0.68mi | 4/2.5 (-1) | 2,304 (-3%) | 5mo | $570,000 | $247 | 52 |
| 20428 97th Ave E #7 | 0.67mi | 4/3.0 (-1) | 2,500 (+6%) | 3mo | $590,000 | $236 | 52 |
| 19623 90th Avenue Ct E | 0.53mi | 4/2.5 (-1) | 2,066 (-13%) | 2mo | $555,000 | $269 | 46 |
Match score weights: distance 35% · size 25% · config 20% · recency 20%. Top-matched comps best support the ARV.
Projected returns pro-forma
-3.0% appreciation · 4.24% rent growth · sell at horizon
- IRR
- -19.1%
- Equity multiple
- 0.32×
- Total profit
- $-75,661
- Equity at exit
- $59,492
- IRR
- -9.3%
- Equity multiple
- 0.39×
- Total profit
- $-67,624
- Equity at exit
- $34,498
Cash invested: $111,720 (down + closing). Projections, not guarantees.
Landlord ↔ Tenant lean methodology
- Overall (STATE)
- 28 Tenant-Leaning
- State Washington
- 28 Tenant-Leaning · D+8
- County
- — inherits STATE
- City
- — inherits STATE
ZIP-level market 98387
- Rents YoY
- 4.2%
- Active inventory
- 388
- Price-to-rent
- 10.1×
Monthly cashflow live
- Estimated rent
- $3,294 high interval (Pro) →
- Mortgage (P&I)
- −$2,092
- Tax from tax record
- −$484 /mo · $5,810/yr
- Insurance
- −$166
- HOA
- −$99
- Vacancy / Maint / Mgmt
- −$692
- Net cashflow
- $-240
Break-even live
Sensitivity live
| Price | -10% $-14 | -5% $-127 | +0% $-240 | +5% $-353 | +10% $-466 |
|---|---|---|---|---|---|
| Rent | -10% $-500 | -5% $-370 | +0% $-240 | +5% $-110 | +10% $20 |
| Rate | -1.0pp $-39 | -0.5pp $-138 | base $-240 | +0.5pp $-343 | +1.0pp $-448 |
UW: 25.0% down · 7.5% · 30yr · 1.5% tax · 5.0% vac · 8.0% maint · 8.0% mgmt
Financing live
Cash to close
- Down payment
- $99,750
- Closing costs
- $11,970
- Reserves months
- —
- Total cash needed
- —
Loan-product check · same deal, 3 products live
Conventional
25% down · 7.5% · 30yr
- Down + closing
- —
- Monthly P&I
- —
- Monthly cashflow
- —
- DSCR
- —
- Eligible?
- —
Personal DTI + credit; lowest rate.
DSCR
20% down · 8.5% · 30yr
- Down + closing
- —
- Monthly P&I
- —
- Monthly cashflow
- —
- DSCR
- —
- Eligible?
- —
No personal income docs; deal must DSCR.
Hard money
10% down · 12.0% · 12mo
- Down + closing
- —
- Monthly P&I
- —
- Monthly cashflow
- —
- DSCR
- —
- Eligible?
- —
Short-term bridge; refi at stabilization.
Rent comps 7 comps
| Address | Beds | Baths | Sqft | Rent | $/sqft | DOM | Units | Dist |
|---|---|---|---|---|---|---|---|---|
| 20519 80th Ave E Spanaway, WA | 4.0 | 2.5 | 2031 | $2,925 | $1.44 | 6d | 1 | 0.41mi |
| 20604 95th Avenue Ct E Graham, WA | 6.0 | 3.5 | 2958 | $3,700 | $1.25 | 26d | 1 | 0.59mi |
| 20624 74th Ave E Spanaway, WA | 4.0 | 2.5 | 2197 | $1,400 | $0.64 | 0d | 1 | 0.85mi |
| 20121 70th Ave E Spanaway, WA | 4.0 | 3.0 | 1680 | $2,950 | $1.76 | 1d | 1 | 1.01mi |
| 18402 96th Ave E South Hill, WA | 4.0 | 2.5 | 2307 | $1,400 | $0.61 | 14d | 1 | 1.32mi |
| 18402 96th Ave E South Hill, WA | 4.0 | 2.5 | 2300 | $1,700 | $0.74 | 13d | 1 | 1.32mi |
| 18317 96th Ave E Puyallup, WA | 4.0 | 2.5 | 2150 | $5,500 | $2.56 | 45d | 1 | 1.34mi |
HOA detail
- Monthly dues
- $99 · $1,188/yr
Listing history 26 events
-
2026-06-21days on market $399,000 Active 27 DOM
-
2026-06-18days on market $399,000 Active 24 DOM
-
2026-06-17days on market $399,000 Active 23 DOM
-
2026-06-16days on market $399,000 Active 22 DOM
-
2026-06-15days on market $399,000 Active 21 DOM
-
2026-06-13days on market $399,000 Active 19 DOM
-
2026-06-13days on market $399,000 Active 18 DOM
-
2026-06-09days on market $399,000 Active 15 DOM
-
2026-06-08days on market $399,000 Active 14 DOM
-
2026-06-07days on market $399,000 Active 13 DOM
-
2026-06-04days on market $399,000 Active 10 DOM
-
2026-06-03days on market $399,000 Active 9 DOM
-
2026-06-02days on market $399,000 Active 8 DOM
-
2026-06-01days on market $399,000 Active 7 DOM
-
2026-05-31days on market $399,000 Active 6 DOM
-
2026-05-25$399,000 Active
-
2007-07-27soldstatus $277,000 Closed
-
2007-07-27soldstatus $277,000
-
2007-06-27historical
-
2007-06-17status
-
2007-05-01historical
-
2007-04-19$275,000
-
2003-07-23soldstatus $195,950
-
2003-07-23soldstatus $195,950
-
2003-06-02$197,950
-
1998-03-16soldstatus $180,000
ⓘ Source: listings_history table (triggers on properties + properties_extension) + one-shot
backfill from property_details.listing_events for pre-trigger history.
Tax reassessment forecast WA · Resets to sale price
- Current annual tax
- $5,810 · $484/mo
- Projected year-2 tax
- $5,810 · $484/mo
- Expected delta
- $0/yr ($0/mo · 0.0%)
ⓘ Screening estimate from a state-policy table — verify with the county assessor before closing.
Climate risk First Street
- Flood 1/10 Low FEMA zone X (unshaded) · 0% chance over 30 yrs
- Wildfire 1/10 Low
- Heat 3/10 Moderate 7 d/yr ≥87°F today · 15 d/yr by 30 yrs out
- Wind 1/10 Low
- Air quality 7/10 Severe 10 unhealthy d/yr today · 10 by 30 yrs out
Nearby sold comps map
Loading sold comps map…
Walkable amenities ~0.75 mi
Loading nearby amenities…
Taxation est. · year 1
- Rental income
- $39,526
- − Mortgage interest
- −$22,350
- − Property taxes
- −$5,810
- − Insurance
- −$1,995
- − Repairs & maintenance
- −$3,162
- − Management
- −$3,162
- − HOA
- −$1,188
- − Depreciation
- −$11,607
- Taxable loss
- −$9,749
- Est. tax savings @ 24.0%
- +$2,340
- After-tax cash flow
- $-537/yr
For passive investors: Depreciation is non-cash, so a rental often shows a tax loss while cash-flowing — sheltering income. Rental losses are passive: they offset passive income freely, and up to $25,000/yr can offset ordinary (W-2) income if you actively participate and your MAGI is under $100k (phasing out to $0 by $150k); unused losses carry forward. On sale, claimed depreciation is recaptured at up to 25%, and gains may owe capital-gains tax (a 1031 exchange can defer both). Figures are a year-1 estimate at your 24.0% rate — not tax advice; consult a CPA.
Schools (NCES district)
- District
- Bethel School District
- NCES district ID
- 5300480
- Math proficiency
- 47% ▬ 0.00%
- Reading proficiency
- 59% ▲ 2.00%
- Median HH income
- $65,872
- Composite
- 48.66/100
- National rank
- #4568
- State rank
- #103 of 291 in WA
Livability — Graham
- Score
- 64/100
- State rank
- #373
- US rank
- #14219
Category grades
Schools grade is shown separately in the Schools card above.
Census & demographics
- Census place
- Graham, WA
- County
- Pierce County · 788,257 people
- City population
- 32,687
- Metro
- Seattle-Tacoma-Bellevue, WA
- Population (ZIP)
- 50,774
- Household income
- $106,872
- Rent vs Own
- Severe rent burden
- 807.0
Population outlook (Pierce County) Hauer SSP2
- Today (2025)
- 956,648 people
- By 2030
- 1,010,862 · +5.7%
- By 2040
- 1,113,170 · +16.4%
- By 2050
- 1,206,524 · +26.1%
- By 2075
- 1,436,425 · +50.2%
- By 2100
- 1,563,654 · +63.5%
Race, ethnicity, and origin ACS 2023
- Neighborhood character
- Diverse neighborhood (Simpson 0.68)
- Race & ethnicity
- White 53% Two or more races 18% Hispanic / Latino 16% Black 10% Asian 6% Pacific Islander 4%
- Hispanic origin (detail)
- Mexican 10% Puerto Rican 2%
- Common ancestry
- Portuguese 3% Italian 3% Slovak 2%
- Foreign-born
- 11% · Canada, South Korea
- Languages at home
- 82% English-only · Spanish 7% Russian/Polish/Slavic 2% Other Asian/Pacific 2%
Political lean MEDSL · Pierce
- 2024 margin
- D (+10.8) · D 53.9% · R 43.1% · Other 3.0%
- 2008→2024 swing
- -1.4pp toward R · 2008: 12.2pp · 2024: 10.8pp
- All cycles
- 2024: D+10.8 2020: D+11.2 2016: D+7.5 2012: D+11.0 2008: D+12.2
Not yet ingested
- Civics
- —
Market trends
- HPI YoY
- ▼ -208.94%
- Current HPI
- 308.0462
- Rent YoY
- ▲ 4.24%
- Metro
- Seattle-Tacoma-Bellevue, WA
- State GDP YoY
- ▲ 4.65%
- F500 in state
- 22
Industry mix (Fortune 500 HQ in WA)
| Industry | F500 HQs | Revenue |
|---|---|---|
| Retail | 2 | $269B |
|
||
| Technology / Retail | 1 | $638B |
|
||
| Technology | 1 | $245B |
|
||
| Telecommunications | 1 | $38B |
|
||
| Food / Beverage | 1 | $36B |
|
||
| Automotive / Trucks | 1 | $34B |
|
||
Price history
+121.7% since first listed11 events — show timeline
- 2026-05-25 Listed $399,000 NWMLS as Distributed by MLS Grid
- 2007-07-27 Sold (Public Records) $277,000 Public Records
- 2007-07-27 Sold (MLS) $277,000 NWMLS as Distributed by MLS Grid
- 2007-06-27 Delisted — NWMLS as Distributed by MLS Grid
- 2007-06-17 Relisted — NWMLS as Distributed by MLS Grid
- 2007-05-01 Contingent — NWMLS as Distributed by MLS Grid
- 2007-04-19 Listed $275,000 NWMLS as Distributed by MLS Grid
- 2003-07-23 Sold (Public Records) $195,950 Public Records
- 2003-07-23 Sold (MLS) $195,950 NWMLS as Distributed by MLS Grid
- 2003-06-02 Listed $197,950 NWMLS as Distributed by MLS Grid
- 1998-03-16 Sold (Public Records) $180,000 Public Records
Property tax history
+3.6%/yrLatest (2026): $5,810 · +3.2% YoY. Source: county tax records.
Cash-flow waterfall
monthlySold comps — $/sqft
last 12 mo · ≤1 miLoading sold comps…